2009 European Parliament election in Poland
The European Parliament election of 2009 in Poland was the election of the delegation from Poland to the European Parliament in 2009 which took place on 7 June 2009.[1] On 13 February the Sejm (the lower house of the Polish parliament) accepted a proposal for an amendment to the electoral court act to allow voting for the European Parliament election of 2009 to take place over 2 days i.e. the 6 and 7 June 2009. However, on 5 March, the proposal was referred to the Constitutional Tribunal of the Republic of Poland by the Polish President, Lech Kaczyński.[2]
| |||||||||||||||||||||||||||||||||||||||||||||||||||||||||||||||||
50 seats to the European Parliament | |||||||||||||||||||||||||||||||||||||||||||||||||||||||||||||||||
|---|---|---|---|---|---|---|---|---|---|---|---|---|---|---|---|---|---|---|---|---|---|---|---|---|---|---|---|---|---|---|---|---|---|---|---|---|---|---|---|---|---|---|---|---|---|---|---|---|---|---|---|---|---|---|---|---|---|---|---|---|---|---|---|---|---|
| Turnout | 24.53% | ||||||||||||||||||||||||||||||||||||||||||||||||||||||||||||||||
| |||||||||||||||||||||||||||||||||||||||||||||||||||||||||||||||||
 | |||||||||||||||||||||||||||||||||||||||||||||||||||||||||||||||||

.jpg)

The Polish electorate elected 50 MEPs.[1] In the 27 EU Member States, at total of 736 MEPs were elected from 4–7 June 2009.[1]
Outcome
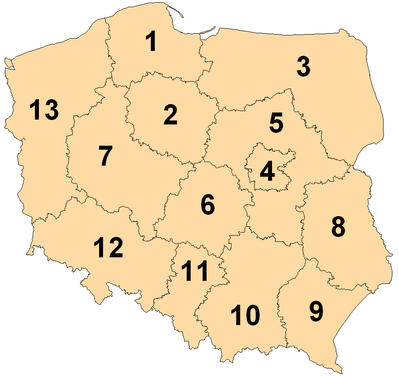
As anticipated, the Civic Platform (PO) won a significant victory, winning more than 44% of the vote and gaining half of the total seats. PO's vote was higher than their 41.5% achieved at the 2007 Polish parliamentary election, and to date was the highest vote achieved by a Polish political party to either the Sejm (national legislature) or the European Parliament. Law and Justice (PiS), came second (27.4%), having more than doubled their vote and seats won as compared to the 2004 EU election, but their vote fell, in comparison to the national elections of 2007. PO polled strongest in the western half of Poland, whilst PiS polled best in the eastern half, particularly the south-east.
The largest grouping on the left, the Democratic Left Alliance-Labor Union (SLD-UP) came in at a distant third with 12.3% of the vote and seven seats. At one time, the biggest party in Poland, the Democratic Left Alliance's vote was fairly static over the past five years, and they have been unable to challenge the dominance of PO and PiS, since 2005. The Polish People's Party (PSL) came fourth with 7% of the vote, and won three seats. The remaining parties failed to reach the 5% threshold required to win seats.
The election result demonstrated a stability in voting patterns in the country. Previously, especially prior to 2005, the political environment in Poland was rather unpredictable, with big swings away from established parties, towards alternative parties, and ongoing splits and mergers of key parties. In 2009, however, the voting pattern did not vary too substantially from the 2007 elections, with the large parties consolidating their positions, and smaller parties failing to make a breakthrough.
Contesting committees
Results
| 2004 • 2009 • 2014 • 2019 | ||||||||
| National party | European party | Votes | % | +/– | Seats | +/– | ||
|---|---|---|---|---|---|---|---|---|
| Civic Platform (PO) | EPP | 3,271,852 | 44.43 | 20.33 |
25 / 50 |
10 | ||
| Law and Justice (PiS) | AEN | 2,017,607 | 27.40 | 14.73 |
15 / 50 |
8 | ||
| Democratic Left Alliance – Labor Union (SLD–UP) | PES | 908,765 | 12.34 | 2.99 |
7 / 50 |
2 | ||
| People's Party (PSL) | EPP | 516,146 | 7.01 | 0.67 |
3 / 50 |
1 | ||
Agreement for the Future – CenterLeft
|
PES + ALDE | 179,602 | 2.44 | 10.49 |
0 | 7 | ||
| Right of the Republic (PR) | None | 143,966 | 1.95 | new | 0 | 0 | ||
| Self-Defense of the Republic of Poland (SRP) | UEN | 107,185 | 1.46 | 9.32 |
0 | 6 | ||
| Libertas Poland (LP) | LIBERTAS | 83,754 | 1.14 | 14.78 |
0 | 10 | ||
| Real Politics Union (UPR) | None | 81,146 | 1.10 | 0.77 |
0 | 0 | ||
| Labour Party (PPP) | EACL | 51,872 | 0.70 | 0.16 |
0 | 0 | ||
| Others | 2,868 | 0.04 | 0 | — | ||||
| Valid votes | 7,364,763 | 98.17 | ||||||
| Blank and invalid votes | 137,573 | 1.83 | ||||||
| Totals | 7,502,336 | 100.00 | — | 50 | 4 | |||
| Electorate (eligible voters) and voter turnout | 30,565,272 | 24.53 | 3.66 |
|||||
| Source: Pe2009.pkw.gov.pl | ||||||||
Summary of 7 June 2009 European Parliament elections
| European party | Seats 2004 | Seats 2009 | Change | |||||
|---|---|---|---|---|---|---|---|---|
| European People's Party (EPP) | 19 | 28 | +9 | |||||
| Union for Europe of the Nations (UEN) | 13 | 15 | +2 | |||||
| Party of European Socialists (PES) | 8 | 7 | -1 | |||||
| Libertas.eu (Libertas) | - | 0 | - | |||||
| Independence/Democracy (ID) | 10 | 0 | -10 | |||||
| Alliance of Liberals and Democrats for Europe (ALDE) | 4 | 0 | -4 | |||||
| 54 | 50 | -4 | ||||||
| Source: http://pe2009.pkw.gov.pl/PUE/PL/WYN/W/index.htm | ||||||||
Leaders by Constituency
Opinion polls
| Source | Date | PO | PiS | SLD-UP | PSL | PdP | Undecided |
|---|---|---|---|---|---|---|---|
| CBOS | March 2009 | 40% | 17% | 10% | 5% | 1% | 21% |
| TNS OBOP | 2–5 April 2009 | 54% | 21% | 7% | 6% | – | 28% |
| PBS | 3–5 April 2009 | 49% | 22% | 13% | 6% | 3% | – |
| GFK | 24–26 April 2009 | 47% | 26% | 12% | 6% | – | – |
| Gemius | 5 May 2009 | 40% | 16% | 11% | 3% | 2% | – |
| TNS OBOP | 6–7 May 2009 | 47% | 22% | 12% | 8% | 2% | – |
| Homo Homini | 7 May 2009 | 48.9% | 22.4% | 12.2% | 4.6% | 1.3% | 8% |
| TNS OBOP | 15 May 2009 | 48% | 25% | 8% | 5% | 5% | |
| Gemius | 19 May 2009 | 39% | 20% | 7% | 6% | 4% | – |
| Homo Homini | 26 May 2009 | 45% | 25% | 11% | 7% | 3% | – |
| GFK | 3–4 June 2009 | 51% | 24% | 15% | 6% | – | – |
| SMG/KRC | 5 June 2009 | 54% | 25% | 9% | 7% | – | – |
References
- "Wybory Europejskie – 7 czerwca 2009". europarl.europa.eu (in Polish). 2009 European Parliament. Retrieved 6 March 2009.
- "Nowela ordynacji wyborczej zaskarżona" (in Polish). Presspublica Sp. z o.o. 6 March 2009. Archived from the original on 27 September 2011. Retrieved 8 March 2009.
- Leading candidate in Warsaw (if the party leader does not run personally in another district)
- As the election committees: Social Democracy of Poland, Freedom Union, Greens 2004
- As the election committee of the League of Polish Families
External links
| 1979 | |
|---|---|
| 1984 | |
| 1989 | |
| 1994 | |
| 1999 | |
| 2004 | |
| 2009 | |
| 2014 | |
| 2019 | |
| 2024 |
|
| Off-year | |
| Presidential elections | |
|---|---|
| Legislative elections | |
| Local elections | |
| European elections | |
| Referendums | |
| |