2004 European Parliament election in Ireland
The 2004 European Parliament election in Ireland was the Irish component of the 2004 European Parliament election. The voting was held on Friday, 11 June 2004. The election coincided with the 2004 local elections. The election was conducted under the single transferable vote.
| ||||||||||||||||||||||||||||||||||||||||||||||||||||||||||||||||||||||||||||||||||
13 seats to the European Parliament | ||||||||||||||||||||||||||||||||||||||||||||||||||||||||||||||||||||||||||||||||||
|---|---|---|---|---|---|---|---|---|---|---|---|---|---|---|---|---|---|---|---|---|---|---|---|---|---|---|---|---|---|---|---|---|---|---|---|---|---|---|---|---|---|---|---|---|---|---|---|---|---|---|---|---|---|---|---|---|---|---|---|---|---|---|---|---|---|---|---|---|---|---|---|---|---|---|---|---|---|---|---|---|---|---|
| ||||||||||||||||||||||||||||||||||||||||||||||||||||||||||||||||||||||||||||||||||
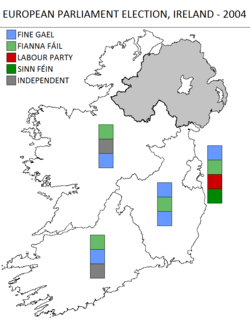 Colours indicate winning party. | ||||||||||||||||||||||||||||||||||||||||||||||||||||||||||||||||||||||||||||||||||
.jpg)
| Members of the European Parliament for Ireland | |
|---|---|
| 1st delegation | (1973) |
| 2nd delegation | (1973–1977) |
| 3rd delegation | (1977–1979) |
| 1st term | (1979) |
| 2nd term | (1984) |
| 3rd term | (1989) |
| 4th term | (1994) |
| 5th term | (1999) |
| 6th term | (2004) |
| 7th term | (2009) |
| 8th term | (2014) |
| 9th term | (2019) |
| List of women MEPs | |
Since the 1999 European Parliament election Ireland's entitlement had fallen from 15 seats to 13 seats due to European Union expansion and some constituencies boundaries and names were changed.
- Munster constituency lost County Clare and was reduced from 4 seats to 3 and renamed South
- Connacht–Ulster gained County Clare and was renamed North-West
- Leinster had no boundary changes but was reduced from 4 seats to 3 and renamed East
- Dublin was unchanged
Results
The election was organised by city/county council area, the basis for the local elections being held simultaneously. Voters received different-coloured ballot papers for the European election, city/county council election, and a constitutional referendum, all of which went into the same ballot box and were separated by colour once the boxes arrived at the count centre for the city/county. Not all voters received all ballots as the franchises differ. The European ballots were all counted in one city/county, necessitating a second transportation of the separated ballots from the other city/county centres. For example, the East ballots were counted in Navan, County Meath.[1]
| Party | Party Leader | 1st Pref Vote | % | ±% | Seats | ± | |
|---|---|---|---|---|---|---|---|
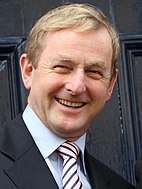
| Fine Gael | Enda Kenny | 494,412 | 27.8 | +3.2 | 5 | +1 | |
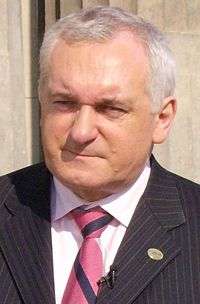
| Fianna Fáil | Bertie Ahern | 524,504 | 29.5 | −9.1 | 4 | −2 | |
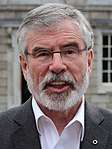
| Sinn Féin | Gerry Adams | 197,715 | 11.1 | +4.8 | 1 | +1 | |
| Labour Party | Pat Rabbitte | 188,132 | 10.5 | +1.8 | 1 | ±0 | |
| Green Party | Trevor Sargent | 76,917 | 4.3 | −2.4 | 0 | −2 | |
| Socialist Party | Joe Higgins | 23,218 | 1.3 | +0.5 | 0 | ±0 | |
| Independent | 275,870 | 15.5 | +1.2 | 2 | ±0 | ||
| Total | 1,780,768 | 100 | — | 13 | –2 | ||
Voting details

| Constituency | Electorate | Turnout | Spoilt | Valid Poll | Quota | Seats | Candidates |
|---|---|---|---|---|---|---|---|
| Dublin | 821,723 | 435,136 (52.9%) | 13,239 (3.0%) | 421,897 | 84,380 | 4 | 12 |
| East | 806,598 | 471,895 (58.5%) | 18,717 (3.9%) | 453,178 | 113,295 | 3 | 13 |
| North-West | 688,804 | 435,910 (63.3%) | 14,487 (3.3%) | 421,423 | 105,356 | 3 | 9 |
| South | 802,359 | 498,394 (62.1%) | 14,124 (2.8%) | 484,270 | 121,068 | 3 | 10 |
| Total | 3,119,484 | 1,841,335 (59.0%) | 60,567 (3.3%) | 1,780,768 | — | 13 | 44 |
See also
- List of members of the European Parliament for Ireland, 2004–09 – List ordered by constituency
- For the Northern Ireland European Parliament elections, see 2004 UK European Parliament election.
References
- Murphy, Tom (10 June 2004). "91,000 people are eligible to vote". Wicklow People. Retrieved 19 October 2018.
External links
- ElectionsIreland.org – 2004 European Parliament (Ireland) election results
- European Election News by European Election Law Association (Eurela)
| Dáil elections | |
|---|---|
| Seanad elections | |
| Presidential elections | |
| European elections | |
| Local elections | |
| Referendums | |
| |