Vlasotince
| Vlasotince Власотинце | ||
|---|---|---|
| Town and municipality | ||
 Vlasotince, town centre | ||
| ||
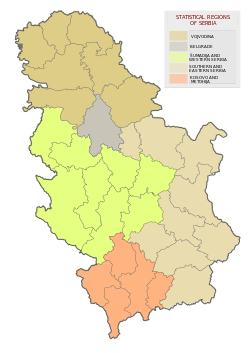
 Location of the municipality of Vlasotince within Serbia | ||
| Coordinates: 42°58′N 22°08′E / 42.967°N 22.133°ECoordinates: 42°58′N 22°08′E / 42.967°N 22.133°E | ||
| Country |
| |
| Region | Southern and Eastern Serbia | |
| District | Jablanica | |
| Settlements | 48 | |
| Area[1] | ||
| • Town | 15.91 km2 (6.14 sq mi) | |
| • Municipality | 308 km2 (119 sq mi) | |
| Elevation | 234 m (768 ft) | |
| Population (2011 census)[2] | ||
| • Town | 15,830 | |
| • Town density | 990/km2 (2,600/sq mi) | |
| • Municipality | 29,669 | |
| • Municipality density | 96/km2 (250/sq mi) | |
| Time zone | UTC+1 (CET) | |
| • Summer (DST) | UTC+2 (CEST) | |
| Postal code | 16210 | |
| Area code | +381(0)16 | |
| Car plates | VL | |

Vlasotince (Serbian Cyrillic: Власотинце) is a town and municipality located in Jablanica District of southern Serbia. As of 2011, the municipality has 29,669 inhabitants, while the town itself has a population of 15,830 inhabitants.
History
According to Turkish records, the town existed in the 15th century as a Turkish administrative center. After the Turks were forced out of Serbia, locals started growing wine grapes as a kind of complementary business to their building activities. They made Vlasotince the number one wine region in the former Yugoslavia and furthermore the biggest wine exporter in the Balkans. The craftsmanship and building skills of workers and builders from this region were appreciated in the former Yugoslavia and its surrounding neighbours until the Yugoslav Wars.
Settlements
Aside from the town of Vlasotince, the municipality includes the following settlements:
Demographics
| Historical population | ||
|---|---|---|
| Year | Pop. | ±% p.a. |
| 1948 | 33,845 | — |
| 1953 | 35,224 | +0.80% |
| 1961 | 35,625 | +0.14% |
| 1971 | 36,022 | +0.11% |
| 1981 | 35,863 | −0.04% |
| 1991 | 34,302 | −0.44% |
| 2002 | 33,312 | −0.27% |
| 2011 | 29,893 | −1.20% |
| Source: [3] | ||
According to the 2011 census results, the municipality of Vlasotince has a population of 29,893 inhabitants.
Ethnic groups
Ethnic composition of the municipality:
| Ethnic group | Population |
|---|---|
| Serbs | 28,613 |
| Romani | 691 |
| Romanians | 10 |
| Bulgarians | 5 |
| Gorani | 3 |
| Russians | 2 |
| Others | 12 |
| Total | 29,893 |
Economy
The following table gives a preview of total number of employed people per their core activity (as of 2016):[4]
| Activity | Total |
|---|---|
| Agriculture, forestry and fishing | 37 |
| Mining | 19 |
| Processing industry | 2,034 |
| Distribution of power, gas and water | 30 |
| Distribution of water and water waste management | 108 |
| Construction | 670 |
| Wholesale and retail, repair | 774 |
| Traffic, storage and communication | 108 |
| Hotels and restaurants | 159 |
| Media and telecommunications | 35 |
| Finance and insurance | 26 |
| Property stock and charter | 1 |
| Professional, scientific, innovative and technical activities | 134 |
| Administrative and other services | 34 |
| Administration and social assurance | 265 |
| Education | 454 |
| Healthcare and social work | 350 |
| Art, leisure and recreation | 82 |
| Other services | 77 |
| Total | 5,400 |
Notable people
- Nenad Filipović, athletics
- Predrag Filipović, athletics
- Aleksandar Davinic (journalist Politike-satirist),
- Slaviša Stojanović, football coach
- Tihomir Stanojevic (first commander of police of Belgrade )
- Bogoljub Mitić Đoša, actor and comedian
- Milica Brankovic Most beautiful Cabin Senior
See also
References
- ↑ "Municipalities of Serbia, 2006". Statistical Office of Serbia. Retrieved 2010-11-28.
- ↑ "2011 Census of Population, Households and Dwellings in the Republic of Serbia: Comparative Overview of the Number of Population in 1948, 1953, 1961, 1971, 1981, 1991, 2002 and 2011, Data by settlements" (PDF). Statistical Office of Republic Of Serbia, Belgrade. 2014. ISBN 978-86-6161-109-4. Retrieved 2014-06-27.
- ↑ "2011 Census of Population, Households and Dwellings in the Republic of Serbia" (PDF). stat.gov.rs. Statistical Office of the Republic of Serbia. Retrieved 12 January 2017.
- ↑ "ОПШТИНЕ И РЕГИОНИ У РЕПУБЛИЦИ СРБИЈИ, 2017" (PDF). stat.gov.rs (in Serbian). Statistical Office of the Republic of Serbia. Retrieved 20 February 2017.
External links
| Wikimedia Commons has media related to Vlasotince. |
Capital: Vlasotince | ||
| Villages |
|  |
| Landmarks |
| |
| Culture |
| |
| Notable people |
| |