United States presidential election in Washington (state), 1924
|
| |||||||||||||||||||||||||||||||||
| |||||||||||||||||||||||||||||||||
| |||||||||||||||||||||||||||||||||
| |||||||||||||||||||||||||||||||||

| Elections in Washington |
|---|
 |
|
General elections
Gubernatorial elections
Attorney General elections Secretary of State elections State Senate elections State House elections State Supreme Court elections Other judicial elections |
|
|
The 1924 United States presidential election in Washington took place on November 4, 1924. All contemporary forty-eight states took part, and Washington State's voters selected seven voters to the Electoral College, who voted for president and vice president.
Rapid recovery of the economy from a sharp recession following World War I transformed the 1920s into a strongly Republican decade. Even the problematic issue of a farm depression had eased by the time of the election as prices recovered.[1] It was also widely thought that the Teapot Dome scandal could do nothing to revive the Democrats as they were well known to have equally severe problems therewith via the fact that recently deceased Woodrow Wilson had paid one hundred and fifty thousand dollars in legal fees to nomination frontrunner William McAdoo.[2]
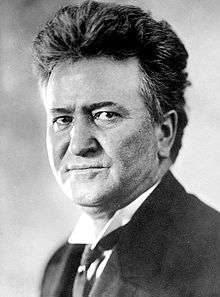
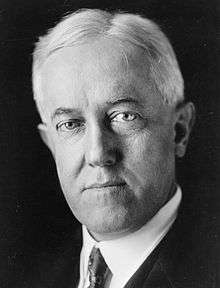
The conservatism of Democratic nominee John W. Davis – the first presidential nominee since the Civil War from an antebellum slave state and the only one ever from West Virginia[3] – led those with more progressive views to desert the two major parties for the third-party candidacy of "Fighting Bob" La Follette. His campaign, based on improved labour laws, an end to US involvement in the politics of Latin America, and cheap credit for farmers, had major appeal in the West, and in Washington State La Follette won five of thirty-nine counties (including absolute majorities in the eastern counties of Franklin and Adams) and finished ahead of Davis in every county except far southeastern Garfield County and Columbia County.
Results
| United States presidential election in Washington State, 1924[4] | |||||
|---|---|---|---|---|---|
| Party | Candidate | Votes | Percentage | Electoral votes | |
| Republican | Calvin Coolidge | 220,224 | 52.24% | 7 | |
| Progressive | Robert M. La Follette | 150,727 | 35.76% | 0 | |
| Democratic | John W. Davis | 42,842 | 10.16% | 0 | |
| American Party | Gilbert Nations | 5,911 | 1.42% | 0 | |
| Socialist Labor | Frank T. Johns | 1,004 | 0.24% | 0 | |
| Communist | William Z. Foster | 761 | 0.18% | 0 | |
| Totals | 3,263,939 | 100.0% | 7 | ||
Results by county
| County | Coolidge# | Coolidge% | Davis# | Davis% | La Follette#[5] | La Follette% | Others#[lower-alpha 1] | Others% | Total votes cast[6] |
|---|---|---|---|---|---|---|---|---|---|
| Adams | 760 | 37.51% | 228 | 11.25% | 1,036 | 51.14% | 2 | 0.10% | 2,026 |
| Asotin | 1,094 | 46.51% | 508 | 21.60% | 728 | 30.95% | 22 | 0.94% | 2,352 |
| Benton | 1,812 | 45.33% | 437 | 10.93% | 1,711 | 42.81% | 37 | 0.93% | 3,997 |
| Chelan | 4,543 | 55.56% | 995 | 12.17% | 2,584 | 31.60% | 55 | 0.67% | 8,177 |
| Clallam | 2,129 | 52.07% | 283 | 6.92% | 1,639 | 40.08% | 38 | 0.93% | 4,089 |
| Clark | 5,215 | 47.61% | 2,004 | 18.29% | 3,573 | 32.62% | 162 | 1.48% | 10,954 |
| Columbia | 1,122 | 52.11% | 522 | 24.25% | 492 | 22.85% | 17 | 0.79% | 2,153 |
| Cowlitz | 3,274 | 55.66% | 927 | 15.76% | 1,609 | 27.35% | 72 | 1.22% | 5,882 |
| Douglas | 1,070 | 42.19% | 398 | 15.69% | 1,053 | 41.52% | 15 | 0.59% | 2,536 |
| Ferry | 507 | 34.49% | 349 | 23.74% | 605 | 41.16% | 9 | 0.61% | 1,470 |
| Franklin | 709 | 31.15% | 237 | 10.41% | 1,301 | 57.16% | 29 | 1.27% | 2,276 |
| Garfield | 875 | 65.25% | 324 | 24.16% | 140 | 10.44% | 2 | 0.15% | 1,341 |
| Grant | 813 | 40.87% | 332 | 16.69% | 823 | 41.38% | 21 | 1.06% | 1,989 |
| Grays Harbor | 8,273 | 60.16% | 1,239 | 9.01% | 4,079 | 29.66% | 160 | 1.16% | 13,751 |
| Island | 832 | 46.25% | 114 | 6.34% | 830 | 46.14% | 23 | 1.28% | 1,799 |
| Jefferson | 913 | 51.79% | 143 | 8.11% | 692 | 39.25% | 15 | 0.85% | 1,763 |
| King | 60,438 | 53.51% | 7,404 | 6.56% | 41,146 | 36.43% | 3,952 | 3.50% | 112,940 |
| Kitsap | 3,954 | 45.19% | 490 | 5.60% | 4,215 | 48.17% | 91 | 1.04% | 8,750 |
| Kittitas | 2,360 | 47.22% | 455 | 9.10% | 2,112 | 42.26% | 71 | 1.42% | 4,998 |
| Klickitat | 1,482 | 52.72% | 518 | 18.43% | 790 | 28.10% | 21 | 0.75% | 2,811 |
| Lewis | 6,973 | 58.07% | 1,544 | 12.86% | 3,392 | 28.25% | 98 | 0.82% | 12,007 |
| Lincoln | 2,042 | 46.16% | 743 | 16.79% | 1,629 | 36.82% | 10 | 0.23% | 4,424 |
| Mason | 902 | 49.02% | 179 | 9.73% | 741 | 40.27% | 18 | 0.98% | 1,840 |
| Okanogan | 2,531 | 50.41% | 721 | 14.36% | 1,735 | 34.55% | 34 | 0.68% | 5,021 |
| Pacific | 2,672 | 64.57% | 501 | 12.11% | 930 | 22.47% | 35 | 0.85% | 4,138 |
| Pend Oreille | 1,025 | 51.05% | 231 | 11.50% | 749 | 37.30% | 3 | 0.15% | 2,008 |
| Pierce | 21,376 | 47.70% | 4232 | 9.44% | 18,467 | 41.20% | 743 | 1.66% | 44,818 |
| San Juan | 744 | 66.67% | 86 | 7.71% | 284 | 25.45% | 2 | 0.18% | 1,116 |
| Skagit | 5,071 | 47.95% | 699 | 6.61% | 4,714 | 44.57% | 92 | 0.87% | 10,576 |
| Skamania | 533 | 52.15% | 207 | 20.25% | 275 | 26.91% | 7 | 0.68% | 1,022 |
| Snohomish | 10,484 | 48.82% | 1,548 | 7.21% | 8,929 | 41.58% | 512 | 2.38% | 21,473 |
| Spokane | 23,403 | 49.30% | 6,036 | 12.71% | 17,824 | 37.55% | 210 | 0.44% | 47,473 |
| Stevens | 2,909 | 48.94% | 685 | 11.52% | 2,273 | 38.24% | 77 | 1.30% | 5,944 |
| Thurston | 5,125 | 57.77% | 943 | 10.63% | 2,710 | 30.55% | 93 | 1.05% | 8,871 |
| Wahkiakum | 496 | 60.49% | 89 | 10.85% | 228 | 27.80% | 7 | 0.85% | 820 |
| Walla Walla | 5,465 | 58.83% | 1,662 | 17.89% | 2,125 | 22.87% | 38 | 0.41% | 9,290 |
| Whatcom | 9,214 | 57.19% | 927 | 5.75% | 5,812 | 36.08% | 157 | 0.97% | 16,110 |
| Whitman | 4,960 | 52.12% | 1,745 | 18.34% | 2,787 | 29.29% | 24 | 0.25% | 9,516 |
| Yakima | 12,124 | 63.72% | 2,157 | 11.34% | 3,965 | 20.84% | 782 | 4.11% | 19,028 |
| Totals | 220,224 | 52.24% | 42,842 | 10.16% | 150,727 | 35.76% | 7,756 | 1.84% | 421,549 |
References
- ↑ Roseboom, Eugene Holloway and Eckes, Alfred E.; A History of Presidential Elections, from George Washington to Jimmy Carter; pp. 151-158 ISBN 0020364202
- ↑ Yergin, Daniel; The Prize: The Epic Quest for Oil, Money and Power; p. 198 ISBN 1439134839
- ↑ ‘What States do Presidents Come From?’
- ↑ "1924 Presidential Election Results - Washington". Dave Leip's U.S. Election Atlas. Retrieved 2017-01-11.
- ↑ Géoelections; Popular Vote for Robert LaFollette (xlsx file for €15)
- ↑ Scammon, Richard M. (compiler); America at the Polls: A Handbook of Presidential Election Statistics 1920-1964; p. 488 ISBN 0405077114
Notes
- ↑ 5,911 votes for American Party Gilbert Nations, 761 for Communist William Foster and 1,004 for Frank Johns – division by county unavailable
| Candidates | 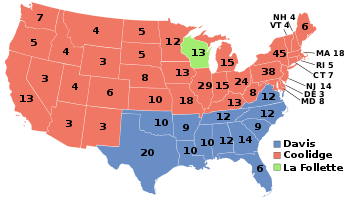 | |
|---|---|---|
| General articles |
| |
| Local results |
| |
| Other 1924 elections | ||