List of cities in the European Union by population within city limits
Below is a list of the largest cities in the European Union according to the population within their city limits.[Note 1] The cities listed all have populations over 300,000. The list deals exclusively with the areas within city administrative boundaries as opposed to urban areas or larger urban zones (metropolitan areas), which are generally larger in terms of population than the main city.
As some cities have very narrow city limits and others very wide, the list may not give an accurate view of the comparative magnitude of different places, and the figures in the list should be treated with caution. Paris is the most populous urban area in the European Union, but the strict definition of the administrative limits of the City of Paris results in a far lower population shown in the table.
Cities by population within city limits
Cities in bold are capital cities of their respective countries; Brussels (italics) is the capital of both Belgium and de facto the European Union.
| City | Country | Official population |
Date of census | Reference | Photography |
|---|---|---|---|---|---|
| London[Note 2] | 8,825,001 | 28 June 2018 | [1] |  | |
| Berlin | 3,711,930 | 31 December 2017 | [2] | 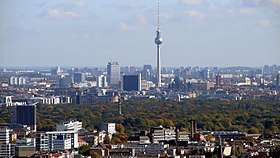 | |
| Madrid | 3,182,981 | 1 January 2017 | [3] | _16.jpg) | |
| Rome | 2,879,215 | 31 December 2016 | [4] | 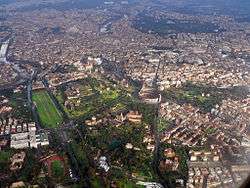 | |
| Paris | 2,206,488 | 7 January 2018 | [5][6] |  | |
| Bucharest | 2,106,144 | 1 January 2016 | [7] |  | |
| Vienna | 1,889,083 | 1 January 2018 | [8] |  | |
| Hamburg | 1,787,408 | 30 December 2015 | [9] |  | |
| Warsaw | 1,764,615 | 31 December 2017 | [10] | .jpg) | |
| Budapest | 1,752,704 | 1 January 2017 | [11] |  | |
| Barcelona | 1,620,809 | 1 January 2017 | [3] | .JPG) | |
| Munich | 1,464,301 | 31 December 2016 | [12] |  | |
| Milan | 1,369,466 | 30 April 2018 | [4] | 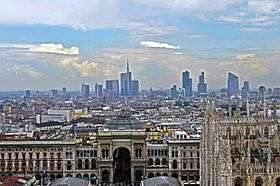 | |
| Sofia | 1,307,376 | 31 December 2016 | [13] | .JPG) | |
| Prague | 1,294,513 | 1 January 2018 | [14] |  | |
| Brussels[Note 3] | 1,191,604 | 1 January 2017 | [15] | 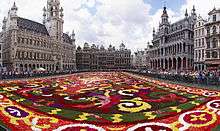 | |
| Birmingham | 1,124,569 | 30 June 2017 | [1] |  | |
| Cologne | 1,075,935 | 31 December 2016 | [16][17] |  | |
| Naples | 970,185 | 31 December 2016 | [4] | 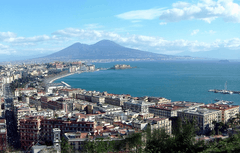 | |
| Stockholm | 949,164 | 1 November 2017 | [18] | 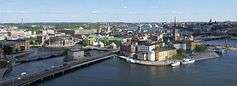 | |
| Turin | 886,837 | 31 December 2016 | [4] | 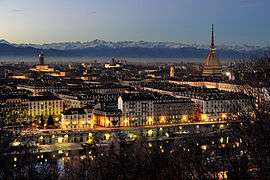 | |
| Marseille | 869,815 | 1 January 2015 | [5][19] |  | |
| Amsterdam | 859,732 | 31 May 2018 | [20] | .jpg) | |
| Zagreb | 803,647 | 31 December 2016 | [21] | .jpg) | |
| Valencia | 787,808 | 1 January 2017 | [3] |  | |
| Leeds | 781,743 | 30 June 2017 | [1] |  | |
| Kraków | 765,320 | 1 January 2017 | [10] |  | |
| Frankfurt | 736,414 | 31 December 2016 | [22] |  | |
| Riga | 700,518 | 1 July 2017 | [23] | 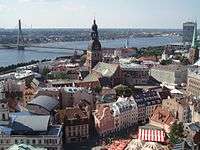 | |
| Łódź | 690,422 | 31 December 2017 | [10] | 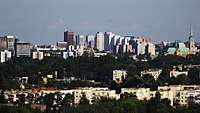 | |
| Seville | 689,434 | 1 January 2017 | [3] |  | |
| Palermo | 673,735 | 31 December 2016 | [4] |  | |
| Zaragoza | 664,938 | 1 January 2017 | [3] |  | |
| Athens | 655,780 | 24 May 2011 | [24] | 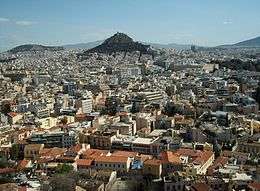 | |
| Helsinki | 642,045 | 31 August 2017 | [25] |  | |
| Wrocław | 638,586 | 31 December 2017 | [10] | 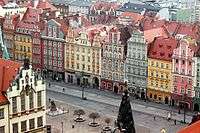 | |
| Rotterdam | 635,389 | August 2017 | [20] |  | |
| Stuttgart | 628,032 | 31 December 2016 | [26] | .jpg) | |
| Glasgow | 615,070 | 30 June 2017 | [1] |  | |
| Düsseldorf | 613,230 | 31 December 2016 | [16][27] |  | |
| Copenhagen | 602,481 | 31 December 2016 | [28] |  | |
| Dortmund | 585,813 | 31 December 2016 | [16][29] |  | |
| Genoa | 583,601 | 31 December 2016 | [4] | 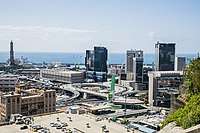 | |
| Essen | 583,084 | 31 December 2016 | [16][27] |  | |
| Vilnius | 577,484 | 3 March 2018 | [30] | 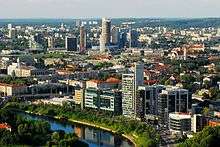 | |
| Sheffield | 575,424 | 30 June 2017 | [1] |  | |
| Leipzig | 571,088 | 31 December 2016 | [31] | 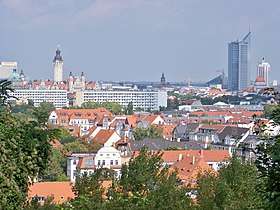 | |
| Málaga | 569,002 | 1 January 2017 | [3] |  | |
| Gothenburg | 563,439 | 1 November 2017 | [18] |  | |
| Bremen | 557,464 | 31 December 2015 | [32] |  | |
| Dublin | 553,165 | 24 April 2016 | [33] |  | |
| Lisbon | 547,733 | 1 January 2011 | [34] | .jpg) | |
| Dresden | 547,172 | 31 December 2016 | [31] | .jpg) | |
| Manchester | 541,263 | 30 June 2017 | [1] |  | |
| Poznań | 540,372 | 1 January 2017 | [10] |  | |
| Bradford | 534,279 | 30 June 2017 | [1] |  | |
| Hanover | 532,163 | 31 December 2015 | [35] |  | |
| The Hague | 532,111 | 31 January 2018 | [20] | .jpg) | |
| Antwerp | 521,946 | 14 June 2017 | [36] | 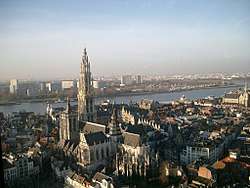 | |
| Lyon | 521,098 | 1 January 2015 | [5][37] |  | |
| Nuremberg | 511,628 | 31 December 2016 | [12] |  | |
| Edinburgh | 507,170 | 30 June 2017 | [1] | ||
| Duisburg | 499,845 | 31 December 2016 | [16][27] | ||
| Liverpool | 484,578 | 30 June 2017 | [1] |  | |
| Toulouse | 479,638 | 1 January 2015 | [5][38] |  | |
| Gdańsk | 463,754 | 1 January 2017 | [10] | 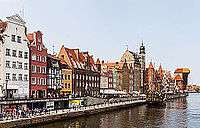 | |
| Bristol | 454,213 | 30 June 2017 | [1] |  | |
| Tallinn | 449,160 | 1 February 2018 | [39] |  | |
| Murcia | 443,243 | 1 January 2017 | [3] |  | |
| Bratislava | 429,564 | 31 December 2017 | [40] | 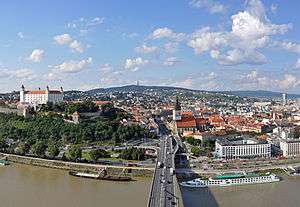 | |
| Palma de Mallorca | 406,492 | 1 January 2017 | [3] |  | |
| Szczecin | 404,878 | 1 January 2017 | [10] | 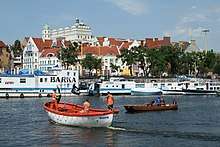 | |
| Bologna | 388,367 | 31 December 2016 | [4] |  | |
| Florence | 382,258 | 31 December 2016 | [4] |  | |
| Brno | 377,973 | 1 January 2017 | [14] | 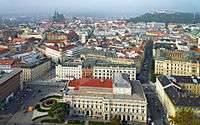 | |
| Las Palmas | 377,650 | 1 January 2017 | [3] | 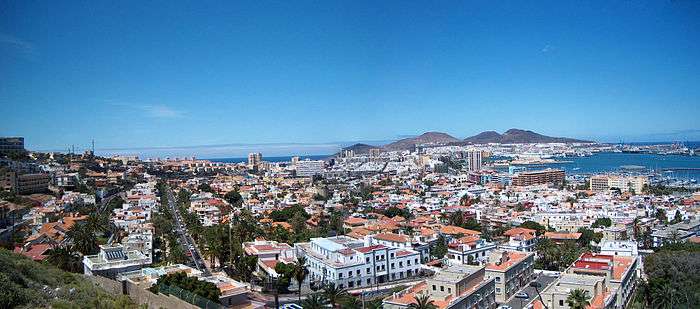 | |
| Bochum | 364,920 | 31 December 2016 | [16][29] |  | |
| Iași | 362,142 | 1 January 2016 | [7] |  | |
| Cardiff | 361,468 | 30 June 2017 | [1] | 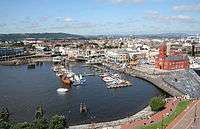 | |
| Bydgoszcz | 353,938 | 1 January 2017 | [10] | ||
| Coventry | 352,911 | 30 June 2017 | [1] | 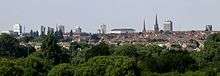 | |
| Wuppertal | 352,390 | 31 December 2016 | [16][27] | 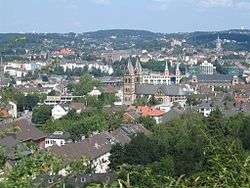 | |
| Leicester | 348,343 | 30 June 2017 | [1] |  | |
| Utrecht | 347,644 | 31 January 2018 | [20] | ||
| Nice | 346,055 | 1 January 2015 | [5][41] | 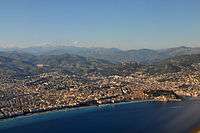 | |
| Bilbao | 345,141 | 1 January 2015 | [3] |  | |
| Plovdiv | 341,625 | 31 December 2015 | [13] |  | |
| Lublin | 340,466 | 1 January 2017 | [10] | ||
| Belfast | 339,579 | 30 June 2017 | [1] |  | |
| Wakefield | 336,834 | 30 June 2017 | [1] | 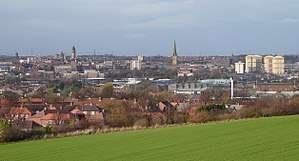 | |
| Aarhus | 335,684 | 31 December 2016 | [28] | 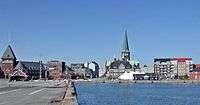 | |
| Varna | 334,466 | 31 December 2015 | [13] |  | |
| Bielefeld | 333,451 | 31 December 2016 | [16][42] | ||
| Timișoara | 352,983 | 1 January 2016 | [7] |  | |
| Malmö | 332,855 | 1 November 2017 | [18] |  | |
| Alicante | 329,988 | 1 January 2017 | [3] | 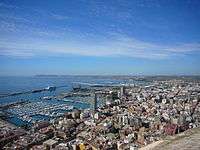 | |
| Córdoba | 325,916 | 1 January 2017 | [3] | 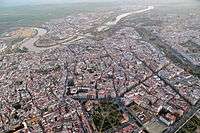 | |
| Nottingham | 325,282 | 30 June 2017 | [1] |  | |
| Bari | 324,198 | 31 December 2016 | [4] | ||
| Wigan | 323,060 | 30 June 2017 | [1] |  | |
| Thessaloniki | 322,240 | 24 May 2011 | [24] | 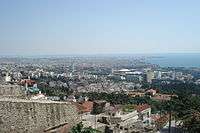 | |
| Bonn | 322,125 | 31 December 2016 | [16][17] |  | |
| Cluj-Napoca | 321,687 | 1 January 2016 | [7] |  | |
| Constanța | 317,832 | 1 January 2016 | [7] | .jpg) | |
| Catania | 313,396 | 31 December 2016 | [4] | 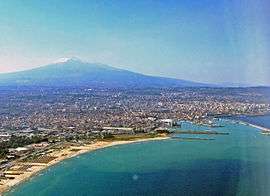 | |
| Münster | 311,846 | 31 December 2016 | [16][43] | _(3).jpg) | |
| Karlsruhe | 309,999 | 31 December 2016 | [26] |  | |
| Craiova | 305,689 | 1 January 2016 | [7] | _vedere_central%C4%83.JPG) | |
| Mannheim | 304,781 | 31 December 2016 | [26] |  | |
| Galați | 304,340 | 1 January 2016 | [7] |  |
See also
- List of urban areas in the European Union
- List of larger urban zones (metropolitan area)
Notes
- ↑ Currently there are two significant exceptions: London lists the population of Greater London; Brussels lists the population of Brussels Capital Region
- ↑ Refers to Greater London which is composed of the Greater London Authority, 32 borough councils and the City of London.
- ↑ Refers to Brussels Capital Region.
References
- 1 2 3 4 5 6 7 8 9 10 11 12 13 14 15 16 17 "Population Estimates for UK, England and Wales, Scotland and Northern Ireland". Office for National Statistics. 22 June 2017. Retrieved 2018-03-06.
- ↑ "Einwohner am Ort der Hauptwohnung am 31.12.2017" [Residents at the place of the main residence on 31 December 2017] (in German). Amt für Statistik Berlin-Brandenburg [Office of Statistics Berlin-Brandenburg]. Retrieved 2018-03-10.
- 1 2 3 4 5 6 7 8 9 10 11 12 "Official Population Figures referring to revision of Municipal Register 1 January". INEbase. Instituto Nacional de Estadística. [National Statistics Institute]. Retrieved 2018-02-02.
- 1 2 3 4 5 6 7 8 9 10 "Bilancio Demografico della Popolazione Residente per Mese – Dicembre 2016" (in Italian). Istat.it.
- 1 2 3 4 5 "Populations légales 2015 — Ces données sont disponibles sur toutes les communes de France" [Legal populations 2015 — This data is available for all the communes of France] (in French). INSEE. 2017-12-27. Retrieved 2018-02-28.
- ↑ "Populations légales 2015 — Commune de Paris (75056)" [Legal populations 2015 — Municipality of Paris (75056)] (in French). Institut national de la statistique et des études économiques. 2017-12-27. Retrieved 2018-03-01.
- 1 2 3 4 5 6 7 "Populația României pe localitate la 1 ianuarie 2016 (după domiciliu)" [Population of Romania by locality on 1 January 2016 (by residence)] (PDF) (in Romanian). Institutul Naţional de Statistică. 2016. Retrieved 19 January 2017.
- ↑ "Bevölkerung zu Quartalsbeginn seit 2002 nach Bundesland" [Population at the beginning of the quarter since 2002 by state (Vienna is a city-state)] (in German). Statistik Austria. Retrieved 2018-02-11.
- ↑ "Statistics Agency of Hamburg and Schleswig-Holstein". Retrieved 2016-08-10.
- 1 2 3 4 5 6 7 8 9 "Area and Population in the Territorial Profile in 2017" (.XLS). Statistics Poland. Główny Urząd Statystyczny [ Central Statistical Office ]. 19 July 2017. Retrieved 2018-03-10.
- ↑ "1.2. Population by type of settlement, 1 January (1980–)*". Tables (STADAT) – Time series of annual data – Population, vital events. Hungarian Central Statistical Office. 30 June 2017. Retrieved 2018-03-10.
- 1 2 "Bevölkerung: Gemeinden, Stichtage (letzten 6)" [Population: Municipalities, Dates (last 6)] (in German). Bayerisches Landesamt für Statistik. Retrieved 2018-03-11. (Need to [Display entire Table] to see data for all cities.)
- 1 2 3 "Population by towns and sex". National Statistical Institute of Bulgaria. 2015.
- 1 2 "Population of Municipalities - 1 January 2018". Czech Statistical Office. 30 April 2018. Retrieved 2018-04-30.
"Population of municipalities of the Czech republic, 1 January 2018" (PDF). Retrieved 2018-04-30. - ↑ "Structure of the Population". STATBEL. Belgian Federal Government. Retrieved 2018-02-10.
- 1 2 3 4 5 6 7 8 9 10 "Bevölkerungszahlen auf Basis des Zensus vom 9. Mai 2011" [Population figures based on the census of 9 May 2011]. IT.NRW (in German). Information und Technik Nordrhein-Westfalen. Retrieved 2013-10-02.
- 1 2 "Einwohnerzahlen im Regierungsbezirk Köln" [Population figures in the administrative district of Cologne]. IT.NRW (in German). Information und Technik Nordrhein-Westfalen. Retrieved 2018-03-10.
- 1 2 3 "Population 1 November by region, sex and year". scb.se. Statistics Sweden. Retrieved 2018-02-08. (Numbers vary depending on report selected.)
- ↑ "Populations légales 2015 — Commune de Marseille (13055)" [Legal populations 2015 — City of Marseille (13055)] (in French). Institut national de la statistique et des études économiques. 2017-12-27. Retrieved 2018-03-01.
- 1 2 3 4 "Bevolkingsontwikkeling; regio per maand" [Population development; region per month]. CBS StatLine (in Dutch). CBS.nl. 2018-01-31. Retrieved 2018-02-28.
- ↑ "Statistical Databases → Population → Population → Population estimates → Population estimate by sex, by towns/municipalities, 31 December (Spatial Units="CITY OF ZAGREB", Sex="All", Year="2016") [Continue]". Croatian Bureau of Statistics. Retrieved 2018-03-10.
- ↑ "Bevölkerung in Hessen nach Gemeinden am 31.12.2016" [Population in Hessen by municipalities on 31.12.2016] (.xlsx). Statistik.Hessen (in German). Retrieved 2018-02-09.
- ↑ "Iedzīvotāju skaits pašvaldībās pa dzimumiem" [Population in municipalities by gender] (PDF). Pilsonības un migrācijas lietu pārvalde (in Latvian). Retrieved 2018-02-10.
- 1 2 "Ανακοίνωση προσωρινών αποτελεσμάτων Απογραφής Πληθυσμού 2011" [Publication of provisional results of the 2011 Population Census] (PDF) (in Greek). National Statistical Service of Greece. 22 July 2011.
"Publication of provisional results of the 2011 Population Census" (PDF) (Press release). Hellenic Statistical Authority. 22 July 2011. Archived from the original (PDF) on 13 November 2011. Retrieved 2013-02-19. - ↑ "Ennakkoväkiluku sukupuolen mukaan alueittain, elokuu 2017" [Prior Population by gender and by region, August 2017]. Tilastokeskuksen PX-Web-tietokannat [Finland's Statistics PX-Web databases] (in Finnish). Retrieved 2017-10-19.
- 1 2 3 "CSV-Datei (Semikolon-getrennt) für alle Gemeinden: Gemeindegebiet, Bevölkerung und Bevölkerungsdichte" [CSV file (semicolon-separated) for all municipalities: municipal area, population and population density] (.csv) (in German). Statistisches Landesamt Baden‑Württemberg [Statistical Agency Baden-Wuerttemberg]. Retrieved 2018-02-09.
- 1 2 3 4 "Einwohnerzahlen im Regierungsbezirk Düsseldorf" [Population figures in the administrative district of Dusseldorf]. IT.NRW (in German). Information und Technik Nordrhein-Westfalen. Retrieved 2018-03-10.
- 1 2 "BEV107: Befolkningens udvikling efter kommune, bevægelsesart og køn | Befolkningen ultimo forrige år | 2017" [BEV107: Population development by municipality, type of movement and gender | Population at the end of last year | 2017] (in Danish). Danmarks Statistik [ Statistics Denmark ]. Retrieved 2018-02-10.
- 1 2 "Einwohnerzahlen im Regierungsbezirk Arnsberg" [Population figures in the administrative district of Arnsberg]. IT.NRW (in German). Information und Technik Nordrhein-Westfalen. Retrieved 2018-03-10.
- ↑ "Šiuolaikinė Lietuva (1991–dabar) | Nuolatinių gyventojų skaičius liepos 1 d." [Contemporary Lithuania 1991-present | Permanent population as of July 1] (in Lithuanian). 2017-07-25. Retrieved 2018-03-03.
- 1 2 "Bevölkerung des Freistaates Sachsen jeweils am Monatsende ausgewählter Berichtsmonate nach Gemeinden" [Population of the Free State of Saxony at the end of selected reporting months by municipality] (PDF) (in German). Statistisches Landesamt des Freistaates Sachsen [Statistical Agency of the Free State of Saxony]. Retrieved 2018-02-09.
- ↑ "Bevölkerungsstand und Bevölkerungsbewegung" [Population and population movement] (in German). Statistisches Landesamt Bremen [Statistical Office Bremen]. Retrieved 2016-08-10.
- ↑ "Population and Actual and Percentage Change 2011 to 2016 by Sex, Province County or City, CensusYear and Statistic". Central Statistics Office (Ireland). Retrieved 2016-09-07.
- ↑ "Place of residence (at the date of Census 2011)". Instituto Nadional de Estatistica [ Statistics Portugal ]. Retrieved 2018-02-10.
- ↑ "die kostenfreie Regionaldatenbank für Niedersachsen" [the free regional database for Lower Saxony]. LSN-Online (in German). Landesamt für Statistik Niedersachsen [State Statistical Office of Lower Saxony]. Retrieved 2015-09-22.
- ↑ "Hoofdstuk 2 Bevolking en socio-economische situatie" [Chapter 2 Population and socio-economic situation] (PDF). Gezondheidsmonitor stad Antwerpen 2017 [Health monitor city of Antwerp 2017]. Stad in cijfers (in Dutch). Stad Antwerpen. 14 June 2017. Retrieved 2018-02-10.
- ↑ "Populations légales 2015 — Commune de Lyon (69123)" [Legal populations 2015 — City of Lyon (69123)] (in French). Institut national de la statistique et des études économiques. 2017-12-27. Retrieved 2018-03-01.
- ↑ "Populations légales 2015 — Commune de Toulouse (31555)" [Legal populations 2015 — City of Toulouse (31555)] (in French). Institut national de la statistique et des études économiques. 2017-12-27. Retrieved 2018-03-01.
- ↑ "Tallinna elanike arv 1. veebruari (2018) seisuga on 449 160" [The number of Tallinn residents as of 1 February (2018) is 449,160] (in Estonian). Tallinn City Government. Retrieved 2018-02-11.
- ↑ "Štatistika v Súvislostiach — Hlavné trendy populačného vývoja v Bratislave, hl. meste SR, v roku 2015" [Statistics in the Background - Major Trends in Population Development in Bratislava, town of SR, in 2015] (in Slovak). Štatistický úrad Slovenskej republiky [Statistical office of the Slovak Republic]. October 2016. ISBN 978-80-8121-523-0. Retrieved 2018-02-11.
- ↑ "Populations légales 2015 — Commune de Nice (06088)" [Legal populations 2015 — City of Nice (06088)] (in French). Institut national de la statistique et des études économiques. 2017-12-27. Retrieved 2018-03-01.
- ↑ "Einwohnerzahlen im Regierungsbezirk Detmold" [Population figures in the administrative district Detmold]. IT.NRW (in German). Information und Technik Nordrhein-Westfalen. Retrieved 2018-03-10.
- ↑ "Einwohnerzahlen im Regierungsbezirk Münster" [Population figures in the administrative district of Münster]. IT.NRW (in German). Information und Technik Nordrhein-Westfalen. Retrieved 2018-03-10.