List of cities in the Far East by population
For the purposes of this article, Far East shall represent,
|
East Asia South Asia
|
Southeast Asia
|
Largest Megalopolis areas
| Rank | Metropolitan area | Country | Population |
|---|---|---|---|
| 1 | Southern China Coast Megalopolis (Pearl River Delta -Chaoshan-Xiamen-Quanzhou-Fuzhou | China | 200,000,000 |
| 2 | Yangtze River Delta | China | 100,000,000 |
| 3 | Taiheiyō Belt | Japan | 84,000,000 |
| 4 | (Bengal Megalopolis) Kolkata-Khulna-Dhaka-Chittagong | India, Bangladesh | 60,000,000 |
| 5 | Beijing–Tianjin (Hebei's cities cluster) | China | 39,710,000 |
| 6 | Mega Manila | Philippines | 35,000,000 |
| 7 | Incheon–Seoul–Daejon–Daegu–Busan | South Korea | 32,890,000 |
| 8 | Mumbai-Pune-Nashik | India | 30,000,000 |
| 9 | Jabodetabek (Greater Jakarta) | Indonesia | 28,000,000 |
| 10 | Delhi-Gurgaon-Noida-Ghaziabad | India | 26,000,000 |
| 11 | Karachi-Hyderabad | Pakistan | 25,000,000 |
| 12 | Greater Bangkok–Chon Buri-Nakhon Ratchasima | Thailand | 20,000,000 |
| 13 | (West coast of Taiwan) Taipei-Taichung-Kaohsiung | Taiwan | 18,000,000 |
Largest metropolitan areas
| Rank | Metropolitan area | Country | Population | Area (km²) | Population Density (People/km²) |
|---|---|---|---|---|---|
| 1 | Tokyo | Japan | 32,450,000 | 8,014 | 4,049 |
| 2 | Seoul | South Korea | 20,550,000 | 5,076 | 4,048 |
| 3 | Mumbai (Bombay) | India | 20,900,000 | 8,100 | 2,580 |
| 4 | Jakarta | Indonesia | 18,900,000 | 5,100 | 3,706 |
| 5 | Shanghai | China | 16,650,000 | 5,177 | 3,216 |
| 6 | Hong Kong-Shenzhen[1] | China | 15,800,000 | 3,051 | 5,179 |
| 7 | Beijing | China | 12,500,000 | 6,562 | 1,905 |
Largest urban areas ranked by 2010 projected population
| Rank | City | Country | Population | Area (km²) | Density (km²) | Sources of
Pop. / Area |
Image |
|---|---|---|---|---|---|---|---|
| 1 | Tokyo–Yokohama[2] | Japan | 35,200,000 | 7,835 | 4,100 | C / B |   |
| 2 | Jakarta[3] | Indonesia | 22,000,000 | 2,720 | 8,500 | F / B |  |
| 3 | Manila[4] | Philippines | 20,795,000 | 1,425 | 14,600 | C / B | _(Manila)(2018-05-12).jpg) |
| 4 | Seoul–Incheon[5] | South Korea | 19,910,000 | 1,943 | 10,200 | C / B |   |
| 5 | Shanghai | China | 18,400,000 | 2,396 | 6,300 | C / B |  |
| 6 | Osaka–Kobe–Kyoto[6] | Japan | 17,320,000 | 2,720 | 5,300 | C / B | 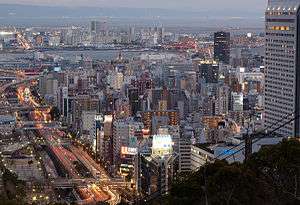  |
| 7 | Shenzhen[7] | China | 14,470,000 | 1,295 | 10,200 | F / B | 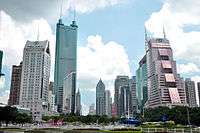 |
| 8 | Beijing | China | 13,955,000 | 2,616 | 4,200 | C / B | 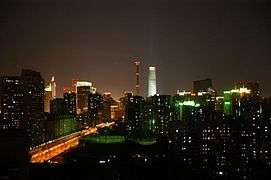 |
| 9 | Guangzhou–Foshan[7] | China | 13,245,000 | 2,590 | 6,700 | E / B | 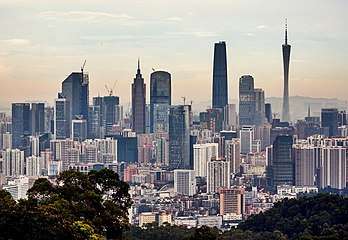  |
| 10 | Dongguan[7] | China | 10,525,00 | 1,295 | 7,600 | F / B | _2010.jpg) |
| 11 | Nagoya[8] | Japan | 10,025,000 | 3,302 | C / B | 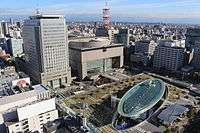 | |
| 12 | Bangkok | Thailand | 8,250,000 | 1,502 | 2,500 | C / B | 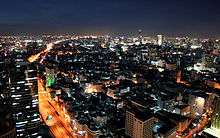 |
| 13 | Sài Gòn | Vietnam | 7,785,000 | 609 | 9,200 | E / B | 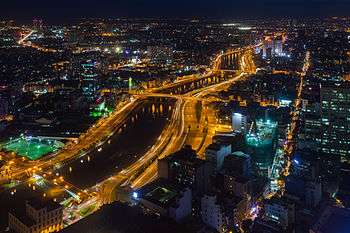 |
| 14 | Hong Kong[7] | China | 7,055,000 | 220 | 25,200 | E / B | |
| 15 | Taipei-New Taipei-Keelung | Taiwan | 6,800,000 | 440 | 10,100 | D / B |  |
| 16 | Tianjin[9] | China | 6,675,000 | 1,295 | 5,200 | C / B | 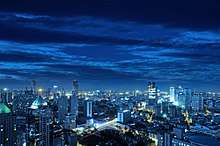 |
| 17 | Kuala Lumpur[10] | Malaysia | 5,835,000 | 2,137 | 2,700 | E / B | |
| 18 | Chongqing[11] | China | 5,460,000 | 570 | 7,500 | E / B | |
| 19 | Hangzhou[12] | China | 5,305,000 | 712 | 8,200 | E / B |  |
| 20 | Wuhan | China | 5,260,000 | 712 | 7,400 | E / B | 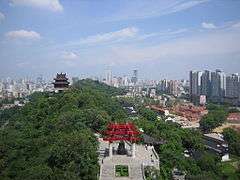 |
| 21 | Shenyang[13] | China | 5,160,000 | 777 | 7,100 | E / B |  |
| 22 | Chengdu | China | 4,785,000 | 570 | 8,400 | E / B | |
| 23 | Singapore[14] | Singapore | 4,635,000 | 479 | 9,700 | D / B | 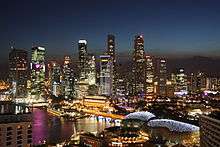 |
| 24 | Yangon (Rangoon) | Myanmar | 4,400,000 | 350 | 12,600 | D / B | 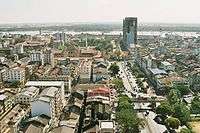 |
| 25 | Xi'an | China | 3,955,000 | 531 | 7,400 | E / B |  |
| 26 | Harbin[15] | China | 3,615,000 | 570 | 5,900 | E / B |  |
| 27 | Suzhou[12] | China | 3,605,000 | 635 | 5,700 | E / B |  |
| 28 | Bandung | Indonesia | 3,555,000 | 401 | 8,400 | E / B | .jpg) |
| 29 | Nanjing[12] | China | 3,550,000 | 686 | 4,200 | E / B | 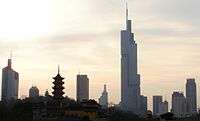 |
| 30 | Busan | South Korea | 3,395,000 | 259 | 13,100 | E / B |  |
| 31 | Pyongyang | North Korea | 3,370,000 | 207 | 16,300 | E / B |  |
| 32 | Dalian | China | 3,255,000 | 570 | 4,700 | E / B | 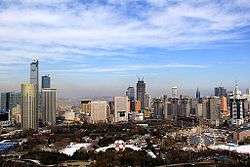 |
| 33 | Changchun | China | 3,170,000 | 376 | 8,400 | E / B |  |
| 34 | Kunming | China | 3,070,000 | 518 | 9,100 | E / B |  |
| 35 | Wuxi[12] | China | 2,925,000 | 389 | 7,500 | E / B | 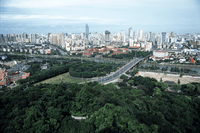 |
| 36 | Taiyuan | China | 2,900,000 | 311 | 9,300 | E / B |  |
| 37 | Surabaya | Indonesia | 2,885,000 | 376 | 7,700 | D / B |  |
| 38 | Taichung-Changhua | Taiwan | 2,815,000 | 492 | 5,700 | E / B |  |
| 39 | Changsha | China | 2,720,000 | 389 | 6,600 | E / B |  |
| 40 | Kaohsiung | Taiwan | 2,670,000 | 363 | 7,400 | E / B | |
| 41 | Zhengzhou | China | 2,590,000 | 466 | 5,600 | E / B |  |
| 42 | Fukuoka[16] | Japan | 2,550,000 | 583 | 4,900 | C / B |  |
| 43 | Shijiazhuang | China | 2,530,000 | 363 | 7,000 | E / B |  |
| 45 | Qingdao | China | 2,495,000 | 440 | 5,700 | E / B | 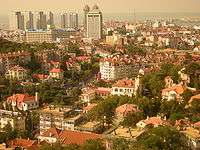 |
| 46 | Sapporo | Japan | 2,475,000 | 648 | 4,000 | C / B |  |
| 47 | Nanchang | China | 2,465,000 | 155 | 5,300 | E / B |  |
| 48 | Guiyang | China | 2,440,000 | 207 | 11,800 | E / B |  |
| 49 | George Town | Malaysia | 2,412,616 | 2,563 | 941 | A / A |  |
| 50 | Fuzhou | China | 2,405,000 | 259 | 9,300 | E / B | .jpg) |
| 51 | Lanzhou | China | 2,385,000 | 181 | 13,200 | E / B |  |
| 52 | Daegu | South Korea | 2,380,000 | 181 | 13,100 | E / B |  |
| 53 | Hanoi | Vietnam | 2,355,000 | 194 | 8,300 | E / B |  |
| 54 | Medan | Indonesia | 2,340,000 | 246 | 9,500 | E / B |  |
| 55 | Jinan | China | 2,320,000 | 350 | 6,600 | E / B | |
| 56 | Changzhou[12] | China | 2,275,000 | 194 | 11,700 | E / B |  |
| 57 | Xiamen | China | 2,225,000 | 295 | 7,500 | E / B | |
| 58 | Shunde[7] | China | 2,105,000 | 401 | 5,200 | E / B |  |
| 59 | Baotou | China | 2,095,000 | 363 | 5,800 | E / B |  |
| 60 | Jilin | China | 2,070,000 | 233 | 8,900 | E / B |  |
| 61 | Hefei | China | 2,000,000 | 350 | 5,700 | E / B |  |
| 62 | Kitakyūshū[17] | Japan | 2,000,000 | 842 | 2,400 | C / B |  |
- Sources
- A: National census authority data.
- B: Demographia land area estimate based upon map or satellite photograph analysis.
- C: Demographia population "build up" from third, fourth or fifth order jurisdictions (NUTS-3, NUTS-4, NUTS-5 or equivalent).
- D: Population estimate based upon United Nations agglomeration estimate.
- E: Demographia population estimate from national census authority agglomeration data.
- F: Other Demographia population estimate.
- G: Estimate based upon projected growth rate from last census.
- H: Combination of adjacent national census authority agglomerations.
Largest urban agglomerations by population
| Rank | City | Population | Country | Statistical concept | Area (km²)[18] |
|---|---|---|---|---|---|
| 1 | Tokyo | 36,669,000 | Japan | Major Metropolitan Area (M.M.A.), as defined by the Statistics Bureau of Japan | 13,500 |
| 2 | Shanghai | 16,575,000 | China | Urban agglomeration[19] | 3,920 |
| 3 | Beijing | 12,385,000 | China | Urban agglomeration[19][20] | 7,860 |
| 4 | Manila | 11,628,000 | Philippines | Urban agglomeration[21] | 640 |
| 5 | Osaka–Kobe | 11,337,000 | Japan | Urban agglomeration[22] | 1,220 |
| 6 | Seoul | 9,773,000 | South Korea | City proper (metropolitan city) | 610 |
| 7 | Chongqing | 9,401,000 | China | Urban agglomeration[19][23] | 7,490 |
| 8 | Jakarta (Jabodetabek) | 9,210,000 | Indonesia | Metropolitan area[24] | 1,360 |
| 9 | Shenzhen | 9,005,000 | China | Urban agglomeration[19] | 1,950 |
| 10 | Guangzhou | 8,884,000 | China | Urban agglomeration[19] | 7,260 |
| 11 | Tianjin | 7,884,000 | China | Urban agglomeration[19][25] | 7,130 |
| 12 | Wuhan | 7,681,000 | China | Urban agglomeration[19] | 8,490 |
| 13 | Hong Kong | 7,069,000 | China | Urban agglomeration[26] | 1,100 |
| 14 | Bangkok | 6,976,000 | Thailand | Official metropolitan area | 1,570 |
| 15 | Ho Chi Minh City | 6,167,000 | Vietnam | Urban agglomeration | 2,090 |
| 16 | Dongguan | 5,347,000 | China | City proper[19] | 2,460 |
| 17 | Shenyang | 5,166,000 | China | City proper[19] | 3,460 |
| 18 | Foshan | 4,969,000 | China | Urban agglomeration[19][27] | 3,813 |
| 19 | Chengdu | 4,961,000 | China | Urban agglomeration[19][28] | 2,130 |
| 20 | Singapore | 4,837,000 | Singapore | Urban agglomeration | 690 |
| 21 | Xi'an | 4,747,000 | China | Urban agglomeration[19][29] | 3,550 |
| 22 | Nanjing | 4,591,000 | China | Urban agglomeration[19][30] | 6,600 |
| 23 | Yangon | 4,350,000 | Myanmar | Urban agglomeration | 350 |
| 24 | Harbin | 4,251,000 | China | Urban agglomeration[19][31] | 4,280 |
| 25 | Hangzhou | 3,860,000 | China | Urban agglomeration[19][32] | 3,068 |
| 26 | Changchun | 3,597,000 | China | Urban agglomeration[19] | 3,616 |
| 27 | Shantou | 3,502,000 | China | Urban agglomeration[19][33] | 1,956 |
| 28 | Busan | 3,500,992 | South Korea | City proper (metropolitan city) | 760 |
Largest cities proper by population
| Rank | City | Population | Definition | Area (km²) | Population density (/km²) | Country |
|---|---|---|---|---|---|---|
| 1 | Shanghai | 13,831,900[34] | Core districts + inner suburbs | 1,928 | 7,174 | China |
| 2 | Seoul | 10,456,034[35] | Special City | 605.4 | 17,271 | South Korea |
| 3 | Beijing | 10,123,000[36] | Core districts + inner suburbs | 1,368.32 | 7,400 | China |
| 4 | Tokyo | 8,795,000[37] | 23 special wards area | 617 | 14,254 | Japan |
| 5 | Jakarta | 8,489,910[38] | Special capital district | 664 | 12,738 | Indonesia |
| 6 | Wuhan | 8,001,541[39] (2006-12-31) | Core districts | 400 | 20,004 | China |
| 7 | Ho Chi Minh City | 7,123,340[40] | Province-level municipality | 2,095.01 | 3,401 | Vietnam |
| 8 | Bangkok | 7,025,000[41] | Administrative area | 1,568.74 | 4,478 | Thailand |
| 9 | Hong Kong | 7,008,900[42] | The entire territory | 1,092 | 6,418 | China |
| 10 | Guangzhou | 6,172,839[39] (2006-12-31) | Core districts | China | ||
| 11 | Tianjin | 5,800,000[43] | Core districts + inner suburbs | 2,057 | 2,820 | China |
| 12 | Singapore | 4,839,400[44] | Country | 701 | 6,904 | Singapore |
| 13 | Chongqing | 4,776,027[39] | Core districts | 5,467.2 | 1,057 | China |
| 14 | Shenyang | 4,101,197[39] (2006-12-31) | Core districts | 3,495 | 1,173 | China |
| 15 | Yangon | 4,088,000[45] | Urban agglomeration | 598.75[46] | 6,828 | Myanmar |
| 16 | Yokohama | 3,670,000[47] | City proper | 437 | 8,398 | Japan |
| 17 | Busan | 3,596,076[35] | Metropolitan City | 765.66 | 4,697 | South Korea |
| 18 | Pyongyang | 3,255,388[48] | Directly Governed City | 3,194 | 1,019 | North Korea |
See also
- Administrative divisions of the People's Republic of China
- List of cities in the People's Republic of China by population
- List of cities in the People's Republic of China by GDP per capita
- List of metropolitan areas in Taiwan
- List of Taiwanese counties and cities by population
- List of metropolitan areas by population
- Cities of South Korea
- Cities of North Korea
- List of Japanese cities by population
Notes and references
- ↑ There are restrictions on the movement of labor between Hong Kong and Mainland China and the two areas are usually listed separately in other lists.
- ↑ Includes large portions of the prefectures of Tokyo, Kanagawa, Chiba and Saitama; and small portions of Gunma, Tochigi and Ibaraki. Excludes urban areas of Utsunomiya (500,000; 88 km²) and Mito (500,000; 246 km²).
- ↑ Various international sources limit their population estimates to DKI Jakarta itself (the national capital district). However, the urbanization of Jakarta extends into the regencies of Tangerang, Bekasi, Bogor and Karawang and the separate cities of Bekasi, Depok and Bogor. Demographia continues to use the "Jakarta" name instead of Jabodetabek because of its familiarity.
- ↑ The population is higher than other agglomeration estimates (such as the United Nations), tend to be limited to Metro Manila, which is a province level jurisdiction. The continuous urbanization of Manila extends outward into Bulacan, Cavite, Laguna, Rizal and Quezon provinces. The Demographia population estimate is a "build-up" of municipality population within the continuously developed area (urban area or agglomeration).
- ↑ Includes satellite cities in Gyeonggi Province such as Suwon, Goyang, Seongnam, Bucheon and Ansan which are treated as separate urban agglomerations by the United Nations.
- ↑ Includes Nara and Himeji. United Nations estimates separate Osaka–Kobe and Kyoto and exclude both Nara and Himeji. Excludes urban area of Ōtsu (700,000; 389 km²).
- 1 2 3 4 5 Hong Kong and Shenzhen are treated as separate urban areas because of the lack of freedom of labor movement without trade, immigration or customs barriers. Guangzhou–Foshan, Shenzhen and Dongguan are also treated as separate urban areas which constitute the Pearl River Delta economic zone. Likewise, urban areas of Jiangmen–Xinhui (600,000; 130 km²) and Taishan (350,000; 21 km²) within the prefecture-level city of Jiangmen, Huizhou–Huiyang (500,000; 93 km²) within the prefecture-level city of Huiyang, Zhuhai (530,000; 117 km²), Zhongshan (410,000; 130 km²) and Zhaoqing (310,000; 41 km²) as well as urban area of Macau (525,000; 23 km²) in are excluded. Population estimates for Shenzhen and Dongguan are based upon press reports, since the national census excludes millions of residents who do not have permanent resident status.
- ↑ Includes Toyohashi.
- ↑ The population is lower than other estimates (such as the United Nations), which include metropolitan area population not within the continuously developed urban area. The Demographia population estimate is a "build-up" of sub-municipality population within the continuously developed area (urban area or agglomeration). Excludes urban area of Tangshan (900,000; 168 km²).
- ↑ The population is higher than other agglomeration estimates (such as the United Nations), which does not include all of the continuously developed urban area. Continuous urbanization extends well beyond the municipality of Kuala Lumpur, for example to Port Klang and the area represents a single labor market (metropolitan area). The Demographia population estimate is a "build-up" of municipality population within the continuously developed area (urban area or agglomeration).
- ↑ Excludes urban area of Wanzhou (200,000; 16 km²) within the municipality of Chongqing. The direct-controlled municipality of Chongqing, which is sometimes translated as the direct-controlled city of Chongqing, has the largest population of any organism called a city in the stretches far beyond any reasonable definition of a metropolitan area and has a land area similar to that of Austria.
- 1 2 3 4 5 Shanghai, Hangzhou, Suzhou, Nanjing, Wuxi and Changzhou are treated as separate urban areas which constitute the Yangtze River Delta economic zone. Urban areas of Ningbo (1,920,000; 570 km2), Cixi City (915,000; 259 km2) and Yuyao (370,000; 111 km2) within the prefecture-level city of Ningbo, Shaoxing (795,000; 254 km2) and Zhuji (400,000; 85 km2) within the prefecture-level city of Shaoxing, Jiaxing (750,000; 130 km2) and Tongxiang (510,000; 52 km2)within the prefecture-level city of Jiaxing, Kunshan (580,000; 401 km2) and Taicang (350,000; 91 km2) within the prefectrual level city of Suzhou, Wenling (510,000; 52 km2), Jiaojiang (375,000; 41 km2), Taizhou (300,000; 39 km2) and Huangyan (200,000; 34 km2) within the prefectrure-level city of Taizhou, Fuyang (370,000; 49 km2) within the prefecture-level city of Hangzhou, Nantong (735,000; 85 km2), Yangzhou (725,000; 49 km2), Huzhou (690,000; 111 km) and Zhenjiang (510,000; 36 km2) are also excluded.
- ↑ Excludes urban area of Fushun (625,000; 104 km²).
- ↑ Excludes urban area of Johor Bahru (860,000; 583 km²) in Malaysia.
- ↑ Excludes urban areas of Acheng (300,000; 39 km²) and Shangzhi (250,000; 16 km²) within the sub-provincial city of Harbin.
- ↑ Excludes urban area of Kitakyūshū (1,800,000; 1,166 km²). Some sources combine Fukuoka with Kitakyūshū (such as the United Nations), which is not a part of the continuous urbanization of Fukuoka. The Demographia population estimate is a "build-up" of municipality population within the continuously developed area (urban area or agglomeration).
- ↑ Fukuoka and Kitakyūshū are treated as separate urban areas. Some sources combine Fukuoka with Kitakyūshū (such as the United Nations), which is not a part of the continuous urbanization of Fukuoka. The Demographia population estimate is a "build-up" of municipality population within the continuously developed area (urban area or agglomeration).
- ↑ The area figures are taken from individual national censuses according to the criteria and statistical concepts noted in the World Urbanization Prospects.
- 1 2 3 4 5 6 7 8 9 10 11 12 13 14 15 16 17 The population of the city is composed of population in all City Districts meeting the criteria such as "contiguous built-up area," being the location of the local government, being a Street or Having a Resident Committee.
- ↑ Data include urban population in Daxing, Pinggu, and Huairou Districts.
- ↑ Data refers to Metro Manila
- ↑ The Statistics Bureau of Japan has provided the list of cities, towns and villages included in the urban agglomerations associated with the city of Osaka-Kobe for each census year from 1960 to 1990. The agglomeration of Osaka consisted of the densely inhabited districts of Osaka, 35 cities surrounding Osaka, Kobe and six cities surrounding Kobe.
- ↑ Data include urban population in Jiangjin, Hechuan, Nanchuan, and Yongchuan Districts.
- ↑ Data refer to the functional urban area, that is, contiguous areas which are consistently urban in character as indicated by levels of population density, economic functions and facilities.
- ↑ Data include urban population in Baodi District
- ↑ Data for Hong Kong consist of the population of Hong Kong Island, New Kowloon, the new towns in New Territories, and the marine areas.
- ↑ Data include urban population in Nanhai, Shunde, Shanshui, and Gaoming Districts.
- ↑ Data include urban population in Xindu and Wenjiang Districts
- ↑ Data include urban population in Chang'an District
- ↑ Data include urban population in Jiangning and Liuhe Districts
- ↑ Data include urban population in Hulan and Acheng Districts
- ↑ Data include urban population in Xiaoshan and Yuhang Districts
- ↑ Data include urban population in Chenghai, Chaonan, and Chaoyang Districts
- ↑ Shanghai Municipal Bureau of Statistics, Shanghai Statistical Yearbook 2009, Total of permanent population (including "floating population"). Retrieved on 2009-07-17. Total population as of 2008-12-31 of the following districts (core city + inner suburbs): Pudong New Area, Huangpu, Luwan, Xuhui, Changning, Jing'an, Putuo, Zhabei, Hongkou, Yangpu, Baoshan, Minhang, and Jiading.
- 1 2 Thomas Brinkhoff, www.citypopulation.de; South Korea, The registered population of the South Korean provinces and urban municipalities Registered population 2008-12-31. Retrieved on 2009-08-05.
- ↑ Beijing Municipal Bureau of Statistics, Beijing Statistical Yearbook 2008, Total number of permanent population (including "floating population") Archived 2009-07-04 at the Wayback Machine. Retrieved on 2009-03-14. Total population on 2007-12-31(1% sample census) of the two functional areas of 1) Core Districts of Capital Function and 2) Urban Function Extended Districts, including eight fully urban districts. The data is for so-called 'permanent population'; registered population was 7,323,000 the same year.
- ↑ Statistics Bureau, Japan, Monthly Statistics, Population of Major Cities (excel-file) Archived 2013-02-08 at the Wayback Machine. Retrieved on 2009-08-05. Population estimate on 2009-06-01.
- ↑ Penduduk Provinsi DKI Jakarta: Penduduk Provinsi DKI Jakarta Januari 2008 (Demographics and Civil Records Service: Population of the Province of Jakarta January 2008) Archived 2012-04-08 at the Wayback Machine. Retrieved on 2008-10-25.
- 1 2 3 4 City and region database of Statistics Finland
- ↑ http://www.chinhphu.vn/portal/page?_pageid=439,1090462&_dad=portal&_schema=PORTAL&pers_id=1091147&item_id=33638381&p_details=1
- ↑ National Statistical Office Thailand, Key Statistics of Thailand 2007; Chapter 1.9, Population Projections (1 July) by Region and Sex (embedded in huge 121MB zipped file!) Retrieved on 2009-08-05. Projected de facto population as of 2009. The registered (de jure) population was 5,695,956 in 2006.
- ↑ Census and Statistics Department, Hong Kong; Population and Vital Events Archived 2008-05-19 at the Wayback Machine. Retrieved on 2009-08-05. Estimated population on 2008-12-31. Including 'usual' and 'mobile' residents, but excluding temporary visitors.
- ↑ Tianjin Statistical Information Net Archived 2008-09-25 at the Wayback Machine.. Retrieved on 2009-01-29. Total population as of 2005-11-01 of the following districts (core city + inner suburbs): Heping, Hedong, Hexi, Nankai, Hebei, Hongqiao, Dongli, Xiqing, Jinnan, and Beichen. Excludes the separate urban area of Binhai.
- ↑ Statistics Singapore, Population (Mid-Year Estimates) Archived 2008-11-18 at the Wayback Machine. Retrieved on 2008-10-03. Estimated population on 2008-06-30, including Singapore residents plus non-residents. Population of Singapore citizens and residents was 3,642,700 on 2008-06-30.
- ↑ United Nations World Urbanization Prospects, 2007 revision Archived 2009-06-18 at the Wayback Machine.
- ↑ Third Regional EST Forum, Presentation of Myanmar. Retrieved 6 June 2009
- ↑ Statistics Bureau, Japan, Monthly Statistics, Population of Major Cities (excel-file) Archived 2013-02-08 at the Wayback Machine. Retrieved on 2009-08-05. Population estimate on 2009-07-01.
- ↑ United Nations Statistics Division; Preliminary results of the 2008 Census of Population of the Democratic People’s Republic of Korea conducted on 1-15 October 2008 (pdf-file) Archived 25 March 2009 at the Wayback Machine. Retrieved on 2009-03-01.
This article is issued from
Wikipedia.
The text is licensed under Creative Commons - Attribution - Sharealike.
Additional terms may apply for the media files.