Wrexham (UK Parliament constituency)
| Wrexham | |
|---|---|
|
County constituency for the House of Commons | |
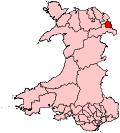 Boundary of Wrexham in Wales. | |
| Preserved county | Clwyd |
| Electorate | 53,733 (December 2010)[1] |
| Major settlements | Wrexham, Gwersyllt, Llay, Gresford |
| Current constituency | |
| Created | 1918 |
| Member of parliament | Ian Lucas (Labour) |
| Number of members | One |
| Created from | Denbigh Boroughs and East Denbighshire |
| Overlaps | |
| Welsh Assembly | North Wales |
| European Parliament constituency | Wales |
Wrexham (Welsh: Wrecsam) is a parliamentary constituency centred on the scenic town of Wrexham in Wales created in 1918 represented in the House of Commons of the UK Parliament since 2001 by Ian Lucas of the Labour Party.[n 1][n 2]
History
- Summary of results
The candidate chosen by the Labour Party has won the seat since 1935. In its earlier years the seat alternated between Liberal and Labour parties. The 2015 result gave the seat the 25th-smallest majority of Labour's 232 seats by percentage of majority.[2]
- Recent opposition
Atkinson, the Conservative candidate of 2015, came within 5.6% of taking the seat; his earlier counterparts had not taken the runner-up position since 2001. Walsh, a new Liberal Democrat candidate, lost his party 20.5% of the vote comparing the previous result whereas the Liberal Democrats' swing nationally was -15.2%. Candidates rendering Walsh into fifth place were those of UKIP and Plaid Cymru. All four candidates kept their deposits. In 2017 the aggregate for the two main parties increased but the majority remained largely the same. It still remains a Conservative target seat for future elections.
- Turnout
Turnout has ranged between 59.5% in 2001 and 87.3% in 1950.
Boundaries
Until 1885, Wrexham was part of the Denbighshire parliamentary constituency, which elected one Member of Parliament until the Reform Act 1832 increased this to two members. In 1885 the Denbighshire constituency was split — the area covered today became part of East Denbighshire constituency.
In 1918 the Wrexham constituency was created, electing one Member of Parliament. For the 1983 general election, major boundary reorganisation saw large areas removed from the Wrexham constituency to form the new constituency of Clwyd South West (later to become Clwyd South).
Wrexham constituency consists of the following electoral wards: Acton, Borras Park, Brynyffynnon, Cartrefle, Erddig, Garden Village, Gresford East and West, Grosvenor, Gwersyllt East and South, Gwersyllt North, Gwersyllt West, Hermitage, Holt, Little Acton, Llay, Maesydre, Marford and Hoseley, Offa, Queensway, Rhosnesni, Rossett, Smithfield, Stansty, Whitegate, Wynnstay.
1918-1949: The Municipal Borough of Wrexham, and the Rural District of Wrexham, and part of Chirk.
1950-1983: The Municipal Borough of Wrexham, and part of the Rural Districts of Ceiriog, and Wrexham.[3]
Members of Parliament
Elections
Elections in the 2010s
| Party | Candidate | Votes | % | ± | |
|---|---|---|---|---|---|
| Labour | Ian Lucas | 17,153 | 48.9 | +11.7 | |
| Conservative | Andrew Atkinson | 15,321 | 43.7 | +12.1 | |
| Plaid Cymru | Carrie Harper | 1,753 | 5.0 | −2.6 | |
| Liberal Democrat | Carole O'Toole | 865 | 2.5 | −2.8 | |
| Majority | 1,832 | 5.2 | −0.4 | ||
| Turnout | 35,092 | 69.6 | +5.4 | ||
| Registered electors | 50,245 | ||||
| Labour hold | Swing | -0.2 | |||
| Party | Candidate | Votes | % | ± | |
|---|---|---|---|---|---|
| Labour | Ian Lucas | 12,181 | 37.2 | +0.4 | |
| Conservative | Andrew Atkinson | 10,350 | 31.6 | +6.2 | |
| UKIP | Niall Plevin-Kelly | 5,072 | 15.5 | +13.2 | |
| Plaid Cymru | Carrie Harper | 2,501 | 7.6 | +1.5 | |
| Liberal Democrat | Rob Walsh | 1,735 | 5.3 | −20.5 | |
| Green | David Munnerley | 669 | 2.0 | N/A | |
| Independent | Brian Edwards[9] | 211 | 0.6 | N/A | |
| Majority | 1,831 | 5.6 | −5.5 | ||
| Turnout | 32,719 | 64.2 | −0.6 | ||
| Registered electors | 50,992 | ||||
| Labour hold | Swing | −2.9 | |||
| Party | Candidate | Votes | % | ± | |
|---|---|---|---|---|---|
| Labour | Ian Lucas | 12,161 | 36.9 | −9.2 | |
| Liberal Democrat | Tom Rippeth | 8,503 | 25.8 | +2.2 | |
| Conservative | Gareth Hughes | 8,375 | 25.4 | +5.4 | |
| Plaid Cymru | Arfon Jones | 2,029 | 6.2 | +0.4 | |
| BNP | Mel Roberts | 1,134 | 3.4 | +0.4 | |
| UKIP | John Humberstone | 774 | 2.3 | N/A | |
| Majority | 3,658 | 11.1 | -11.3 | ||
| Turnout | 32,976 | 64.8 | +1.5 | ||
| Registered electors | 50,872 | ||||
| Labour hold | Swing | −5.7 | |||
Elections in the 2000s
| Party | Candidate | Votes | % | ± | |
|---|---|---|---|---|---|
| Labour | Ian Lucas | 13,993 | 46.1 | −6.9 | |
| Liberal Democrat | Tom Rippeth | 7,174 | 23.6 | +6.5 | |
| Conservative | Therese Coffey | 6,079 | 20.0 | −2.5 | |
| Plaid Cymru | Sion Owen | 1,744 | 5.7 | −0.2 | |
| BNP | John Walker | 919 | 3.0 | N/A | |
| Forward Wales | Janet Williams | 476 | 1.6 | N/A | |
| Majority | 6,819 | 22.4 | −8.1 | ||
| Turnout | 30,385 | 63.3 | +3.8 | ||
| Registered electors | 48,016 | ||||
| Labour hold | Swing | −6.7 | |||
| Party | Candidate | Votes | % | ± | |
|---|---|---|---|---|---|
| Labour | Ian Lucas | 15,934 | 53.0 | −3.1 | |
| Conservative | Felicity Elphick | 6,746 | 22.5 | −1.4 | |
| Liberal Democrat | Ronald Davies | 5,153 | 17.1 | +3.9 | |
| Plaid Cymru | Malcolm Evans | 1,783 | 5.9 | +2.7 | |
| UKIP | Jane Brookes | 432 | 1.4 | N/A | |
| Majority | 9,188 | 30.5 | -1.8 | ||
| Turnout | 30,048 | 59.5 | −12.2 | ||
| Registered electors | 50,465 | ||||
| Labour hold | Swing | -0.8 | |||
Elections in the 1990s
| Party | Candidate | Votes | % | ± | |
|---|---|---|---|---|---|
| Labour | John Marek | 20,450 | 56.1 | +6.1 | |
| Conservative | Stuart Andrew | 8,688 | 23.9 | −8.5 | |
| Liberal Democrat | Andrew Thomas | 4,833 | 13.3 | −1.7 | |
| Referendum | John Cronk | 1,195 | 3.3 | N/A | |
| Plaid Cymru | Kevin Plant | 1,170 | 3.2 | +0.5 | |
| Natural Law | Nicholas Low | 86 | 0.2 | N/A | |
| Majority | 11,622 | 32.3 | +14.8 | ||
| Turnout | 36,422 | 71.8 | -8.9 | ||
| Registered electors | 50,741 | ||||
| Labour hold | Swing | +7.4 | |||
| Party | Candidate | Votes | % | ± | |
|---|---|---|---|---|---|
| Labour | John Marek | 24,830 | 48.3 | +4.4 | |
| Conservative | Owen Paterson | 18,114 | 35.2 | −0.4 | |
| Liberal Democrat | Andrew Thomas | 7,074 | 13.8 | −5.7 | |
| Plaid Cymru | Gareth Wheatley | 1,415 | 2.8 | +1.7 | |
| Majority | 6,716 | 13.1 | +4.8 | ||
| Turnout | 51,433 | 80.7 | −0.2 | ||
| Registered electors | 63,720 | ||||
| Labour hold | Swing | +2.4 | |||
Elections in the 1980s
| Party | Candidate | Votes | % | ± | |
|---|---|---|---|---|---|
| Labour | John Marek | 22,144 | 43.9 | +9.6 | |
| Conservative | Roger Graham-Palmer | 17,992 | 35.6 | +2.2 | |
| Liberal | Martin Thomas | 9,808 | 19.4 | −10.3 | |
| Plaid Cymru | Dennis Watkins | 539 | 1.1 | −1.5 | |
| Majority | 4,152 | 8.3 | +7.4 | ||
| Turnout | 50,483 | 80.9 | +3.4 | ||
| Registered electors | 62,401 | ||||
| Labour hold | Swing | ||||
| Party | Candidate | Votes | % | ± | |
|---|---|---|---|---|---|
| Labour | John Marek | 16,120 | 34.3 | −14.90 | |
| Conservative | Cynthia Kay Wood | 15,696 | 33.4 | +3.80 | |
| Liberal | Martin Thomas | 13,974 | 29.7 | +11.30 | |
| Plaid Cymru | John Thomas | 1,239 | 2.6 | −0.20 | |
| Majority | 424 | 0.9 | -18.76 | ||
| Turnout | 47,029 | 77.5 | -0.94 | ||
| Registered electors | 60,707 | ||||
| Labour hold | Swing | −10.5 | |||
Elections in the 1970s
| Party | Candidate | Votes | % | ± | |
|---|---|---|---|---|---|
| Labour | Tom Ellis | 30,405 | 49.2 | -1.9 | |
| Conservative | Roger Henry William Graham-Palmer | 18,256 | 29.6 | +7.92 | |
| Liberal | Martin Thomas | 11,389 | 18.4 | +4.75 | |
| Plaid Cymru | Hywel Wyn Roberts | 1,740 | 2.8 | +2.26 | |
| Majority | 12,149 | 19.66 | +9.30 | ||
| Turnout | 56,514 | 78.44 | +4.18 | ||
| Registered electors | 78,771 | ||||
| Labour hold | Swing | ||||
| Party | Candidate | Votes | % | ± | |
|---|---|---|---|---|---|
| Labour | Tom Ellis | 28,885 | 51.1 | +4.37 | |
| Liberal | Martin Thomas | 12,519 | 22.15 | -2.25 | |
| Conservative | John Laurence Pritchard | 12,251 | 21.68 | -2.72 | |
| Plaid Cymru | Hywel Wyn Roberts | 2,859 | 5.06 | +0.58 | |
| Majority | 16,366 | 28.96 | +6.64 | ||
| Turnout | 56,514 | 74.26 | -3.37 | ||
| Registered electors | 76,106 | ||||
| Labour hold | Swing | ||||
| Party | Candidate | Votes | % | ± | |
|---|---|---|---|---|---|
| Labour | Tom Ellis | 27,384 | 46.73 | +10.11 | |
| Conservative | John Laurence Pritchard | 14,301 | 24.40 | -4.21 | |
| Liberal | Martin Thomas | 14,297 | 24.40 | +15.14 | |
| Plaid Cymru | Hywel Wyn Roberts | 2,624 | 4.48 | -0.81 | |
| Majority | 13,083 | 22.32 | -5.91 | ||
| Turnout | 58,606 | 77.63 | +2.51 | ||
| Registered electors | 75,492 | ||||
| Labour hold | Swing | ||||
| Party | Candidate | Votes | % | ± | |
|---|---|---|---|---|---|
| Labour | Tom Ellis | 31,089 | 56.84 | -1.73 | |
| Conservative | Benjamin Patterson | 15,649 | 28.61 | +4.05 | |
| Liberal | Wilfred McBriar | 5,067 | 9.26 | +3.12 | |
| Plaid Cymru | Cyril Golding | 2,894 | 5.29 | +0.81 | |
| Majority | 15,440 | 28.23 | +5.78 | ||
| Turnout | 54,699 | 75.12 | -2.07 | ||
| Registered electors | 72,814 | ||||
| Labour hold | Swing | ||||
Elections in the 1960s
| Party | Candidate | Votes | % | ± | |
|---|---|---|---|---|---|
| Labour | Idwal Jones | 30,039 | 58.57 | -0.40 | |
| Conservative | Griffith Hughes Pierce | 12,596 | 24.56 | -8.35 | |
| Liberal | Wilfred McBriar | 6,351 | 12.38 | N/A | |
| Plaid Cymru | John Richard Thomas | 2,297 | 4.48 | +4.44 | |
| Majority | 17,443 | 34.01 | +8.74 | ||
| Turnout | 51,283 | 77.19 | +1.56 | ||
| Registered electors | 66,441 | ||||
| Labour hold | Swing | +4.3 | |||
| Party | Candidate | Votes | % | ± | |
|---|---|---|---|---|---|
| Labour | Idwal Jones | 30,478 | 58.17 | +2.25 | |
| Conservative and National Liberal | Griffith Hughes Pierce | 17,240 | 32.91 | +1.06 | |
| Plaid Cymru | John Richard Thomas | 4,673 | 8.92 | -3.30 | |
| Majority | 13,238 | 25.27 | +1.20 | ||
| Turnout | 52,391 | 78.75 | +2.62 | ||
| Registered electors | 66,530 | ||||
| Labour hold | Swing | ||||
Elections in the 1950s
| Party | Candidate | Votes | % | ± | |
|---|---|---|---|---|---|
| Labour | Idwal Jones | 30,101 | 55.92 | -0.68 | |
| Conservative and National Liberal | Griffith Hughes Pierce | 17,144 | 31.85 | -1.14 | |
| Plaid Cymru | Elystan Morgan | 6,579 | 12.22 | +1.81 | |
| Majority | 12,957 | 24.07 | +0.45 | ||
| Turnout | 53,824 | 81.37 | +5.17 | ||
| Registered electors | 66,150 | ||||
| Labour hold | Swing | ||||
| Party | Candidate | Votes | % | ± | |
|---|---|---|---|---|---|
| Labour | Idwal Jones | 27,945 | 56.60 | -4.91 | |
| Conservative and National Liberal | Griffith Winston Guthrie Jones | 16,286 | 32.99 | -1.86 | |
| Plaid Cymru | Elystan Morgan | 5,139 | 10.41 | +6.77 | |
| Majority | 11,659 | 23.62 | -3.05 | ||
| Turnout | 49,370 | 76.20 | -8.58 | ||
| Registered electors | 64,788 | ||||
| Labour hold | Swing | ||||
| Party | Candidate | Votes | % | ± | |
|---|---|---|---|---|---|
| Labour | Idwal Jones | 23,402 | 57.9 | -3.61 | |
| National Liberal and Conservative | Griffith Winston Guthrie Jones | 12,476 | 30.8 | -4.05 | |
| Plaid Cymru | Elystan Morgan | 4,572 | 11.3 | +7.66 | |
| Majority | 10,926 | 27.0 | +0.33 | ||
| Turnout | 46,072 | 62.4 | -22.38 | ||
| Registered electors | 64,788 | ||||
| Labour hold | Swing | ||||
| Party | Candidate | Votes | % | ± | |
|---|---|---|---|---|---|
| Labour | Robert Richards | 33,759 | 61.51 | +3.68 | |
| Conservative and National Liberal | Willoughby Gervase Cooper | 19,124 | 34.85 | +9.37 | |
| Plaid Cymru | A. Daniel Thomas | 1,997 | 3.64 | +1.91 | |
| Majority | 14,635 | 26.67 | -5.68 | ||
| Turnout | 54,880 | 84.78 | -2.54 | ||
| Registered electors | 64,736 | ||||
| Labour hold | Swing | ||||
| Party | Candidate | Votes | % | ± | |
|---|---|---|---|---|---|
| Labour | Robert Richards | 32,042 | 57.83 | +1.84 | |
| Conservative and National Liberal | Willoughby Gervase Cooper | 14,117 | 25.48 | -3.12 | |
| Liberal | Herbert Mostyn Lewis | 8,287 | 14.96 | 0.45 | |
| Plaid Cymru | Geraint Bowen | 960 | 1.73 | N/A | |
| Majority | 17,925 | 32.35 | +4.95 | ||
| Turnout | 55,406 | 87.32 | +10.52 | ||
| Registered electors | 63,455 | ||||
| Labour hold | Swing | ||||
Election in the 1940s
| Party | Candidate | Votes | % | ± | |
|---|---|---|---|---|---|
| Labour | Robert Richards | 26,854 | 55.99 | -0.30 | |
| Liberal National | David Leslie Milne | 13,714 | 28.60 | N/A | |
| Liberal | John David Williams | 6,960 | 14.51 | -29.20 | |
| Independent Nationalist | John Rathbone Hayes-Jones | 430 | 0.90 | N/A | |
| Majority | 13,140 | 27.40 | +14.83 | ||
| Turnout | 47,958 | 76.80 | +1.31 | ||
| Registered electors | 62,446 | ||||
| Labour hold | Swing | ||||
General Election 1939/40:
Another general election was required to take place before the end of 1940. The political parties had been making preparations for an election to take place from 1939 and by the end of this year, the following candidates had been selected;
- Labour: Robert Richards
- Liberal:
Elections in the 1930s
| Party | Candidate | Votes | % | ± | |
|---|---|---|---|---|---|
| Labour | Robert Richards | 23,650 | 56.29 | +4.18 | |
| Liberal | Aled Roberts | 18,367 | 43.71 | -4.18 | |
| Majority | 5,283 | 12.57 | N/A | ||
| Turnout | 42,017 | 75.49 | +4.30 | ||
| Registered electors | 55,656 | ||||
| Labour gain from Liberal | Swing | ||||
| Party | Candidate | Votes | % | ± | |
|---|---|---|---|---|---|
| Liberal | Aled Roberts | 22,474 | 52.11 | +20.61 | |
| Labour | Robert Richards | 20,653 | 47.89 | +1.49 | |
| Majority | 1,821 | 4.22 | N/A | ||
| Turnout | 43,127 | 79.79 | 5.11 | ||
| Registered electors | 54,048 | ||||
| Liberal gain from Labour | Swing | ||||
Elections in the 1920s
| Party | Candidate | Votes | % | ± | |
|---|---|---|---|---|---|
| Labour | Robert Richards | 20,584 | 46.4 | +2.0 | |
| Liberal | Christmas Price Williams | 13,997 | 31.5 | -24.1 | |
| Unionist | Edmund Fleming Bushby | 9,820 | 22.1 | N/A | |
| Majority | 6,587 | 14.9 | N/A | ||
| Turnout | 44,401 | 84.9 | +2.3 | ||
| Registered electors | 52,310 | ||||
| Labour gain from Liberal | Swing | +13.0 | |||
| Party | Candidate | Votes | % | ± | |
|---|---|---|---|---|---|
| Liberal | Christmas Price Williams | 19,154 | 55.6 | +22.2 | |
| Labour | Robert Richards | 15,291 | 44.4 | +5.4 | |
| Majority | 3,863 | 11.2 | N/A | ||
| Turnout | 35,445 | 82.6 | +1.5 | ||
| Registered electors | 41,686 | ||||
| Liberal gain from Labour | Swing | ||||
| Party | Candidate | Votes | % | ± | |
|---|---|---|---|---|---|
| Labour | Robert Richards | 12,918 | 39.0 | +3.2 | |
| Liberal | Horace Alexander Morgan | 11,037 | 33.4 | +0.8 | |
| Unionist | Edmund Fleming Bushby | 9,131 | 27.6 | -4.0 | |
| Majority | 1,881 | 5.6 | +2.4 | ||
| Turnout | 33,086 | 81.1 | -3.3 | ||
| Registered electors | 40,789 | ||||
| Labour hold | Swing | +1.2 | |||
| Party | Candidate | Votes | % | ± | |
|---|---|---|---|---|---|
| Labour | Robert Richards | 11,940 | 35.8 | +12.1 | |
| National Liberal | E R Davies | 10,842 | 32.6 | -43.7 | |
| Unionist | R C G Roberts | 10,508 | 31.6 | N/A | |
| Majority | 1,098 | 3.2 | N/A | ||
| Turnout | 33,290 | 84.4 | +14.7 | ||
| Registered electors | 39,446 | ||||
| Labour gain from Liberal | Swing | +27.9 | |||
Elections in the 1910s
| Party | Candidate | Votes | % | ± | |
|---|---|---|---|---|---|
| C | Liberal | Robert Thomas | 20,874 | 76.3 | N/A |
| Labour | Hugh Hughes | 6,500 | 23.7 | N/A | |
| Majority | 14,374 | 52.6 | N/A | ||
| Turnout | 27,374 | 69.7 | N/A | ||
| Registered electors | 39,259 | ||||
| Liberal win (new seat) | |||||
| C indicates candidate endorsed by the coalition government. | |||||
See also
References
Craig, F. W. S. (1983). British parliamentary election results 1918-1949 (3 ed.). Chichester: Parliamentary Research Services. ISBN 0-900178-06-X.
External links
- Politics Resources (Election results from 1922 onwards)
- Electoral Calculus (Election results from 1955 onwards)
- 2017 Election House Of Commons Library 2017 Election report
- A Vision Of Britain Through Time (Constituency elector numbers)
Notes and references
- ↑ As with all current Westminster seats it elects one Member of Parliament (MP) by the first-past-the-post system of election.
- ↑ The Wrexham Welsh Assembly constituency was created with the same boundaries in 1999.
- ↑ "Beyond 20/20 WDS - Table view". 2011 Electorate Figures. StatsWales. 1 December 2010. Retrieved 13 March 2011.
- ↑ List of Labour MPs elected in 2015 by % majority UK Political.info. Retrieved 2017-01-29
- ↑ Craig, F.W.S., ed. (1972). Boundaries of parliamentary constituencies 1985-1972. Chichester, Sussex: Political Reference Publications. ISBN 0-900178-09-4.
- ↑ Leigh Rayment's Historical List of MPs – Constituencies beginning with "W" (part 5)
- ↑ "Full Candidate List for Wrexham & Clwyd South". Wrexham.com. Retrieved 11 May 2017.
- ↑ "Wrexham Constituency results". BBC. Retrieved 12 June 2017.
- ↑ "Election Data 2015". Electoral Calculus. Archived from the original on 17 October 2015. Retrieved 17 October 2015.
- ↑ "Wrexham result" (PDF). DECLARATION OF RESULT OF POLL. Wrexham County Borough Council. Retrieved 20 September 2015.
- ↑ "Member of Parliament for Wrexham". YourNextMP. Retrieved 8 February 2015.
- ↑ "Election Data 2010". Electoral Calculus. Archived from the original on 26 July 2013. Retrieved 17 October 2015.
- ↑ "BBC NEWS - Election 2010 - Wrexham". BBC News Online. Retrieved 2010-05-07.
- ↑ "Election Data 2005". Electoral Calculus. Archived from the original on 15 October 2011. Retrieved 18 October 2015.
- ↑ "Wrexham: Constituency > Politics > guardian.co.uk". Election 2010. The Guardian. 2005-05-05. Retrieved 2011-01-22.
- ↑ "Election Data 2001". Electoral Calculus. Archived from the original on 15 October 2011. Retrieved 18 October 2015.
- ↑ "BBC NEWS > VOTE 2001 > RESULTS & CONSTITUENCIES > Wrexham". Vote 2001. BBC News. 7 June 2001. Retrieved 2011-01-22.
- ↑ "Election Data 1997". Electoral Calculus. Archived from the original on 15 October 2011. Retrieved 18 October 2015.
- ↑ "Politics Resources". Election 1997. Politics Resources. 1 May 1997. Retrieved 2011-01-07.
- ↑ C. Rallings & M. Thrasher, The Media Guide to the New Parliamentary Constituencies, p.181 (Plymouth: LGC Elections Centre, 1995)
- ↑ The 1997 election result is calculated relative to the notional, not the actual, 1992 result.
- ↑ "BBC NEWS>VOTE 2001>Results and Constituencies>Wrexham". Vote 2001. BBC News. 1 May 1997. Retrieved 2011-01-12.
- ↑ "Election Data 1992". Electoral Calculus. Archived from the original on 15 October 2011. Retrieved 18 October 2015.
- ↑ "Politics Resources". Election 1992. Politics Resources. 9 April 1992. Retrieved 2010-12-06.
- ↑ "Election Data 1987". Electoral Calculus. Archived from the original on 15 October 2011. Retrieved 18 October 2015.
- ↑ "Election Data 1983". Electoral Calculus. Archived from the original on 15 October 2011. Retrieved 18 October 2015.
- ↑
- ↑
- ↑
- ↑ "British parliamentary by-elections: Wrexham 1955". Web Cite. Archived from the original on October 25, 2009. Retrieved 2011-01-16.
- ↑
- ↑