2017 Atlantic hurricane season
| 2017 Atlantic hurricane season | |
|---|---|
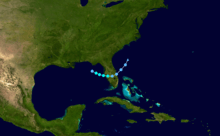
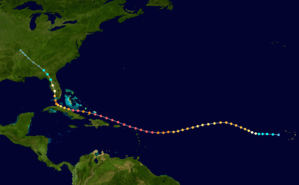
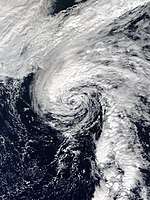
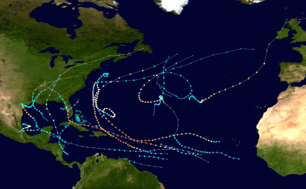 Season summary map | |
| Seasonal boundaries | |
| First system formed | April 19, 2017 |
| Last system dissipated | November 9, 2017 |
| Strongest storm | |
| Name | Maria[nb 1] |
| • Maximum winds |
175 mph (280 km/h) (1-minute sustained) |
| • Lowest pressure | 908 mbar (hPa; 26.81 inHg) |
| Seasonal statistics | |
| Total depressions | 18 |
| Total storms | 17 |
| Hurricanes | 10 |
| Major hurricanes (Cat. 3+) | 6 |
| Total fatalities | 3,361 total |
| Total damage |
≥ $282.16 billion (2017 USD) (Costliest tropical cyclone season on record) |
| Related articles | |
The 2017 Atlantic hurricane season was a hyperactive and catastrophic hurricane season that, with a damage total of at least $282.16 billion (USD), was the costliest tropical cyclone season on record. With over 3,000 estimated deaths, 2017 was the deadliest season since 2005 and also featured both the highest total accumulated cyclone energy (ACE) and the highest number of major hurricanes since 2005. More than 99.7 percent of the season's damage was due to three of the season's major hurricanes – Harvey, Irma, and Maria. Another notable hurricane, Nate, was the worst natural disaster in Costa Rican history; Harvey, Irma, Maria, and Nate had their names retired due to their high damage costs and loss of life. Featuring 17 named storms, 10 hurricanes, and 6 major hurricanes, the 2017 season ranks alongside 1936 as the fifth-most active season since reliable records began in 1851.
This season is also one of only six years on record to feature multiple Category 5 hurricanes, and only the second after 2007 to feature two hurricanes making landfall at that intensity. All ten of the season's hurricanes occurred in a row, the greatest number of consecutive hurricanes in the satellite era, and tied for the greatest number of consecutive hurricanes ever observed in the Atlantic basin since reliable records began in 1851. Additionally, this season is the only season on record in which three hurricanes each had an ACE of over 40: Irma, Jose, and Maria.
The season officially began on June 1 and ended on November 30. These dates historically describe the period of year when most tropical cyclones form in the Atlantic basin. However, as shown by Tropical Storm Arlene in April, the formation of tropical cyclones is possible at other times of the year. In mid-June, Tropical Storm Bret struck the island of Trinidad, which is rarely struck by tropical cyclones, due to its low latitude. In late August, Hurricane Harvey became the first major hurricane to make landfall in the United States since Wilma in 2005 and the first Category 4 hurricane since Charley in 2004, while also tying the record for the costliest tropical cyclone on record, as well as the most rainfall dropped by a tropical cyclone in the United States. In early September, Hurricane Irma became the first Category 5 hurricane to impact the northern Leeward Islands on record, later making landfall in the Florida Keys as a Category 4 hurricane. In terms of maximum sustained winds, Irma is the strongest hurricane ever recorded in the Atlantic Ocean outside of the Gulf of Mexico and Caribbean Sea.[1] In late September, Hurricane Maria became the first Category 5 hurricane to strike the island of Dominica on record. It later made landfall in Puerto Rico as a high-end Category 4 hurricane with catastrophic effect. Most of the deaths from this season occurred from Maria, and caused a humanitarian crisis in Puerto Rico. In early October, Hurricane Nate became the fastest-moving tropical cyclone in the Gulf of Mexico while also becoming the fourth hurricane of the year to make landfall in the contiguous United States. Slightly over a week later, Hurricane Ophelia became the easternmost major hurricane in the Atlantic basin on record, and later impacted most of Northern Europe as an extratropical cyclone. The season concluded with Tropical Storm Rina, which became a post-tropical cyclone on November 9, although the season did not officially end until November 30.
Initial predictions for the season anticipated that an El Niño would develop, lowering tropical cyclone activity. However, the predicted El Niño failed to develop, with cool-neutral conditions developing instead, later progressing to a La Niña – the second one in a row. This led forecasters to raise their predicted totals, with some later anticipating that the season could be the most active since 2010.
Beginning in 2017, the National Hurricane Center (NHC) had the option to issue advisories, and thus allow watches and warnings to be issued, on disturbances that are not yet tropical cyclones but have a high chance to become one, and are expected to bring tropical storm or hurricane conditions to landmasses within 48 hours. Such systems are termed "Potential Tropical Cyclones".[2] The first storm to receive this designation was Potential Tropical Cyclone Two, which later developed into Tropical Storm Bret, east-southeast of the Windward Islands on June 18.[3] In addition, the numbering that a potential tropical cyclone receives would be retained for the rest of the hurricane season, meaning that the next tropical system would be designated with the following number, even though potential tropical cyclones do not qualify as tropical cyclones. This was first demonstrated with Potential Tropical Cyclone Ten, which failed to develop into a tropical cyclone.
Seasonal forecasts
| Source | Date | Named storms |
Hurricanes | Major hurricanes | |
| Average (1981–2010[4]) | 12.1 | 6.4 | 2.7 | ||
| Record high activity | 28 | 15 | 7† | ||
| Record low activity | 4 | 2† | 0† | ||
| ––––––––––––––––––––––––––––––––––––––––––––––––––––––– | |||||
| TSR[5] | December 13, 2016 | 14 | 6 | 3 | |
| TSR[6] | April 5, 2017 | 11 | 4 | 2 | |
| CSU[7] | April 6, 2017 | 11 | 4 | 2 | |
| TWC[8] | April 17, 2017 | 12 | 6 | 2 | |
| NCSU[9] | April 18, 2017 | 11–15 | 4–6 | 1–3 | |
| TWC[10] | May 20, 2017 | 14 | 7 | 3 | |
| NOAA[11] | May 25, 2017 | 11–17 | 5–9 | 2–4 | |
| TSR[12] | May 26, 2017 | 14 | 6 | 3 | |
| CSU[13] | June 1, 2017 | 14 | 6 | 2 | |
| UKMO[14] | June 1, 2017 | 13* | 8* | N/A | |
| TSR[15] | July 4, 2017 | 17 | 7 | 3 | |
| CSU[16] | July 5, 2017 | 15 | 8 | 3 | |
| CSU[17] | August 4, 2017 | 16 | 8 | 3 | |
| TSR[18] | August 4, 2017 | 17 | 7 | 3 | |
| NOAA[19] | August 9, 2017 | 14–19 | 5–9 | 2–5 | |
| ––––––––––––––––––––––––––––––––––––––––––––––––––––––– | |||||
| Actual activity |
17 | 10 | 6 | ||
| * June–November only. † Most recent of several such occurrences. (See all) | |||||
Ahead of and during the season, several national meteorological services and scientific agencies forecast how many named storms, hurricanes, and major hurricanes (Category 3 or higher on the Saffir–Simpson scale) will form during a season, and/or how many tropical cyclones will affect a particular country. These agencies include the Tropical Storm Risk (TSR) Consortium of the University College London, the National Oceanic and Atmospheric Administration (NOAA) and Colorado State University (CSU). The forecasts include weekly and monthly changes in significant factors that help determine the number of tropical storms, hurricanes, and major hurricanes within a particular year.[5] Some of these forecasts also take into consideration what happened in previous seasons and the dissipation of the 2014–16 El Niño event. On average, an Atlantic hurricane season between 1981 and 2010 contained twelve tropical storms, six hurricanes, and two major hurricanes, with an Accumulated Cyclone Energy (ACE) index of between 66 and 103 units.[4]
Pre-season outlooks
The first forecast for the year was issued by TSR on December 13, 2016.[5] They anticipated that the 2017 season would be a near-average season, with a prediction of 14 named storms, 6 hurricanes, and 3 major hurricanes. They also predicted an ACE index of around 101 units.[5] On December 14, CSU released a qualitative discussion detailing five possible scenarios for the 2017 season, taking into account the state of the Atlantic Multidecadal Oscillation and the possibility of El Niño developing during the season.[20] TSR lowered their forecast numbers on April 5, 2017 to 11 named storms, 4 hurricanes, and 2 major hurricanes, based on recent trends favoring the development of El Niño.[6] The next day, CSU released their prediction, also predicting a total of 11 named storms, 4 hurricanes, and 2 major hurricanes.[7] On April 17, The Weather Company released their forecasts, calling for 2017 to be a near-average season, with a total of 12 named storms, 6 hurricanes, and 2 major hurricanes.[8] The next day, on April 18, North Carolina State University released their prediction, also predicting a near-average season, with a total of 11–15 named storms, 4–6 hurricanes, and 1–3 major hurricanes.[9] On May 20, The Weather Company issued an updated forecast, raising their numbers to 14 named storms, 7 hurricanes, and 3 major hurricanes to account for Tropical Storm Arlene as well as the decreasing chance of El Niño forming during the season.[10] On May 25, NOAA released their prediction, citing a 70% chance of an above average season due to "a weak or nonexistent El Niño", calling for 11–17 named storms, 5–9 hurricanes, and 2–4 major hurricanes.[11] On May 26, TSR updated its prediction to around the same numbers as its December 2016 prediction, with only a minor change in the expected ACE index amount to 98 units.[12]
Mid-season outlooks
CSU updated their forecast on June 1 to include 14 named storms, 6 hurricanes, and 2 major hurricanes, to include Tropical Storm Arlene.[13] It was based on the current status of the North Atlantic Oscillation, which was showing signs of leaning towards a negative phase, favoring a warmer tropical Atlantic; and the chances of El Niño forming were significantly lower. However, they stressed on the uncertainty that the El Niño–Southern Oscillation could be in a warm-neutral phase or weak El Niño conditions by the peak of the season.[13] On the same day, the United Kingdom Met Office (UKMO) released its forecast of a very slightly above-average season. It predicted 13 named storms, with a 70% chance that the number would be in the range between 10 and 16, and 8 hurricanes, with a 70% chance that the number would be in the range between 6 and 10. It also predicted an ACE index of 145, with a 70% chance that the index would be between 92 and 198.[14] On July 4, TSR released their fourth forecast for the season, increasing their predicted numbers to 17 named storms, 7 hurricanes, and 3 major hurricanes, due to the fact that El Niño conditions would no longer develop by the peak of the season and the warming of sea-surface temperatures across the basin. Additionally, they predicted a revised ACE index of 116 units.[15] During August 9, NOAA released their final outlook for the season, raising their predictions to 14–19 named storms, though retaining 5–9 hurricanes and 2–5 major hurricanes. They also stated that the season had the potential to be extremely active, possibly the most active since 2010.[19]
Seasonal summary

The Atlantic hurricane season officially began on June 1, 2017.[21] Among the busiest on record, the season produced eighteen tropical depressions, all but one of which further intensified into tropical storms. Ten hurricanes occurred in succession, the greatest number of consecutive hurricanes since the start of the satellite era in 1966. Six of the ten hurricanes further strengthened into major hurricanes. Unlike the pattern of previous years that acted to steer many tropical cyclones harmlessly into the open Atlantic, 2017 featured a pattern conducive for landfalls;[22] in fact, the season culminated into 23 separate landfalls by Atlantic named storms.[23] Over three thousand deaths were recorded while total damage reached over $250 billion, cementing the 2017 season as the costliest in recorded history and making 2017 the deadliest season since 2005.[24]
The hyperactive season came to fruition through a multitude of different factors. Pre-season projections noted the potential for a weak to moderate El Niño event to evolve through the summer and fall on the basis of statistical model guidance; these forecasts were proven to be over-amplified as a result of a phenomenon known as the spring predictability barrier. Instead, equatorial Pacific Ocean temperatures began cooling throughout the summer, reaching La Niña threshold in November and curtailing the negative effects on Atlantic hurricane activity originally expected. In addition, tropical Atlantic Ocean temperatures — previously below average in months prior to the start of the season — underwent rapid warming by late May, providing lower sea level pressures, weaker trade winds, increased mid-level moisture, and all-around a more conducive environment for above average activity.[22]
The season's first tropical cyclone, Arlene, developed on April 19 and became only the second tropical storm on record during the month.[25] Above-average activity continued throughout June and July with the formations of tropical storms Bret, Cindy, Don, Emily, and an unnamed tropical depression; however, a majority of these storms were weak and short-lived.[26] August yielded four storms – Franklin, Gert, Harvey, and Irma – all of which intensified into hurricanes.[27] Harvey attained Category 4 status prior to reaching the Texas coastline, ending the record streak of 4,323 days without a major hurricane landfall in the United States;[28] with damage estimates up to $125 billion, Harvey is tied with Hurricane Katrina as the costliest natural disaster on record in the United States.[29][30] Hurricane Irma reached peak winds of 180 mph (285 km/h), making it the strongest Atlantic hurricane outside the Gulf of Mexico and Caribbean Sea. Irma ravaged the northern Leeward Islands and produced a trail of destruction through the Greater Antilles and Southeast United States.
September featured copious activity, with four hurricanes forming: Jose, Katia, Lee, and Maria,[31] the final of which became the tenth most intense Atlantic hurricane on record.[32] As Irma also persisted into September and reached Category 5 intensity, it and Maria marked the first recorded instance of two Category 5 hurricanes occurring in the same month. Maria caused a major humanitarian crisis in Puerto Rico, resulting in nearly $100 billion in damage and a death toll that exceeded 3,000.[33][34] October featured hurricanes Nate and Ophelia, as well as Tropical Storm Philippe;[35] Ophelia became the easternmost major hurricane on record in the Atlantic.[36] Activity concluded with the formation of Tropical Storm Rina in early November,[37] though the season did not officially end until November 30.[21]
Seasonal activity was reflected with an Accumulated Cyclone Energy index value of 224.88 units,[nb 2] the seventh highest value on record in the Atlantic.[38] ACE is, broadly speaking, a measure of the power of a hurricane multiplied by the length of time it existed; therefore, long-lived storms and particularly strong systems result in high levels of ACE. The measure is calculated at full advisories for cyclones at tropical storm strength—storms with winds in excess of 39 mph (63 km/h). Despite an above average number of storms to begin 2017, many were weak and short-lived, resulting in the lowest ACE value for a season's first five named storms on record.[39] However, Hurricane Irma in August produced the third highest ACE value on record, 64.9 units.[40] The season ultimately featured three storms that produced an ACE value above 40 units, the first occurrence on record.[41] September 2017 featured more ACE than any month in recorded history in the Atlantic (surpassing September 2004),[42] and September 8 alone produced more ACE than any other day on record.[38] Overall, September's ACE value represented activity about three and a half times more active than the 1981–2010 average for the month.[31]
Systems
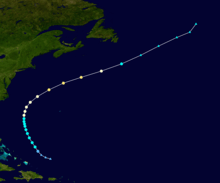
Tropical Storm Arlene
| Tropical storm (SSHWS) | |
  | |
| Duration | April 19 – April 21 |
|---|---|
| Peak intensity | 50 mph (85 km/h) (1-min) 990 mbar (hPa) |
A potent extratropical cyclone formed well east of Bermuda on April 16. The cyclone moved southeast, becoming disconnected from the surrounding environment and gradually losing its frontal characteristics. Deep convection formed in bands north and east of the center by 00:00 UTC on April 19, leading to the formation of a subtropical depression. Despite an unfavorable environment, with ocean temperatures near 20 °C (68 °F) and moderate wind shear, convection coalesced near the center and allowed the subtropical depression to become fully tropical by 00:00 UTC on April 20. It intensified into Tropical Storm Arlene six hours later. After attaining peak winds of 50 mph (85 km/h), the storm began to rotate counterclockwise around a larger extratropical low. The storm tracked into the cold sector of the cyclone, causing Arlene to lose tropical characteristics around 12:00 UTC on April 21. The post-tropical cyclone moved south and east, before dissipating well west-southwest of the Azores on April 22.[43]
Upon its formation as a subtropical depression on April 19, Arlene was the sixth known subtropical or tropical cyclone to form in the month of April in the Atlantic basin; the other instances were Ana in 2003, a subtropical storm in April 1992, and three tropical depressions in 1912, 1915, and 1973, respectively. When Arlene became a tropical storm on April 20, this marked only the second such occurrence on record, after Ana in 2003.[44][nb 3] Furthermore, it had the lowest central pressure of any Atlantic storm recorded in the month of April, with a central pressure of 990 mbar (hPa; 29.23 inHg), again surpassing Ana.[46] Additionally, unrelated to Arlene, Tropical Storm Adrian in the Eastern Pacific basin also formed before the corresponding hurricane season was set to officially begin, being the earliest named storm in the Eastern Pacific proper. This makes 2017 the second consecutive year after 2016 where the first storms in both basins were pre-season storms.[47]
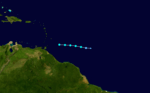
Tropical Storm Bret
| Tropical storm (SSHWS) | |
  | |
| Duration | June 19 – June 20 |
|---|---|
| Peak intensity | 50 mph (85 km/h) (1-min) 1007 mbar (hPa) |
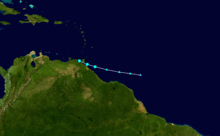
A tropical wave moved off the coast of Africa on June 13 and was first monitored by the National Hurricane Center shortly afterwards.[48] Development, however, was expected to be slow due to its low latitude and relatively fast motion. As it moved swiftly across the Main Development Region of the Atlantic Ocean, the disturbance began to gradually organize, and the NHC raised development chances slightly on June 16.[49] Little change in organization occurred until June 18, at which point a burst of convection near the center of the disturbance prompted the NHC to designate the system as Potential Tropical Cyclone Two at 21:00 UTC. This was the agency's first designation of a disturbance that had not yet developed into a tropical cyclone.[50] The storm continued to organize as it accelerated towards Venezuela and Trinidad and Tobago throughout the night, with banding features becoming evident. Later on June 19, the system developed a closed low-level circulation and was upgraded to Tropical Storm Bret at 21:00 UTC.[51] One day later, at 21:00 UTC on June 20, the last advisory on Bret was issued following its degeneration into a tropical wave.[52] The remnants later contributed to the formation of Hurricane Dora in the eastern Pacific.
According to Phil Klotzbach of Colorado State University, Bret was the earliest storm to form in the Main Development Region on record, surpassing a record set by Tropical Storm Ana in 1979.[53] Bret was also the lowest latitude named storm in the month of June since 1933 at 9.4°N.[54] In Trinidad, one person died after he slipped and fell while running across a makeshift bridge; the fatality is considered indirectly related to Bret.[55][56] In Tobago, a man's house collapsed on him; he eventually succumbed to his injuries a week later.[57]
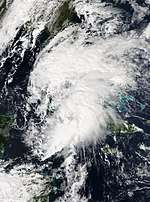
Tropical Storm Cindy
| Tropical storm (SSHWS) | |
  | |
| Duration | June 20 – June 23 |
|---|---|
| Peak intensity | 60 mph (95 km/h) (1-min) 991 mbar (hPa) |
In mid-June, two tropical waves and an area of disturbed weather began merging over the western Caribbean Sea. A broad area of low pressure developed on June 19, and by 18:00 UTC on the following day, Tropical Storm Cindy formed over the central Gulf of Mexico about 240 mi (390 km) south-southwest of the mouth of the Mississippi River. While slowly moving to the northwest, Cindy's intensification was slow due to the effects of dry air and moderate to strong wind shear. After peaking with sustained winds of 60 mph (95 km/h) on June 21, Cindy weakened slightly prior to making landfall in Louisiana just east of Sabine Pass on June 22. The storm quickly weakened after moving inland and degenerated into a remnant low on June 23, dissipating over the Mid-Atlantic on the following day.[58]
Upon making landfall in Louisiana, the storm generated a peak storm surge of 4.1 ft (1.2 m) and tides up to 6.38 ft (1.94 m) above normal in Vermilion Parish. However, coastal flooding mainly consisted of roads being inundated, while some beach erosion occurred.[59] Due to Cindy's weak nature, only a few locations observed sustained tropical storm force winds. Consequently, wind damage was generally minor. Because the cyclone had an asymmetrical structure, heavy rainfall was observed over southeastern Mississippi, southwestern Alabama, and the far western Florida Panhandle, while lesser precipitation amounts fell over Louisiana and Texas. The storm and its remnants spawned 18 tornadoes throughout the Eastern United States, which caused just over $1.1 million in damage. Overall, damage from Cindy totaled less than $25 million. Two fatalities were attributed to the cyclone, one direct and one indirect.[58]
Tropical Depression Four
| Tropical depression (SSHWS) | |
  | |
| Duration | July 5 – July 7 |
|---|---|
| Peak intensity | 30 mph (45 km/h) (1-min) 1009 mbar (hPa) |
Early on June 29, the NHC began tracking a tropical wave embedded within a large envelope of deep moisture across the coastline of western Africa.[60] The disturbance was introduced as a potential contender for tropical cyclone formation two days later, as environmental conditions were expected to favor slow organization.[61] It began to show signs of organization over the central Atlantic early on July 3,[62] but the chances for development began to decrease two days later as the system moved toward a more stable environment.[63] Having already acquired a well-defined circulation, the development of a persistent mass of deep convection around 03:00 UTC the following day prompted the NHC to upgrade the wave to Tropical Depression Four, located about 1,545 miles (2,485 km) east of the Lesser Antilles.[64] Despite wind shear being low, the nascent depression struggled to intensify due to a dry environment caused by a Saharan Air Layer to its east, causing the low-level circulation to weaken, and resulting in the tropical depression degenerating into an open tropical wave late on the next day.[65]
Tropical Storm Don
| Tropical storm (SSHWS) | |
  | |
| Duration | July 17 – July 18 |
|---|---|
| Peak intensity | 50 mph (85 km/h) (1-min) 1005 mbar (hPa) |
Late on July 15, the NHC highlighted a low-pressure trough over the central Atlantic as having the potential to develop into a tropical cyclone in the coming days.[66] The disturbance began to show signs of organization early on July 17,[67] and a tropical depression formed at 06:00 UTC that day. The system continued to intensify, and developed into Tropical Storm Don just six hours later.[68] The storm's overall appearance improved over subsequent hours up until around 00:00 UTC, as a central dense overcast, accompanied by significant clusters of lightning, became pronounced.[69] Don attained its peak intensity at this time, characterized by winds of approximately 50 mph (85 km/h) as measured by reconnaissance aircraft.[68] The next plane to investigate the cyclone a few hours later, however, found that the system's center had become less defined, and that sustained wind speeds had decreased to about 40 mph (65 km/h).[70] A combination of reconnaissance data and surface observations from the Windward Islands indicated that Don opened up into a tropical wave around 12:00 UTC on July 18, as it entered the eastern Caribbean Sea.[68]
Tropical Storm Emily
| Tropical storm (SSHWS) | |
  | |
| Duration | July 30 – August 2 |
|---|---|
| Peak intensity | 60 mph (95 km/h) (1-min) 1001 mbar (hPa) |
In late July, a dissipating cold front extended into the northeastern Gulf of Mexico, where the NHC began forecasting the development of an area of low pressure over the next day on July 30. Any development was expected to be slow due to land proximity and marginal upper-level winds.[71] Contrary to predictions, a rapid period of organization occurred over the next 24 hours and the system was deemed as Tropical Depression Six at 09:00 UTC on July 31,[72] strengthening into Tropical Storm Emily just two hours later. The rapidly-forming storm then reached its peak intensity with winds of 60 mph (75 km/h) and a minimum pressure of 1001 mbar (29.6 inHg) and made landfall on Longboat Key around 14:45 UTC. Weakening quickly ensued, and later that day the circulation of Emily became elongated as it was downgraded to a tropical depression. The increasingly disrupted system later moved off the First Coast of Florida into the western Atlantic early the next day, accelerating northeastwards before degenerating into a remnant low early on August 2.[73]
Following the classification of Tropical Storm Emily, Florida Governor Rick Scott declared a state of emergency for 31 counties to ensure residents were provided with the necessary resources.[74] Heavy rainfall produced by Emily caused widespread flooding in Polk and Pinellas counties, prompting the closure of roads and evacuation of a few homes.[73] Coastal flooding was reported in Hillsborough, Manatee, and Sarasota counties, causing additional road closures.[73] An EF0 tornado touched down Bradenton, destroying 2 barns and multiple greenhouses as well as collapsing an engineered wall.[75] Total damages from Emily are estimated to be near US$10 million.[73]
Hurricane Franklin
| Category 1 hurricane (SSHWS) | |
  | |
| Duration | August 7 – August 10 |
|---|---|
| Peak intensity | 85 mph (140 km/h) (1-min) 981 mbar (hPa) |
The NHC began tracking a tropical wave in the southeastern Caribbean Sea for possible development on August 3.[76] After organizing for a few days, advisories were initiated on Potential Tropical Cyclone Seven at 21:00 UTC on August 6.[77] The disturbance became Tropical Storm Franklin at 00:00 UTC on August 7.[78] After strengthening into a moderate tropical storm, Franklin made its first landfall near Pulticub, Mexico at 03:00 UTC on August 8.[79] The cyclone weakened considerably while over the peninsula, however its satellite presentation remained well-defined, with the inner core tightening up considerably.[80] Later that day, Franklin emerged into the Bay of Campeche, and immediately began strengthening again, becoming a hurricane—the first of the season—late on August 9.[81] Five hours after peaking in intensity with winds of 85 mph (140 km/h) and a pressure of 981 mbar (28.97 inHg),[82] Franklin made landfall in Lechuguillas, Mexico,[83] and thereafter began to rapidly weaken. By 15:00 UTC on August 10, Franklin had dissipated as a tropical cyclone.[84] However, its mid-level circulation remained intact and later contributed to the formation of Tropical Storm Jova in the Eastern Pacific early on August 12.[85]
Immediately upon classification of Franklin as a potential tropical cyclone, tropical storm warnings were issued for much of the eastern side of the Yucatán Peninsula on August 6;[77] a small portion of the coastline was upgraded to a hurricane watch with the possibility of Franklin nearing hurricane intensity as it approached the coastline the next night. Approximately 330 people were reported as going into storm shelters, and around 2,200 relocated from the islands near the coastline to farther inland in advance of the storm.[86] In the Mexican part of the peninsula, damage was reported as having been minimal, mainly in Belize as the storm tracked slightly more northwards then expected, lessening impacts.[86] Nonetheless, some areas received up to a foot of rain.[87]
Hurricane Gert
| Category 2 hurricane (SSHWS) | |
  | |
| Duration | August 12 – August 17 |
|---|---|
| Peak intensity | 110 mph (175 km/h) (1-min) 962 mbar (hPa) |
On August 2, the NHC began monitoring a tropical wave and its associated convection over the western coast of Africa.[88] As the disturbance tracked west-northwest, its structure changed little in organization, but environmental conditions were expected to support the formation of a tropical cyclone.[89] Instead, the system remained poorly defined and entered a less conducive environment east of the Leeward Islands.[90] After progressing into the southwestern Atlantic several days later, the wave encountered more favorable upper-level winds and began to show signs of organization.[91] Following the formation of a well-defined circulation, the disturbance was upgraded to a tropical depression at 03:00 UTC on August 13;[92] by 21:00 UTC that afternoon, it intensified into Tropical Storm Gert.[93] At 03:00 UTC on August 15, Gert intensified to a Category 1 hurricane with maximum sustained winds of 75 mph (120 km/h), making it the second hurricane of the season.[94] Accelerating east-northeastwards, Gert peaked as a high-end Category 2 system early on August 17 at an unusually high latitude of 40°N.[95] Thereafter, Gert began to rapidly weaken as it shifted from the Gulf Stream over cooler waters.[96] Just 12 hours after achieving peak intensity, Gert weakened below hurricane status and degenerated to an extratropical cyclone well east of Nova Scotia.[97]
Two people drowned due to strong rip currents produced by the hurricane: one in the Outer Banks of North Carolina, and the other in Nantucket, Massachusetts.[98][99] The remnants of Gert merged with another extratropical cyclone that later threatened Ireland and the United Kingdom,[100] sparking Met Éireann to issue yellow weather warnings for the entirety of Ireland.[101] As the storm hit, severe floods occurred in Northern Ireland, with floodwaters reaching 1.5 m (4 ft 11 in), and over 100 people were rescued after being trapped by floodwaters overnight.[102]
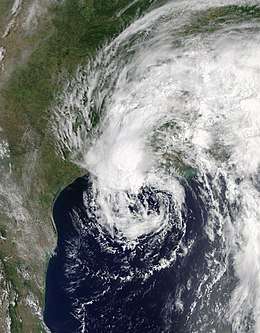
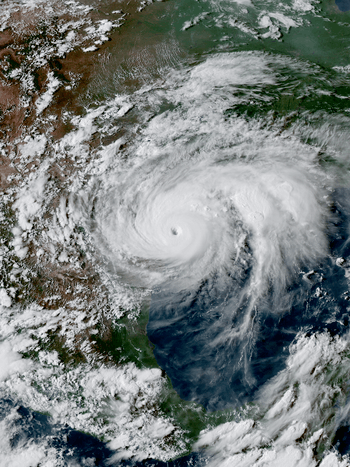
Hurricane Harvey
| Category 4 hurricane (SSHWS) | |
  | |
| Duration | August 17 – September 1 |
|---|---|
| Peak intensity | 130 mph (215 km/h) (1-min) 937 mbar (hPa) |
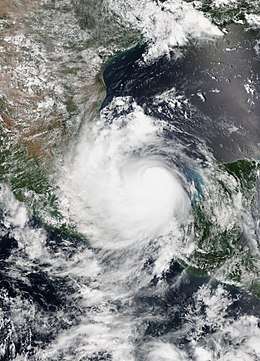
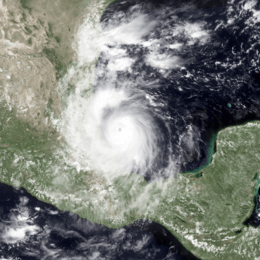
The NHC began monitoring an area of low pressure southwest of Cape Verde on August 13, which was expected to merge with a tropical wave that just emerged off the coast of Africa within a few days.[103] Instead the two systems remained separate,[104] with the first low pressure area coalescing into Potential Tropical Cyclone Nine by 15:00 UTC on August 17, and the other system moving farther north,[105] eventually becoming Potential Tropical Cyclone Ten.[106] A reconnaissance aircraft investigating the system was able to locate a well-defined circulation, and the disturbance was upgraded to Tropical Storm Harvey accordingly six hours later.[107] On a westward course into the Caribbean Sea, the storm was plagued by relentless wind shear, and it degenerated to an open tropical wave south of Hispaniola, by 03:00 UTC on August 20.[108] Harvey's remnants continued into the Bay of Campeche, where more conducive environmental conditions led to the re-designation of a tropical depression, around 15:00 UTC on August 23, and subsequent intensification into a tropical storm by 04:00 UTC on the next morning.[109][110] The tropical cyclone began a period of rapid intensification shortly thereafter, attaining hurricane intensity by 17:00 UTC on August 24,[111] Category 3 strength around 19:00 UTC on August 25,[112] and Category 4 intensity by 23:00 UTC on that day.[111]
Harvey crossed the shore between Port Aransas and Port O'Connor, Texas around 03:00 UTC on August 26, possessing maximum winds of 130 mph (215 km/h).[113] The storm gradually spun down, becoming a tropical storm around 18:00 UTC on August 26, as it meandered across southeastern Texas.[114] A light steering pattern caused the storm to emerge into the Gulf of Mexico on August 28,[115] but a turn toward the north-northeast brought it ashore west of Cameron, Louisiana, as a weak tropical storm around 09:00 UTC on August 30.[116] The system weakened to a tropical depression over central Louisiana late that day before losing tropical characteristics over central Tennessee early on September 1.[117][118]
Rockport, Fulton, and the surrounding cities bore the brunt of Harvey's eyewall as it moved ashore in Texas. Numerous structures were heavily damaged or destroyed, boats were tossed or capsized, power poles were leant or snapped, and trees were downed. As debris covered roadways and cellphone service was compromised, communication to the hardest-hit locales was severed. One person was killed in Rockport after a fire began in his home, and approximately a dozen people were injured.[119] Farther northeast, dire predictions of potentially catastrophic flooding came to fruition in Houston and nearby locales, where floodwaters submerged major highways, forced residents to their attics and roofs, and overwhelmed emergency lines. The National Weather Service tweeted, "This event is unprecedented & all impacts are unknown & beyond anything experienced..." At least 30 people were killed in the Houston area due to flooding.[120] In addition to the flooding, Harvey spawned several tornadoes around Houston.[121] Estimates place the damage caused by Harvey at $125 billion, which ties it with Hurricane Katrina as the costliest tropical cyclone on record.[30] Harvey killed 107 people, including 106 in the United States[30] and 1 man in Guyana who slipped and fell while he was running across a bridge.[122] The storm produced 60.58 inches (1,538.7 mm) of rainfall in Texas, the highest-ever rainfall total for any tropical cyclone in the United States.[123]
Harvey was the first major hurricane to strike the United States since Hurricane Wilma in 2005, ending the record-length 4,323-day span in which no tropical cyclones made landfall as major hurricanes.[124] It was the most intense tropical cyclone to move ashore the US mainland since Hurricane Charley in 2004 until Hurricane Michael in 2018, and the first Category 4 hurricane to make landfall in Texas since Hurricane Carla in 1961.[125]
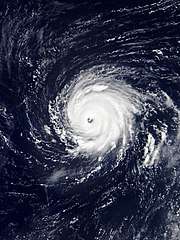
Hurricane Irma
| Category 5 hurricane (SSHWS) | |
  | |
| Duration | August 30 – September 12 |
|---|---|
| Peak intensity | 180 mph (285 km/h) (1-min) 914 mbar (hPa) |
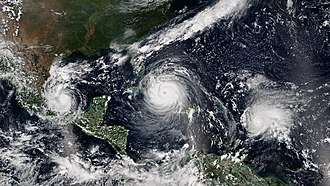
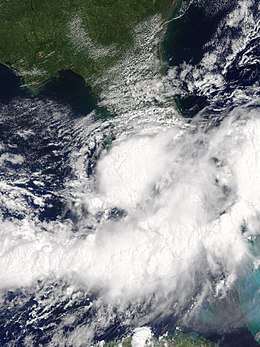
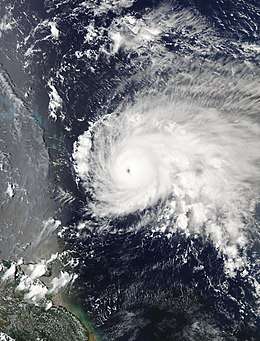
A westward-moving tropical wave, first monitored over western Africa on August 26,[126] organized into Tropical Storm Irma around 15:00 UTC on August 30.[127] Amid an environment of low wind shear and warm ocean temperatures, the newly formed cyclone moved generally westward while strengthening. Irma gradually became better organized; by 09:00 UTC on August 31, it was a high end tropical storm with winds of 70 mph (115 km/h).[128] Over the next six hours, Irma began rapidly intensifying, as its eye cleared, its convection deepened drastically, and its winds jumped to 100 mph.[129] Irma entered an eyewall replacement cycle later that day,[130] which lasted for about 24 hours; however, the hurricane began to intensify after the replacement cycle concluded.[131] Irma fluctuated in intensity over the next few days due to a combination of drier air and eyewall replacement cycles, but by September 4, intensification resumed, and Irma gained Category 4 status.[132] A reconnaissance aircraft investigating the system east of the Caribbean on September 5 found the cyclone at Category 5 intensity, defying predictions of halted intensification.[133] With a clear eye surrounded by a ring of extremely deep convection, Irma attained its peak intensity with winds of 180 mph (285 km/h) later that day,[134] and maintained this intensity for the next 37 hours as it moved through the northern Leeward Islands.[135] Some weakening occurred south of the Bahamas,[136] but the cyclone regained Category 5 intensity before making landfall on the Cayo Romano of Cuba at 03:00 UTC on September 9 with winds of 160 mph (260 km/h).[137] Land interaction disrupted the storm temporarily,[138] but once again it strengthened to acquire winds of 130 mph (215 km/h), before making landfall in Cudjoe Key of the Florida Keys early on September 10.[139] A few hours later, it struck Marco Island, Florida, with winds of 115 mph (185 km/h).[140] Irma continued north and west, steadily weakening over the Southeastern United States before losing tropical characteristics in Georgia, early on September 12.[141]
With peak winds of 180 mph (285 km/h), Irma was the strongest Atlantic storm outside of the Gulf of Mexico or Caribbean Sea on record. Winds were experimentally measured at 185 mph (295 km/h) by the NHC[142], but the official peak intensity remains near 180 mph (285 km/h). Maintaining peak intensity for 37 consecutive hours, Irma is the only tropical cyclone on record worldwide to have had winds that intense for so long. As the storm moved through the northern Leeward Islands, it became the only Category 5 hurricane to make a direct impact there; its landfall intensity stands only behind the 1935 Labor Day hurricane as the strongest landfalling cyclone on record in the Atlantic. Two Category 4 hurricanes, Harvey and Irma, struck the continental United States in the span of two weeks; this marks the first time the country has suffered two landfalls of such intensity during the same hurricane season in recorded history. Lastly, Irma accrued the third-highest Accumulated Cyclone Energy index on record in the Atlantic,[143] behind only the 1899 San Ciriaco hurricane and Hurricane Ivan of 2004.
In the aftermath of Irma, development on the islands of Barbuda and Saint Martin was described as being "95% destroyed" by respective political leaders, with 1,400 people feared homeless in Barbuda.[144] Irma resulted in at least 134 deaths, including 92 in the United States and 42 across the Caribbean.[133] Irma was the top Google searched item of 2017.[145]
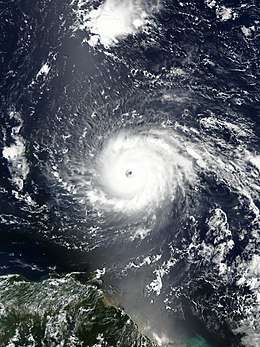
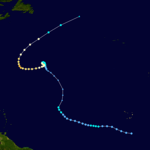
Hurricane Jose
| Category 4 hurricane (SSHWS) | |
  | |
| Duration | September 5 – September 22 |
|---|---|
| Peak intensity | 155 mph (250 km/h) (1-min) 938 mbar (hPa) |
A westward-moving tropical wave exited the west coast of Africa on August 31,[146] organizing into Tropical Storm Jose over the open eastern Atlantic by 15:00 UTC on September 5.[147] The quickly-strengthening cyclone attained hurricane intensity late on September 6,[148] reached major hurricane strength late on September 7,[149] and ultimately peaked as a high-end Category 4 hurricane with winds of 155 mph (250 km/h) early on September 9.[150] Moderate wind shear weakened the cyclone as it conducted a slow clockwise loop between Bermuda and the Caribbean Sea and eventually moved north ahead of an approaching trough.[151] Steering currents collapsed by early on September 21, causing the system to stall offshore the Northeastern United States as a weakening tropical storm.[152] With a rain shield in the northern and northwestern semicircles accompanied by a lack of deep convection over the center, the NHC declared Jose a post-tropical cyclone around 03:00 UTC on September 22, ending advisories once the storm's tropical storm-force winds moved off the New England coast at 21:00 UTC.[153][154]
The government of Antigua and Barbuda began efforts on September 8 to evacuate the entire island of Barbuda prior to Jose's anticipated arrival, as most structures on the island had been heavily damaged or destroyed by Hurricane Irma.[155] When Jose reached peak intensity, it marked the first time on record in the Atlantic basin that two hurricanes, the other being Irma, occurring simultaneously had maximum sustained winds of 150 mph (240 km/h).[156]
Hurricane Katia
| Category 2 hurricane (SSHWS) | |
  | |
| Duration | September 5 – September 9 |
|---|---|
| Peak intensity | 105 mph (165 km/h) (1-min) 972 mbar (hPa) |
A trough was present over the southwestern Gulf of Mexico on September 3, producing a widespread area of thunderstorms.[157] Two days later, a distinct low pressure area formed about 50 mi (80 km) east of Tampico, Tamaulipas.[158] At 21:00 UTC that day, the NHC designated the system as Tropical Depression Thirteen after an organized area of convection formed over the center. Located in an area of weak steering currents, the depression drifted slowly eastward. With gradually decreasing wind shear and warm water temperatures, the system intensified into Tropical Storm Katia on September 6, as the convection became better organized.[159][160] Later that day, an aircraft reconnaissance flight into the storm found a partial eye wall and surface winds of 76 mph (122 km/h); on that basis, the NHC upgraded Katia to hurricane status.[161] The convection organized into a central dense overcast as the system stalled.[162] Late in the evening of September 8, Katia made landfall north of Tecolutla, Mexico as a weak Category 1 storm.[163] The system rapidly dissipated over land on September 9. Katia's remnants traveled across Central America and later emerged over the Pacific Ocean, where redevelopment ensued. Tropical Depression Fifteen-E formed, which later strengthened into Hurricane Otis about a week later.[164]
In preparation for Katia, over 4,000 residents were evacuated from the states of Veracruz and Puebla.[165] Tourists left coastal towns, emergency shelters were opened, and storm drains were cleared before the onset of heavy rainfall.[166] Two fatalities were reported in Xalapa from mudslides, while a third man was swept away by floodwaters in Jalcomulco. States of emergency were declared for 40 out of a total 53 municipalities that reported minor damage from mudslides and flooding.[167] About 77,000 residents were left without power at the height of the storm.[168]
Hurricane Lee
| Category 3 hurricane (SSHWS) | |
  | |
| Duration | September 14 – September 30 |
|---|---|
| Peak intensity | 115 mph (185 km/h) (1-min) 962 mbar (hPa) |
A tropical wave moved off the coast of Africa on September 13. Contrary to predictions of only gradual organization over the following days,[169] the system rapidly organized, becoming Tropical Depression Fourteen at 03:00 UTC on September 15.[170] The NHC upgraded the system to Tropical Storm Lee at 15:00 UTC on the next day, based on an increase in deep convection and an advanced scatterometer (ASCAT) pass which indicated that it was producing minimal tropical-storm-force winds.[171] After encountering wind shear, Lee gradually weakened into a tropical depression early on September 17. As Lee moved northwest in tandem with an upper-level trough with periodic bursts of convection, wind shear decreased slightly, allowing Lee to reintensify to a tropical storm again early on September 19 and attaining an initial peak intensity with winds of 45 mph (70 km/h) that day. However, wind shear again increased, and Lee opened up into a trough early the next day.[172] The NHC monitored the remnants of Lee intermittently for several days, but regeneration was not considered likely.[173][174] However, the mid-level remnants of the tropical cyclone became intertwined with an upper-level trough; a deep burst of convection led to a new surface circulation, and by 21:00 UTC on September 22, the system reorganized into Tropical Depression Lee.[175] Lee intensified into a tropical storm six hours later.[176]
A compact tropical cyclone, Lee organized, as small curved bands wrapped into a small cluster of central convection.[177] A microwave pass around 21:00 UTC on September 23 indicated the formation of a ring of shallow to moderate convection around the center, often a harbinger of rapid intensification.[178] Indeed, by 06:30 UTC the next morning, the presence of an eye on satellite imagery prompted the NHC to abruptly upgrade Lee to a hurricane as it moved erratically.[179] After attaining winds of 90 mph (150 km/h), the storm weakened slightly due to moderate southeasterly wind shear.[180] By 09:00 UTC on September 26, however, the storm attained Category 2 strength.[181] An eyewall replacement cycle that night led to the emergence of a larger eye surrounded by cold cloud tops, and by 15:00 UTC on September 27, Lee reached its peak intensity as a Category 3 hurricane with winds of 115 mph (185 km/h).[182] The system recurved northeast after peak intensity and quickly succumbed to strong northerly wind shear and progressively cooler ocean waters;[183] it weakened below major hurricane strength by 03:00 UTC on September 28,[184] fell below hurricane strength by 15:00 UTC on September 29,[185] and degenerated to a post-tropical cyclone by 09:00 UTC on September 30, after lacking deep convection for over 12 hours.[186] On October 1, Lee's remnant was absorbed by another extratropical cyclone to the north.[187]
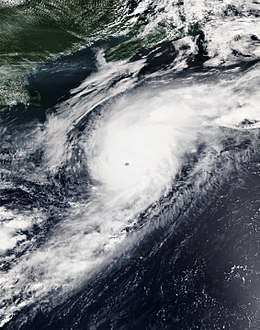
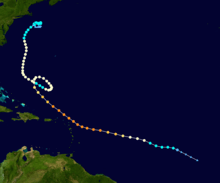
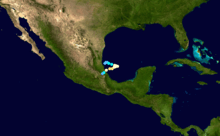
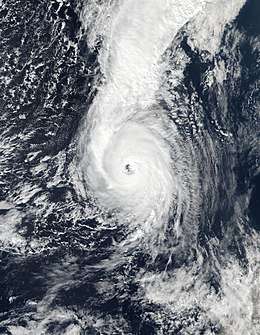
Hurricane Maria
| Category 5 hurricane (SSHWS) | |
  | |
| Duration | September 16 – September 30 |
|---|---|
| Peak intensity | 175 mph (280 km/h) (1-min) 908 mbar (hPa) |
On September 13, the NHC began monitoring a tropical wave southwest of Cape Verde.[188] The disturbance moved west, organizing into a potential tropical cyclone at 15:00 UTC on September 16 and Tropical Storm Maria six hours later.[189][190] On a west-northwest course, Maria intensified at an exceptional rate; over a 24-hour period ending at 00:00 UTC on September 19, Maria nearly doubled its winds from 85 mph (140 km/h) to 165 mph (270 km/h), thus reaching Category 5 strength.[191][192] After striking Dominica at that intensity a little over an hour later,[193] the storm weakened slightly as it entered the eastern Caribbean Sea; amid favorable conditions, however, Maria regained Category 5 intensity and eventually reached peak winds of 175 mph (280 km/h) late on September 19.[194] Around 08:00 UTC on September 20, the eyewall of Maria struck Vieques,[195] and a little over two hours later, the core of the storm made landfall near Yabucoa, Puerto Rico, with winds of 155 mph (250 km/h).[196] Land interaction caused a significant degration in Maria's structure, and it weakened to a Category 2 hurricane while moving offshore.[197] Growing in size and curving north, Maria regained Category 3 strength and maintained this intensity for several days before entering a less conducive environment.[198] After fluctuating between tropical storm and minimal hurricane strength off the coastline of North Carolina,[199] the system turned sharply east away from the United States, and ultimately evolved into an extratropical cyclone over the far northern Atlantic, on September 30.[200][201]
Dominica sustained catastrophic damage from Maria, with nearly every structure on the island damaged or destroyed.[202] Surrounding islands were also dealt a devastating blow, with reports of flooding, downed trees, and damaged buildings. Puerto Rico also suffered catastrophic damage. The island's electric grid was devastated, leaving all 3.4 million residents without power. Many structures were leveled, while floodwaters trapped thousands of citizens. The United States National Guard, Coast Guard, Army Corps of Engineers, and other like units worked to administer aid and assist in search and rescue operations. However, the U.S. federal government response was criticized for its delay in waiving the Jones Act, a statute which prevented Puerto Rico from receiving aid on ships from non-U.S. flagged vessels. Along the coastline of the United States, tropical storm-force gusts cut power to hundreds of citizens; rip currents offshore led to three deaths and numerous water rescues. Most of the damage occurred in Puerto Rico; Ricardo Rosselló, the governor of Puerto Rico, believes the storm caused $90 billion in damages.[203] 146 people were confirmed to have been directly killed by the hurricane: 64 in Puerto Rico, 65 in Dominica, 5 in the Dominican Republic, 4 in the contiguous United States, 3 in Haiti, 2 in Guadeloupe, and 3 in the United States Virgin Islands. The indirect death toll is much higher; an estimated 2,975 people in total died in Puerto Rico as a result of Hurricane Maria, in the six months after the hurricane, due to the effects of catastrophic damage to the island's infrastructure.[204]
Maria was the deadliest hurricane in Dominica since the 1834 Padre Ruíz hurricane,[205] and the deadliest in Puerto Rico since the 1899 San Ciriaco hurricane.[206]
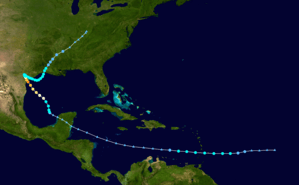
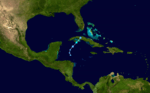
Hurricane Nate
| Category 1 hurricane (SSHWS) | |
 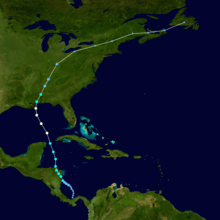 | |
| Duration | October 4 – October 9 |
|---|---|
| Peak intensity | 90 mph (150 km/h) (1-min) 981 mbar (hPa) |
On October 3, a broad area of low pressure formed in the southwestern Caribbean Sea.[207] The disturbance quickly organized, and on October 4, the NHC announced that the disturbance had strengthened into Tropical Depression Sixteen, and began issuing advisories on the storm.[208] The system slowly became stronger and more organized, and, early on October 5, was deemed a tropical storm and named Nate.[209] Early on October 7, Nate was upgraded to a hurricane while located 345 miles south-southeast of the mouth of the Mississippi River.[210] At 7:00 p.m. CDT on October 8, as a Category 1 hurricane with winds of 85 mph, Nate made landfall at the mouth of the Mississippi;[211] Nate's second U.S landfall was at 10:00 p.m. CDT near Biloxi, Mississippi. After Nate tracked inland, it quickly weakened into a tropical depression, and a few hours later, evolved into an extratropical storm. Hurricane Nate also broke the record for the fastest moving hurricane ever recorded in the Gulf of Mexico.[212]
Nate caused at least 48 deaths, including 16 in Nicaragua,[213] 14 in Costa Rica,[214] 7 in Panama,[215] 5 in Guatemala, 3 in Honduras,[215] 2 in the United States,[216][217] and 1 in El Salvador,[215] , and a further 9 missing accumulative of all affected areas. Total damages from the hurricane are estimated at US$787 million, and with an estimated ₡317.5 billion (US$562 million) in Costa Rica alone, it is the costliest natural disaster in that country's history.[218]
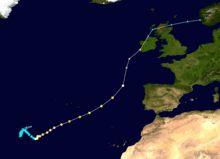
Hurricane Ophelia
| Category 3 hurricane (SSHWS) | |
  | |
| Duration | October 9 – October 16 |
|---|---|
| Peak intensity | 115 mph (185 km/h) (1-min) 959 mbar (hPa) |
On October 6, a circulation developed at the end of a cold front in the northeast Atlantic, with a low pressure area developing within the circulation on the same day.[219] While the low drifted slowly to the northeast, it began to lose its frontal system and acquire subtropical characteristics by October 7.[220] The next day, the storm encountered stronger wind shear, removing some of its convection, and slightly weakening the system; however, the storm eventually grew better organized and developed more convection around its low pressure center later in the day.[221] Early on October 9, the system fully transitioned into a tropical cyclone, prompting the NHC to begin issuing advisories on Tropical Depression Seventeen.[222][223] The tropical depression continued to strengthen, becoming Tropical Storm Ophelia later that day.[224] Ophelia continued to strengthen due to low wind shear and on October 11, the National Hurricane Center upgraded it to a hurricane, making it the tenth consecutive storm this season to reach hurricane strength.[225] Ophelia became a Category 2 hurricane on October 12 at 5:00 p.m. AST (21:00 UTC).[226] On October 14 at 11:00 a.m. AST (15:00 UTC), Ophelia unexpectedly intensified to a Category 3 hurricane, making Ophelia the sixth major hurricane of the season and the easternmost major hurricane in the Atlantic basin on record.[227] On October 15, Ophelia began to weaken, while accelerating northeastward towards Ireland and Great Britain, with the storm's wind field also expanding. Early on October 16, Ophelia transitioned into a hurricane-strength extratropical cyclone, as it began impacting Ireland and Britain.
In County Waterford, a woman was killed when a tree fell on her car, caused by the winds from Ophelia's remnants.[228] In County Tipperary, a man was killed while clearing a fallen tree with a chainsaw.[229] Another person was killed in Dundalk when a tree fell on his car.[230] Two other men died after suffering fatal injuries while carrying out repairs to damage caused by Ophelia and Storm Brian.[231]
Tropical Storm Philippe
| Tropical storm (SSHWS) | |
  | |
| Duration | October 28 – October 29 |
|---|---|
| Peak intensity | 40 mph (65 km/h) (1-min) 1000 mbar (hPa) |
On October 22, the NHC forecasted that a broad area of low pressure would form in the southwestern Caribbean Sea.[232] On October 23, as predicted, a broad low formed off of the northwestern coast of Nicaragua.[233] However, the system remained disorganized for the next several days[234] until the afternoon of October 27, when it quickly organized, prompting the NHC to upgrade the system into Potential Tropical Cyclone Eighteen, since it lacked a well-defined center.[235] Over the next day, gradual organization occurred until the system coalesced into a tropical depression at 12:00 UTC on October 28; it strengthened into Tropical Storm Philippe six hours later. Strong wind shear and land interaction quickly began to cause the system to become disorganized, and Philippe made landfall near Cuba's Zapata Peninsula as a very disorganized tropical storm with winds of 40 mph (65 km/h).[235] It dissipated hours later – although operationally, Philippe was assessed as crossing the Florida Keys and exiting into the western Atlantic Ocean, which was later attributed in post-analysis to a non-tropical area of low pressure that was interacting with Philippe, shortly before it dissipated.[236]
Tropical Storm Rina
| Tropical storm (SSHWS) | |
  | |
| Duration | November 5 – November 9 |
|---|---|
| Peak intensity | 60 mph (95 km/h) (1-min) 991 mbar (hPa) |
In early November, the National Hurricane Center began to monitor a non-tropical area of low pressure in the central Atlantic, which had formed at the end of a decaying cold front, for potential tropical development. Gradually, the system became better organized and was able to maintain an area of deep convection to the east of the center. On the morning of November 6, the low had developed sufficiently organized convection to be classified as a tropical depression.[237] As the day progressed, wind shear from the west began to impact the tropical cyclone, displacing shower and thunderstorm activity to the east. Despite this, the system continued to strengthen, and at 00:00 UTC on November 7, the tropical depression strengthened into Tropical Storm Rina.[238] As it started on a northerly track, Rina continued to strengthen despite strong shear and dry air intrusion, and also began to show subtropical characteristics marked by most of the deep convection and strongest winds well removed from the center. Nonetheless, Rina strengthened into a strong tropical storm with peak winds of 60 mph (95 km/h). Shortly after attaining peak strength, convection began to wane and became displaced well from the center of the system, while the overall structure became comma-like in appearance on satellite imagery, signifying extratropical transition. The storm began to accelerate to the north ahead of an approaching cold front and was absorbed into the frontal system around 18:00 UTC on November 9, a few hundred miles to the northeast of Newfoundland.[239]
Other systems

The NHC began monitoring a tropical wave that just emerged off the coast of Africa on August 13, which was expected to merge with an area of low pressure southwest of Cape Verde within a few days.[103] Instead the two systems remained separate,[104] with the first eventually coalescing into Potential Tropical Cyclone Ten on August 27, to the northeast of Florida, and the other low pressure eventually becoming Hurricane Harvey.[105][104] The NHC gave this disturbance a 90% chance of becoming a tropical cyclone within the next 48 hours.[240] After attaining 1-minute sustained winds of 45 mph (70 km/h), the system subsequently began to undergo an extratropical transition.[241][242] Consequently, the NHC issued its last advisory on the system at 21:00 UTC on August 29, declaring the system to be an extratropical low.[243] However, after the storm became extratropical, it strengthened, peaking at maximum sustained winds of 80 mph,[244] before being absorbed by a larger extratropical system, Windstorm Perryman.[245][246]
Storm names
The following list of names was used for named storms that formed in the North Atlantic in 2017. The names not retired from this list will be used again in the 2023 season.[247] This was the same list used in the 2011 season, with the exception of the name Irma, which replaced Irene. Irma was previously used in 1978.
|
The usage of the name "Don" in July garnered some attention relating to United States President Donald Trump. Max Mayfield, former director of the National Hurricane Center, clarified that the name had no relation to Trump and was chosen in 2006 as a replacement for Dennis. Regardless, some outlets such as the Associated Press, "poked fun" at the name and Trump.[248][249]
Retirement
On April 11, 2018, at the 40th session of the RA IV hurricane committee, the World Meteorological Organization retired the names Harvey, Irma, Maria, and Nate from its rotating naming lists due to the number of deaths and amount of damage they caused, and they will not be used again for another Atlantic hurricane. They will be replaced with Harold, Idalia, Margot, and Nigel for the 2023 season, respectively.[250] With four names retired, the 2017 season is tied with the 1955, 1995 and 2004 seasons for the second-highest number of storm names retired after a single Atlantic season, only surpassed by the 2005 season, which had five retired names.[251]
Season effects
This is a table of all the storms that formed in the 2017 Atlantic hurricane season, besides Potential Tropical Cyclone Ten. It includes their duration, names, affected areas, damages, and death totals. Deaths in parentheses are additional and indirect (an example of an indirect death would be a traffic accident), but were still related to that storm. Damage and deaths include totals while the storm was extratropical, a tropical wave, or a low, and all the damage figures are in 2017 USD. Potential tropical cyclones are not included in this table.
| Saffir–Simpson scale | ||||||
| TD | TS | C1 | C2 | C3 | C4 | C5 |
| Storm name |
Dates active | Storm category
at peak intensity |
Max 1-min wind mph (km/h) |
Min. press. (mbar) |
Areas affected | Damage (USD) |
Deaths | Refs | ||
|---|---|---|---|---|---|---|---|---|---|---|
| Arlene | April 19 – 21 | Tropical storm | 50 (85) | 990 | None | None | None | |||
| Bret | June 19 – 20 | Tropical storm | 50 (85) | 1007 | Guyana, Venezuela, Trinidad and Tobago, Windward Islands | ≥ $3 million | 1 (1) | |||
| Cindy | June 20 – 23 | Tropical storm | 60 (95) | 991 | Honduras, Belize, Cayman Islands, Yucatán Peninsula, Cuba, Southern United States, Eastern United States | $25 million | 1 (1) | |||
| Four | July 5 – 7 | Tropical depression | 30 (45) | 1009 | None | None | None | |||
| Don | July 17 – 18 | Tropical storm | 50 (85) | 1005 | Windward Islands, Barbados, Trinidad and Tobago | None | None | |||
| Emily | July 30 – August 1 | Tropical storm | 60 (95) | 1001 | Florida | $10 million | None | |||
| Franklin | August 7 – 10 | Category 1 hurricane | 85 (140) | 981 | Nicaragua, Honduras, Guatemala, Belize, Yucatán Peninsula, Central Mexico | $15 million | None | |||
| Gert | August 12 – 17 | Category 2 hurricane | 110 (175) | 962 | Bermuda, East Coast of the United States, Atlantic Canada | None | 0 (2) | |||
| Harvey | August 17 – September 1 | Category 4 hurricane | 130 (215) | 937 | Barbados, Suriname, Guyana, Windward Islands, Nicaragua, Belize, Yucatán Peninsula, Northeastern Mexico, Southern United States (Texas, Louisiana), Eastern United States | $125 billion | 68 (39) | |||
| Irma | August 30 – September 12 | Category 5 hurricane | 180 (285) | 914 | Cape Verde, Leeward Islands (Barbuda, Saint Martin, Saint Barthelemy, U.S. Virgin Islands), Puerto Rico, Hispaniola, Turks and Caicos Islands, The Bahamas, Cuba, Southeastern United States (Florida and Georgia), Northeastern United States | $64.76 billion | 52 (82) | |||
| Jose | September 5 – 22 | Category 4 hurricane | 155 (250) | 938 | Leeward Islands, East Coast of the United States | $2.84 million | 0 (1) | |||
| Katia | September 5 – 9 | Category 2 hurricane | 105 (165) | 972 | Eastern Mexico | Unknown | 3 (0) | |||
| Lee | September 15 – 30 | Category 3 hurricane | 115 (185) | 962 | None | None | None | |||
| Maria | September 16 – 30 | Category 5 hurricane | 175 (280) | 908 | Lesser Antilles (British Virgin Islands, Dominica, Guadeloupe, Martinique, Saint Croix), Puerto Rico, Hispaniola, Turks and Caicos Islands, The Bahamas, Southeastern United States, Mid-Atlantic States, United Kingdom, Ireland, France, Spain | $91.606 billion | 3,057 | |||
| Nate | October 4 – 9 | Category 1 hurricane | 90 (150) | 981 | Nicaragua, Honduras, Costa Rica, El Salvador, Panama, Mexico, Cayman Islands, Cuba, Southeastern United States (Louisiana, Alabama, Mississippi, and Florida Panhandle), Northeastern United States, Atlantic Canada | $787 million | 46 (2) | |||
| Ophelia | October 9 – 16 | Category 3 hurricane | 115 (185) | 959 | Azores, Portugal, Spain, France, Ireland, United Kingdom, Norway, Sweden, Finland, Estonia, Russia | > $13.6 million | 2 (3) | |||
| Philippe | October 28 – 29 | Tropical storm | 40 (65) | 1000 | Central America, Cayman Islands, Yucatán Peninsula, Cuba, Florida | Minimal | None | |||
| Rina | November 5 – 9 | Tropical storm | 60 (95) | 991 | None | None | None | |||
| Season Aggregates | ||||||||||
| 18 systems | April 19 – November 9 |
180 (285) | 908 | ≥ $282.16 billion | 3,230 (131) | |||||
See also
- List of Atlantic hurricane seasons
- List of wettest tropical cyclones
- List of tropical cyclone records
- 2017 Pacific hurricane season
- 2017 Pacific typhoon season
- 2017 North Indian Ocean cyclone season
- South-West Indian Ocean cyclone seasons: 2016–17, 2017–18
- Australian region cyclone seasons: 2016–17, 2017–18
- South Pacific cyclone seasons: 2016–17, 2017–18
- Mediterranean tropical-like cyclone
- South Atlantic tropical cyclone
- Tropical cyclones and climate change
Footnotes
- ↑ The "strength" of a tropical cyclone is measured by the minimum barometric pressure, not wind speed. Most meteorological organizations rate the intensity of a storm by this figure, so the lower the minimum pressure of the storm, the more intense or "stronger" it is considered to be. The strongest winds were actually from Irma, at 180 mph (285 km/h).
- ↑ The totals represent the sum of the squares for every (sub)tropical storm's intensity of over 33 knots (38 mph, 61 km/h), divided by 10,000. Calculations are provided at Talk:2017 Atlantic hurricane season/ACE calcs.
- ↑ It should be noted that Arlene would likely not have been detected without the help of satellites, and there may well have been other similar storms this early in the year in the pre-satellite era (1966 and before).[45]
References
- ↑ Ops, NHC Atlantic (2017-09-05). "#Irma is the strongest #hurricane in the Atlantic basin outside of the Caribbean Sea & Gulf of Mexico in NHC records". @NHC_Atlantic. Retrieved 2017-09-05.
- ↑ "Update on National Hurricane Center Products and Services for 2017" (PDF). National Hurricane Center. Retrieved March 12, 2017.
- ↑ "Potential Tropical Cyclone Two". Nhc.noaa.gov. Retrieved 2017-06-20.
- 1 2 "Background Information: The North Atlantic Hurricane Season". Climate Prediction Center. National Oceanic and Atmospheric Administration. August 9, 2012. Retrieved December 13, 2013.
- 1 2 3 4 Mark Saunders; Adam Lea (December 13, 2016). Extended Range Forecast for Atlantic Hurricane Activity in 2017 (PDF) (Report). London, United Kingdom: Tropical Storm Risk.
- 1 2 Mark Saunders; Adam Lea (April 5, 2017). April Forecast Update for Atlantic Hurricane Activity in 2017 (PDF) (Report). London, United Kingdom: Tropical Storm Risk.
- 1 2 Phillip J. Klotzbach; William M. Gray (April 6, 2017). "Extended Range Forecast of Atlantic Seasonal Hurricane Activity and Landfall Strike Probability for 2017" (PDF). Colorado State University. Retrieved April 6, 2017.
- 1 2 "2017 Atlantic Hurricane Season Forecast Calls For a Near-Average Number of Storms, Less Active Than 2016". weather.com. Retrieved 20 April 2017.
- 1 2 WRAL (18 April 2017). "NCSU researchers predict 'normal' hurricane season :: WRAL.com". wral.com. Retrieved 20 April 2017.
- 1 2 "2017 Atlantic Hurricane Season Forecast Update Calls For An Above-Average Number Of Storms". weather.com. Retrieved 20 May 2017.
- 1 2 "Above-normal Atlantic hurricane season is most likely this year". National Oceanic and Atmospheric Administration. May 25, 2017.
- 1 2 Mark Saunders; Adam Lea (May 26, 2017). Pre-Season Forecast for North Atlantic Hurricane Activity in 2017 (PDF) (Report). London, United Kingdom: Tropical Storm Risk.
- 1 2 3 Phillip J. Klotzbach; William M. Gray (June 1, 2017). "Extended Range Forecast of Atlantic Seasonal Hurricane Activity and Landfall Strike Probability for 2017" (PDF). Colorado State University. Retrieved June 1, 2017.
- 1 2 "North Atlantic tropical storm seasonal forecast 2017". Met Office. June 1, 2017. Retrieved July 21, 2017.
- 1 2 Mark Saunders; Adam Lea (July 4, 2017). July Forecast Update for Atlantic Hurricane Activity in 2017 (PDF) (Report). Tropical Storm Risk.
- ↑ Phillip J. Klotzbach; William M. Gray (July 5, 2017). "FORECAST OF ATLANTIC SEASONAL HURRICANE ACTIVITY AND LANDFALL STRIKE PROBABILITY FOR 2017" (PDF). Colorado State University. Retrieved July 5, 2017.
- ↑ Phillip J. Klotzbach; William M. Gray (August 4, 2017). "FORECAST OF ATLANTIC SEASONAL HURRICANE ACTIVITY AND LANDFALL STRIKE PROBABILITY FOR 2017" (PDF). Colorado State University. Retrieved August 4, 2017.
- ↑ Mark Saunders; Adam Lea (August 4, 2017). August Forecast Update for Atlantic Hurricane Activity in 2017 (PDF) (Report). Tropical Storm Risk.
- 1 2 "Early-season storms one indicator of active Atlantic hurricane season ahead". National Oceanic and Atmospheric Administration. August 9, 2017.
- ↑ Phillip J. Klotzbach (December 14, 2016). "Qualitative Discussion of Atlantic Basin Seasonal Hurricane Activity for 2017" (PDF). Colorado State University. Retrieved December 24, 2016.
- 1 2 "Tropical Cyclone Climatology". National Hurricane Center. Retrieved December 2, 2017.
- 1 2 Phillip J. Klotzbach; Michael M. Bell (November 30, 2017). Summary of 2017 Atlantic Tropical Cyclone Activity and Verification of Authors' Seasonal and Two-Week Forecasts (PDF) (Report). Colorado State University. Retrieved December 2, 2017.
- ↑ Dr. Jeff Masters (November 30, 2017). "Good Riddance to the Brutal Atlantic Hurricane Season of 2017". Weather Underground. Retrieved December 2, 2017.
- ↑ Drye, Willie. "2017 Hurricane Season Was the Most Expensive in U.S. History". National Geographic. Retrieved 5 February 2018.
- ↑ John P. Cangialosi (July 5, 2017). Tropical Cyclone Report: Tropical Storm Arlene (PDF) (Report). Miami, Florida: National Hurricane Center. Retrieved December 2, 2017.
- ↑ Hurricane Specialist Unit (August 1, 2017). Monthly Tropical Weather Summary: July (Report). Miami, Florida: National Hurricane Center. Retrieved December 2, 2017.
- ↑ Hurricane Specialist Unit (September 1, 2017). Monthly Tropical Weather Summary: August (Report). Miami, Florida: National Hurricane Center. Retrieved December 2, 2017.
- ↑ Phillip J. Klotzbach (August 30, 2017). Hurricane Harvey Meteorological Records/Notable Facts Recap (through August 30) (PDF) (Report). Colorado State University. Retrieved December 2, 2017.
- ↑ Costliest U.S. tropical cyclones tables update (PDF) (Report). United States National Hurricane Center. January 12, 2018. Archived (PDF) from the original on January 26, 2018. Retrieved January 12, 2018.
- 1 2 3 Eric S. Blake; David A. Zelinsky (January 23, 2018). Hurricane Harvey (AL092017) (PDF) (Report). Tropical Cyclone Report. National Hurricane Center. Retrieved January 29, 2018.
- 1 2 Hurricane Specialist Unit (October 1, 2017). Monthly Tropical Weather Summary: September (Report). Miami, Florida: National Hurricane Center. Retrieved December 2, 2017.
- ↑ Daniel P. Brown (September 19, 2017). "Hurricane Maria Discussion Number 16". Miami, Florida: National Hurricane Center. Retrieved December 2, 2017.
- ↑ Dr. Jeff Masters (November 22, 2017). "Hurricane Maria Damage Estimate of $102 Billion Surpassed Only by Katrina". Weather Underground. Retrieved December 2, 2017.
- ↑ Eliza Barclay; Alexia Fernández Campbell (November 29, 2017). "New data shows hurricane deaths in Puerto Rico could be 20 times higher than the government claims". Vox. Retrieved December 2, 2017.
- ↑ Hurricane Specialist Unit (November 1, 2017). Monthly Tropical Weather Summary: October (Report). Miami, Florida: National Hurricane Center. Retrieved December 2, 2017.
- ↑ Dr. Jeff Masters (October 14, 2017). "Ophelia Hits Category 3; Destructive Winds On Tap for Ireland". Weather Underground. Retrieved December 2, 2017.
- ↑ Hurricane Specialist Unit (December 1, 2017). Monthly Tropical Weather Summary: November (Report). Miami, Florida: National Hurricane Center. Retrieved December 2, 2017.
- 1 2 Brian McNoldy; Phillip J. Klotzbach; Jason Samenow (November 30, 2017). "The Atlantic hurricane season from hell is finally over". The Washington Post. Retrieved December 2, 2017.
- ↑ Philip Klotzbach [@philklotzbach] (August 1, 2017). "#Emily is post-tropical. 1st 5 Atlantic TCs of 2017 combined for least ACE of 1st 5 TCs for any Atlantic season on record. 1988 old record" (Tweet). Retrieved August 2, 2017 – via Twitter.
- ↑ "Real-Time North Atlantic Ocean Statistics by Storm for 2017". Colorado State University - ACE Calculations. Retrieved September 12, 2017.
- ↑ Philip Klotzbach [@philklotzbach] (26 September 2017). "Irma, Jose & now Maria have all accrued 40+ ACE - 1st time on record with 3 Atlantic TCs each producing 40+ ACE in a single season" (Tweet). Retrieved 14 October 2017 – via Twitter.
- ↑ Brian Donegan; Jonathan Erdman (September 30, 2017). "September 2017 Was the Most Active Month on Record for Atlantic Hurricanes". The Weather Channel. Retrieved October 1, 2017.
- ↑ John P. Cangialosi (July 5, 2017). Tropical Cyclone Report: Tropical Storm Arlene (PDF) (Report). Miami, Florida: National Hurricane Center. pp. 1, 5. Retrieved August 27, 2017.
- ↑ "Tropical Storm Arlene Forms in the Atlantic; No Threat to Land". The Weather Channel. April 20, 2017. Retrieved April 20, 2017.
- ↑ Lixion A. Avila (April 20, 2017). Tropical Storm Arlene Discussion Number 6 (Report). Miami, Florida: National Hurricane Center. Retrieved August 27, 2017.
- ↑ Phillip Klotzbach (April 20, 2017). "The current central pressure of TS #Arlene of 990 mb is the lowest pressure for any April Atlantic TC or subtropical TC on record". Twitter. Retrieved April 21, 2017.
- ↑ Henson, Bob (May 11, 2017). "Adios, Adrian: Earliest Tropical Storm in East Pacific Annals Dissipates". Wunderground. Retrieved May 11, 2017.
- ↑ Eric Blake (June 14, 2017). "NHC Graphical Outlook Archive". Miami, Florida: National Hurricane Center. Retrieved June 14, 2018.
- ↑ Lixion A. Avila (June 16, 2017). "NHC Graphical Outlook Archive". Miami, Florida: National Hurricane Center. Retrieved June 18, 2017.
- ↑ Michael Brennan (June 18, 2017). "Potential Tropical Cyclone Two Discussion Number 1". Miami, Florida: National Hurricane Center. Retrieved June 18, 2017.
- ↑ Chris Landsea (June 19, 2017). "Tropical Storm Bret Discussion Number 5". Miami, Florida: National Hurricane Center. Retrieved June 19, 2017.
- ↑ Lixion A. Avila (June 20, 2017). "Remnants of Bret Advisory Number 9". Miami, Florida: National Hurricane Center. Retrieved June 23, 2017.
- ↑ Phil Klotzbach. "@philklotzbach on twitter: Tropical Storm #Bret has formed – earliest Atlantic MDR (<20°N, E of 70°W) named storm on record - prior record was Ana on 6/22/1979". Twitter. Retrieved 19 June 2017.
- ↑ Phil Klotzbach. "@philklotzbach on twitter: Tropical Storm #Bret's named storm formation latitude of 9.4°N is the lowest latitude June named storm formation since 1933". Twitter. Retrieved 20 June 2017.
- ↑ "Tropical Storm Bret blamed for at least one death". RJR News. June 21, 2017. Retrieved June 21, 2017.
- ↑ Gyasi Gonzales (June 20, 2017). "Man dies after slipping off makeshift bridge*". Daily Express. Retrieved June 22, 2017.
- ↑ Williams, Elizabeth (June 30, 2017). "Man injured when Bret destroyed home has died". Trinidad Express. Retrieved July 1, 2017.
- 1 2 Robbie J. Berg (January 26, 2018). Tropical Cyclone Report: Tropical Storm Cindy (PDF) (Report). National Hurricane Center. Retrieved June 18, 2018.
- ↑ Megnia, Landreneau, Mogged, Erickson, and Brazzell (June 27, 2017). Post Tropical Cyclone Report...Tropical Storm Cindy (Report). National Weather Service Lake Charles, Louisiana. Archived from the original on 2017-06-30. Retrieved June 30, 2017.
- ↑ Evelyn Rivera-Acevedo (June 29, 2017). "Tropical Weather Discussion". Miami, Florida: National Hurricane Center. Retrieved July 5, 2017.
- ↑ Stacy R. Stewart (July 1, 2017). "Graphical Tropical Weather Outlook". Miami, Florida: National Hurricane Center. Retrieved July 5, 2017.
- ↑ John P. Cangialosi (July 3, 2017). "Graphical Tropical Weather Outlook". Miami, Florida: National Hurricane Center. Retrieved July 5, 2017.
- ↑ John P. Cangialosi (July 5, 2017). "Graphical Tropical Weather Outlook". Miami, Florida: National Hurricane Center. Retrieved July 5, 2017.
- ↑ John L. Beven II (July 5, 2017). Tropical Depression Four Discussion Number 1 (Report). Miami, Florida: National Hurricane Center. Retrieved July 5, 2017.
- ↑ Lixion Avila (July 7, 2017). Remnants of Four Discussion Number 8 (Report). Miami, Florida: National Hurricane Center. Retrieved July 7, 2017.
- ↑ Eric S. Blake (July 22, 2017). "Graphical Tropical Weather Outlook". Miami, Florida: National Hurricane Center. Retrieved July 18, 2017.
- ↑ Stacy R. Stewart (July 17, 2017). "Graphical Tropical Weather Outlook". Miami, Florida: National Hurricane Center. Retrieved July 18, 2017.
- 1 2 3 Eric S. Blake (December 19, 2017). Tropical Cyclone Report: Tropical Storm Don (PDF) (Report). Miami, Florida: National Hurricane Center. Retrieved January 14, 2018.
- ↑ Stacy R. Stewart (July 18, 2017). Tropical Storm Don Discussion Number 3 (Report). Miami, Florida: National Hurricane Center. Retrieved July 18, 2017.
- ↑ Daniel P. Brown (July 18, 2017). Tropical Storm Don Discussion Number 4 (Report). Miami, Florida: National Hurricane Center. Retrieved July 18, 2017.
- ↑ Stacy R. Stewart (July 30, 2017). "Graphical Tropical Weather Outlook". Miami, Florida: National Hurricane Center. Retrieved August 6, 2017.
- ↑ Daniel Brown (July 31, 2017). "Tropical Depression Six Discussion Number 1". National Hurricane Center. Retrieved August 2, 2017.
- 1 2 3 4 Richard J. Pasch; Andrew S. Latto; John P. Cangialosi. Tropical Storm Emily (PDF). Tropical Cyclone Report: Tropical Storm Emily (Report). National Hurricane Center. Retrieved April 9, 2018.
- ↑ "Gov. Scott declares a State of Emergency for Tropical Storm Emily". WLTV. July 31, 2017. Retrieved July 31, 2017.
- ↑ Dan Noah (August 1, 2017). Public Information Statement (Report). National Weather Service Tampa, Florida. Archived from the original on August 2, 2017. Retrieved August 1, 2017.
- ↑ "NHC Graphical Outlook Archive". National Hurricane Center. August 3, 2017. Retrieved August 7, 2017.
- 1 2 Richard Pasch (August 6, 2017). "Potential Tropical Cyclone Seven Discussion Number 1". Miami, Florida: National Hurricane Center. Retrieved August 7, 2017.
- ↑ John L. Beven II (March 12, 2018). "Tropical Storm Franklin Tropical Cyclone Report" (PDF). Miami, Florida: National Hurricane Center. Retrieved March 26, 2018.
- ↑ Stacy Stewart (August 8, 2017). "Tropical Storm Franklin Tropical Cyclone Update". National Hurricane Center. Retrieved August 9, 2017.
- ↑ Stacy Stewart (August 8, 2017). "Tropical Storm Franklin Discussion Number 7". Miami, Florida: National Hurricane Center. Retrieved August 9, 2017.
- ↑ Stacy Stewart (August 9, 2017). "Hurricane Franklin Discussion Number 13". Miami, Florida: National Hurricane Center. Retrieved August 9, 2017.
- ↑ Lixion A. Avila (August 9, 2017). "Hurricane Franklin Intermediate Advisory Number 13A". Miami, Florida: National Hurricane Center. Retrieved August 11, 2017.
- ↑ "Hurricane Franklin Intermediate Advisory Number 14A". August 10, 2017. Retrieved August 11, 2017.
- ↑ Richard Pasch (August 10, 2017). "Remnants of Franklin Discussion Number 16". National Hurricane Center. Retrieved August 10, 2017.
- ↑ Eric Blake (August 12, 2017). "Tropical Storm Jova Discussion Number 1". National Hurricane Center. Retrieved August 12, 2017.
- 1 2 Daniel Ortiz (August 8, 2017). "Franklin Faked Out Belize". Belize City, Belize: 7 News Belize. Retrieved August 10, 2017.
- ↑ Ed Adamczyk; Danielle Haynes; Andrew V. Pestano (August 10, 2017). "Hurricane Franklin weakens to tropical storm after hitting Mexico again". UPI. Retrieved August 12, 2017.
- ↑ Eric S. Blake (August 2, 2017). "Graphical Tropical Weather Outlook". Miami, Florida: National Hurricane Center. Retrieved August 13, 2017.
- ↑ John L. Beven II (August 4, 2017). "Graphical Tropical Weather Outlook". Miami, Florida: National Hurricane Center. Retrieved August 13, 2017.
- ↑ John L. Beven II; John P. Cangialosi (August 8, 2017). "Graphical Tropical Weather Outlook". Miami, Florida: National Hurricane Center. Retrieved August 13, 2017.
- ↑ Lixion A. Avila (August 11, 2017). "Graphical Tropical Weather Outlook". Miami, Florida: National Hurricane Center. Retrieved August 13, 2017.
- ↑ Daniel P. Brown (August 13, 2017). Tropical Depression Eight Discussion Number 1 (Report). Miami, Florida: National Hurricane Center. Retrieved August 12, 2017.
- ↑ John P. Cangialosi (August 13, 2017). Tropical Storm Gert Public Advisory Number 4 (Report). Miami, Florida: National Hurricane Center. Retrieved August 13, 2017.
- ↑ Eric S. Blake (August 15, 2017). Hurricane Gert Public Advisory Number 9 (Report). Miami, Florida: National Hurricane Center. Retrieved August 15, 2017.
- ↑ Richard J. Pasch (August 16, 2017). Hurricane Gert Discussion Number 17 (Report). Miami, Florida: National Hurricane Center. Retrieved August 19, 2017.
- ↑ John P. Cangialosi (August 17, 2017). Hurricane Gert Discussion Number 18 (Report). Miami, Florida: National Hurricane Center. Retrieved August 19, 2017.
- ↑ David A. Zelinsky (August 17, 2017). Post-Tropical Cyclone Gert Public Advisory Number 20 (Report). Miami, Florida: National Hurricane Center. Retrieved August 19, 2017.
- ↑ "Man drowns trying to save other swimmer at Outer Banks beach". WFMY. August 15, 2017. Retrieved August 17, 2017.
- ↑ "Police: Man drowns amid dangerous rip currents at Nantucket beach". Boston.com. Associated Press. August 16, 2017. Retrieved August 17, 2017.
- ↑ Linda Lam (August 23, 2017). "Remnants of Hurricane Gert Made It All the Way to Ireland, United Kingdom". The Weather Channel. Retrieved April 8, 2018.
- ↑ Fiachradh McDermott (August 18, 2017). "Weather warnings issued as remains of Hurricane Gert head towards Ireland". The Irish Times. Retrieved April 8, 2018.
- ↑ "Northern Ireland floods: More than 100 people rescued". British Broadcasting Corporation. August 23, 2017. Retrieved April 8, 2018.
- 1 2 Stacy R. Stewart (August 13, 2017). "Graphical Tropical Weather Outlook". Miami, Florida: National Hurricane Center. Retrieved August 20, 2017.
- 1 2 3 Robbie J. Berg (August 15, 2017). "Graphical Tropical Weather Outlook". National Hurricane Center. Miami, Florida: United States Government. Retrieved August 24, 2017.
- 1 2 John L. Beven II (August 17, 2017). Potential Tropical Cyclone Nine Public Advisory Number 1 (Report). Miami, Florida: National Hurricane Center. Retrieved August 20, 2017.
- ↑ Michael J. Brennan (August 17, 2017). "Potential Tropical Cyclone Ten Discussion Number 1". Miami, Florida: National Hurricane Center. Retrieved August 20, 2017.
- ↑ John L. Beven II (August 17, 2017). Tropical Storm Harvey Public Advisory Number 2 (Report). Miami, Florida: National Hurricane Center. Retrieved August 20, 2017.
- ↑ Robbie J. Berg (August 19, 2017). Remnants of Harvey Discussion Number 11 (Report). Miami, Florida: National Hurricane Center. Retrieved August 20, 2017.
- ↑ Eric S. Blake (August 23, 2017). Tropical Depression Harvey Discussion Number 12 (Report). Miami, Florida: National Hurricane Center. Retrieved August 27, 2017.
- ↑ Lixion A. Avila; David A. Zelinsky (August 24, 2017). Tropical Storm Harvey Tropical Cyclone Update (Report). Miami, Florida: National Hurricane Center. Retrieved August 27, 2017.
- 1 2 Eric S. Blake (August 25, 2017). Hurricane Harvey Tropical Cyclone Update (Report). Miami, Florida: National Hurricane Center. Retrieved August 27, 2017.
- ↑ Daniel P. Brown (August 25, 2017). Hurricane Harvey Tropical Cyclone Update (Report). Miami, Florida: National Hurricane Center. Retrieved August 27, 2017.
- ↑ John L. Beven II (August 25, 2017). Hurricane Harvey Public Advisory Number 23 (Report). Miami, Florida: National Hurricane Center. Retrieved August 27, 2017.
- ↑ Lixion A. Avila (August 26, 2017). Hurricane Harvey Intermediate Advisory Number 25A (Report). Miami, Florida: National Hurricane Center. Retrieved August 27, 2017.
- ↑ John L. Beven II (August 28, 2017). Tropical Storm Harvey Intermediate Advisory Number 32A (Report). Miami, Florida: National Hurricane Center. Retrieved September 22, 2017.
- ↑ Robbie J. Berg (August 30, 2017). Tropical Storm Harvey Public Advisory Number 40 (Report). Miami, Florida: National Hurricane Center. Retrieved September 22, 2017.
- ↑ Daniel P. Brown (August 30, 2017). Tropical Depression Harvey Intermediate Advisory Number 42A (Report). Miami, Florida: National Hurricane Center. Retrieved September 22, 2017.
- ↑ Jason Krekeler (September 1, 2017). Post-Tropical Cyclone Harvey Advisory Number 49 (Report). College Park, Maryland: Weather Prediction Center. Retrieved September 22, 2017.
- ↑ Eric Chaney (August 27, 2017). "Harvey Mangles Texas Coast: 'I've Never Seen Anything Like It'". The Weather Channel. Retrieved August 27, 2017.
- ↑ "Harvey Live Updates:Waters Still Rising As Death Toll From Storm Reaches 30". The New York Times. Retrieved 30 August 2017.
- ↑ "Houston hunkers down for Harvey, braces for long storm ahead". Houston Chronicle. August 27, 2017. Retrieved August 27, 2017.
- ↑ "GUYANA: Emergency Situation at Jawalla Village, Region 7". Caribbean Disaster Emergency Management Agency. Caribbean: Caribbean Community. August 22, 2017. Retrieved August 24, 2017.
- ↑ Roth, David M. (October 18, 2017). "Tropical Cyclone Point Maxima". Tropical Cyclone Rainfall Data. United States Weather Prediction Center. Retrieved November 26, 2017.
- ↑ Phillip Klotzbach (August 25, 2017). "The record long US major (Cat.3+) hurricane landfall drought of 4323 days has come to an end with the landfall of Cat 4 Hurricane #Harvey". Twitter. Retrieved August 27, 2017.
- ↑ Brian Thevenot (August 24, 2017). "Harvey barrels into Texas as Category 4 hurricane". Reuters. Retrieved August 27, 2017.
- ↑ Eric S. Blake (August 26, 2017). "Graphical Tropical Weather Outlook". Miami, Florida: National Hurricane Center. Retrieved September 21, 2017.
- ↑ Eric S. Blake (August 30, 2017). Tropical Storm Irma Public Advisory Number 1 (Report). Miami, Florida: National Hurricane Center. Retrieved September 21, 2017.
- ↑ Richard J. Pasch (August 31, 2017). "Tropical Storm Irma Discussion Number 4". Miami, Florida: National Hurricane Center. Retrieved July 4, 2018.
- ↑ Eric S. Blake (August 31, 2017). "Hurricane Irma Discussion Number 5". Miami, Florida: National Hurricane Center. Retrieved July 4, 2018.
- ↑ Eric S. Blake (August 31, 2017). "Hurricane Irma Discussion Number 4". Miami, Florida: National Hurricane Center. Retrieved July 4, 2018.
- ↑ Eric S. Blake (September 1, 2017). "Hurricane Irma Discussion Number 10". Miami, Florida: National Hurricane Center. Retrieved July 4, 2018.
- ↑ Eric S. Blake (September 4, 2017). "Hurricane Irma Discussion Number 22". Miami, Florida: National Hurricane Center. Retrieved July 4, 2018.
- 1 2 John P. Cangialosi; Andrew S. Latto; Robbie Berg (March 9, 2018). Hurricane Irma Tropical Cyclone Report (PDF) (Report). Miami, Florida: National Hurricane Center. Retrieved March 12, 2018.
- ↑ Daniel P. Brown (September 5, 2017). Hurricane Irma Discussion Number 26 (Report). Miami, Florida: National Hurricane Center. Retrieved September 21, 2017.
- ↑ John L. Beven II (September 6, 2017). Hurricane Irma Intermediate Advisory Number 28A (Report). Miami, Florida: National Hurricane Center. Retrieved September 21, 2017.
- ↑ Lixion A. Avila (September 8, 2017). Hurricane Irma Intermediate Advisory Number 37A (Report). Miami, Florida: National Hurricane Center. Retrieved September 21, 2017.
- ↑ Robbie J. Berg (September 8, 2017). Hurricane Irma Public Advisory Number 40 (Report). Miami, Florida: National Hurricane Center. Retrieved September 21, 2017.
- ↑ Robbie J. Berg (September 9, 2017). Hurricane Irma Intermediate Advisory Number 43A (Report). Miami, Florida: National Hurricane Center. Retrieved September 22, 2017.
- ↑ Christopher W. Landsea; Christopher Mello (September 10, 2017). Hurricane Irma Tropical Cyclone Update (Report). Miami, Florida: National Hurricane Center. Retrieved September 22, 2017.
- ↑ Christopher W. Landsea; Matthew Onderlinde (September 10, 2017). Hurricane Irma Tropical Cyclone Update (Report). Miami, Florida: National Hurricane Center. Retrieved September 22, 2017.
- ↑ Jennifer Tate (September 12, 2017). Post-Tropical Cyclone Irma Advisory Number 53 (Report). College Park, Maryland: Weather Prediction Center. Retrieved September 22, 2017.
- ↑ "Hurricane IRMA". www.nhc.noaa.gov. Retrieved 2018-10-13.
- ↑ Phillip J. Klotzbach (September 2017). Hurricane Irma Meteorological Records/Notable Facts Recap (PDF) (Report). Colorado State University. Retrieved September 22, 2017.
- ↑ "Irma's destruction: island by island". The Guardian. The Guardian. Retrieved 7 September 2017.
- ↑ "Year in Search: 2017". trends.google.com. Mountain View, California: Google. January 1, 2018. Retrieved July 4, 2018.
- ↑ Eric S. Blake (August 31, 2017). Graphical Tropical Weather Outlook (Report). Miami, Florida: National Hurricane Center. Retrieved September 22, 2017.
- ↑ Christopher W. Landsea (September 5, 2017). Tropical Storm Jose Public Advisory Number 1 (Report). Miami, Florida: National Hurricane Center. Retrieved September 22, 2017.
- ↑ David A. Zelinsky (September 6, 2017). Hurricane Jose Public Advisory Number 6 (Report). Miami, Florida: National Hurricane Center. Retrieved September 22, 2017.
- ↑ Alex Lamers; Greg Carbin (September 7, 2017). Hurricane Jose Public Advisory Number 10 (Report). College Park, Maryland: Weather Prediction Center. Retrieved September 22, 2017.
- ↑ John P. Cangialosi (September 8, 2017). Hurricane Jose Public Advisory Number 15 (Report). Miami, Florida: National Hurricane Center. Retrieved September 22, 2017.
- ↑ Robbie J. Berg (September 12, 2017). Hurricane Jose Discussion Number 31 (Report). Miami, Florida: National Hurricane Center. Retrieved September 22, 2017.
- ↑ David A. Zelinsky (September 21, 2017). Tropical Storm Jose Discussion Number 64 (Report). Miami, Florida: National Hurricane Center. Retrieved September 22, 2017.
- ↑ David A. Zelinsky (September 21, 2017). Post-Tropical Cyclone Jose Discussion Number 67 (Report). Miami, Florida: National Hurricane Center. Retrieved September 22, 2017.
- ↑ Eric S. Blake (September 22, 2017). "Post-Tropical Cyclone JOSE". National Hurricane Center. Retrieved 2017-09-23.
- ↑ "Barbuda is trying to totally evacuate today ahead of Hurricane Jose after Hurricane Irma 'demolished' 90% of the island". Business Insider. September 8, 2017.
- ↑ Levenson, Eric (9 September 2017). "Hurricane Jose strengthens to 'extremely dangerous' Category 4". CNN. Retrieved 9 September 2017.
- ↑ Dave Roberts (September 3, 2017). Tropical Weather Outlook (TXT) (Report). National Hurricane Center. Retrieved September 7, 2017.
- ↑ Christopher Landsea (September 5, 2017). Tropical Weather Outlook (TXT) (Report). National Hurricane Center. Retrieved September 7, 2017.
- ↑ Eric Blake (September 5, 2017). Tropical Depression Thirteen Discussion Number 1 (Report). National Hurricane Center. Retrieved September 7, 2017.
- ↑ Dave Roberts (September 6, 2017). Tropical Storm Katia Discussion Number 3 (Report). National Hurricane Center. Retrieved September 7, 2017.
- ↑ Lixion Avila (September 6, 2017). Hurricane Katia Discussion Number 5 (Report). National Hurricane Center. Retrieved September 7, 2017.
- ↑ Eric Blake (September 7, 2017). Hurricane Katia Discussion Number 6 (Report). National Hurricane Center. Retrieved September 7, 2017.
- ↑ (now), Claire Phipps; Yuhas, Alan; (earlier), Matthew Weaver (9 September 2017). "Cuba lashed by Category five winds as storm heads to US – as it happened" – via The Guardian.
- ↑ "Tropical Depression FIFTEEN-E Advisory #1". www.nhc.noaa.gov.
- ↑ Christopher Sherman (September 9, 2017). "México: 65 muertos por sismo, dos por huracán Katia" (in Spanish). El Nuevo Herald. Archived from the original on September 15, 2017. Retrieved September 15, 2017.
- ↑ "El huracán Katia toca tierra en las costas de México" (in Spanish). El Nuevo Herald. September 9, 2017. Archived from the original on September 15, 2017. Retrieved September 15, 2017.
- ↑ "Katia leaves 3 dead and minimal damage". Mexico News Daily. September 11, 2017. Retrieved September 15, 2017.
- ↑ "El huracán Katia causa deslaves que dejan dos muertos en Veracruz, México" (in Spanish). BBC. September 9, 2017. Retrieved September 15, 2017.
- ↑ Blake, Eric (September 14, 2017). "Graphical Tropical Weather Outlook". National Hurricane Center. Retrieved September 15, 2017.
- ↑ Brown, Michael. "Tropical Depression Fourteen Discussion Number 1". National Hurricane Center. Retrieved September 15, 2017.
- ↑ Berg, Robbie. "Tropical Storm Lee Discussion Number 7". National Hurricane Center. Retrieved September 16, 2017.
- ↑ Blake, Eric (February 13, 2018). Tropical Cyclone Report: Hurricane Lee (PDF) (Report). National Hurricane Center. p. 3. AL182017. Retrieved February 4, 2018.
- ↑ Stacy R. Stewart (September 19, 2017). Graphical Tropical Weather Outlook (Report). Miami, Florida: National Hurricane Center. Retrieved September 22, 2017.
- ↑ Robbie J. Berg; Eric S. Blake (September 22, 2017). Graphical Tropical Weather Outlook (Report). Miami, Florida: National Hurricane Center. Retrieved September 22, 2017.
- ↑ Eric S. Blake (September 22, 2017). Tropical Depression Lee Discussion Number 18 (Report). Miami, Florida: National Hurricane Center. Retrieved September 22, 2017.
- ↑ David A. Zelinsky (September 22, 2017). Tropical Storm Lee Public Advisory Number 19 (Report). Miami, Florida: National Hurricane Center. Retrieved October 1, 2017.
- ↑ Stacy R. Stewart (September 23, 2017). Tropical Storm Lee Discussion Number 22 (Report). Miami, Florida: National Hurricane Center. Retrieved October 1, 2017.
- ↑ David A. Zelinsky (September 23, 2017). Tropical Storm Lee Discussion Number 23 (Report). Miami, Florida: National Hurricane Center. Retrieved October 1, 2017.
- ↑ John L. Beven II (September 24, 2017). Hurricane Lee Special Discussion Number 24 (Report). Miami, Florida: National Hurricane Center. Retrieved October 1, 2017.
- ↑ Stacy R. Stewart (September 25, 2017). Hurricane Lee Discussion Number 31 (Report). Miami, Florida: National Hurricane Center. Retrieved October 1, 2017.
- ↑ David P. Roberts (September 26, 2017). Hurricane Lee Public Advisory Number 33 (Report). Miami, Florida: National Hurricane Center. Retrieved October 1, 2017.
- ↑ Eric S. Blake (September 27, 2017). Hurricane Lee Discussion Number 38 (Report). Miami, Florida: National Hurricane Center. Retrieved October 1, 2017.
- ↑ David P. Roberts (September 28, 2017). Hurricane Lee Discussion Number 44 (Report). Miami, Florida: National Hurricane Center. Retrieved October 1, 2017.
- ↑ John P. Cangialosi (September 27, 2017). Hurricane Lee Public Advisory Number 40 (Report). Miami, Florida: National Hurricane Center. Retrieved October 1, 2017.
- ↑ David A. Zelinsky (September 29, 2017). Tropical Storm Lee Public Advisory Number 46 (Report). Miami, Florida: National Hurricane Center. Retrieved October 1, 2017.
- ↑ Robbie J. Berg (September 30, 2017). Post-Tropical Cyclone Lee Discussion Number 49 (Report). Miami, Florida: National Hurricane Center. Retrieved October 1, 2017.
- ↑ "Europe Weather Analysis on 2017-10-01". FU-Berlin.de. Retrieved 17 November 2017.
- ↑ Michael J. Brennan (September 13, 2017). "Graphical Tropical Weather Outlook". Miami, Florida: National Hurricane Center. Retrieved September 30, 2017.
- ↑ John P. Cangialosi (September 16, 2017). Potential Tropical Cyclone Fifteen Public Advisory Number 1 (Report). Miami, Florida: National Hurricane Center. Retrieved September 30, 2017.
- ↑ John P. Cangialosi (September 16, 2017). Tropical Storm Maria Public Advisory Number 2 (Report). Miami, Florida: National Hurricane Center. Retrieved September 30, 2017.
- ↑ Daniel P. Brown; Eric S. Blake (September 18, 2017). Hurricane Maria Tropical Cyclone Update (Report). Miami, Florida: National Hurricane Center. Retrieved September 30, 2017.
- ↑ RA IV Hurricane Committee (April 13, 2018). "Summary of the Previous Hurricane Season". Fort-de-France, Martinique: World Meteorological Organization. Retrieved July 3, 2018.
- ↑ Daniel P. Brown (September 18, 2017). Hurricane Maria Tropical Cyclone Update (Report). Miami, Florida: National Hurricane Center. Retrieved September 30, 2017.
- ↑ Daniel P. Brown (September 19, 2017). Hurricane Maria Tropical Cyclone Update (Report). Miami, Florida: National Hurricane Center. Retrieved September 30, 2017.
- ↑ Eric S. Blake (September 20, 2017). Hurricane Maria Tropical Cyclone Update (Report). Miami, Florida: National Hurricane Center. Retrieved September 30, 2017.
- ↑ Robbie J. Berg (September 20, 2017). Hurricane Maria Tropical Cyclone Update (Report). Miami, Florida: National Hurricane Center. Retrieved September 30, 2017.
- ↑ Robbie J. Berg (September 20, 2017). Hurricane Maria Public Advisory Number 19 (Report). Miami, Florida: National Hurricane Center. Retrieved September 30, 2017.
- ↑ Richard J. Pasch (September 21, 2017). Hurricane Maria Discussion Number 21 (Report). Miami, Florida: National Hurricane Center. Retrieved September 30, 2017.
- ↑ Richard J. Pasch (September 27, 2017). Hurricane Maria Discussion Number 46 (Report). Miami, Florida: National Hurricane Center. Retrieved September 30, 2017.
- ↑ Stacy R. Stewart (September 28, 2017). Hurricane Maria Public Advisory Number 50 (Report). Miami, Florida: National Hurricane Center. Retrieved September 30, 2017.
- ↑ David A. Zelinsky (September 30, 2017). Post-Tropical Cyclone Maria Public Advisory Number 58 (Report). Miami, Florida: National Hurricane Center. Retrieved September 30, 2017.
- ↑ Loan, Joyce (October 2, 2017). "Appeal to raise $31 million to ease 'huge challenges' for Dominica". WIC News. Retrieved 3 October 2017.
- ↑ "Puerto Rico governor raises hurricane's official death toll to 34, damage tab to $90 billion". Japan Times. October 4, 2017. Retrieved October 4, 2017.
- ↑ "ASCERTAINMENT OF THE ESTIMATED EXCESS MORTALITY FROM HURRICANE MARÍA IN PUERTO RICO" (PDF). Milken Institute of Public Health. August 28, 2018. Retrieved August 28, 2018.
- ↑ Neely, Wayne (2016-12-19). The Greatest and Deadliest Hurricanes of the Caribbean and the Americas: The Stories Behind the Great Storms of the North Atlantic. iUniverse. p. 375. ISBN 978-1-5320-1151-1. Retrieved 9 August 2018.
- ↑ Sean Breslin (August 9, 2018). "Puerto Rican Government Admits Hurricane Maria Death Toll Was at Least 1,400". The Weather Company. Retrieved August 9, 2018.
- ↑ Cangialosi, John P. (October 3, 2017). "Two-Day Graphical Tropical Weather Outlook". National Hurricane Center. Miami, Florida: United States Government. Retrieved October 4, 2017.
- ↑ Eric S. Blake (October 4, 2017). Tropical Depression Sixteen Discussion Number 1 (Report). Miami, Florida: National Hurricane Center. Retrieved October 5, 2017.
- ↑ John L. Beven II (October 5, 2017). Tropical Storm Nate Intermediate Advisory Number 4A (Report). Miami, Florida: National Hurricane Center. Retrieved October 5, 2017.
- ↑ Lixion A. Avila (October 7, 2017). "Hurricane Nate Intermediate Advisory Number 11A". Miami, Florida: National Hurricane Center. Retrieved July 4, 2018.
- ↑ Robbie J. Berg (October 7, 2017). "Hurricane Nate Intermediate Advisory Number 14A". Miami, Florida: National Hurricane Center. Retrieved July 4, 2018.
- ↑ Manuel Torres (October 7, 2017). "Hurricane Nate sets record as fastest moving storm in Gulf of Mexico". NOLA.com. Retrieved October 10, 2017.
- ↑ "The Latest: Costa Rica raises death toll from Nate to 8". ABC News. The Associated Press. October 5, 2017. Archived from the original on October 5, 2017. Retrieved October 5, 2017.
- ↑ European Commission's Directorate-General for European Civil Protection and Humanitarian Aid Operations (November 8, 2017). La Unión Europea destina 68 millones de colones en ayuda humanitaria para los afectados por la tormenta Nate en Costa Rica (Report) (in Spanish). ReliefWeb. Retrieved April 21, 2018.
- 1 2 3 "Al menos 23 muertos y 27 desaparecidos en Centroamérica tras el paso de Nate". El Mundo (in Spanish). EFE. October 6, 2017. Retrieved October 6, 2017.
- ↑ "1 Killed In Single Vehicle Crash On Interstate 24". News Channel 5. October 8, 2017. Retrieved October 10, 2017.
- ↑ "Firefighter killed in western NC while responding to Nate storm damage". WRAL. October 9, 2017. Retrieved October 10, 2017.
- ↑ Government of Costa Rica (January 18, 2018). 309 mil millones de colones para la reconstrucción convierten a Nate en el mayor desastre de origen natural de la historia en Costa Rica (Report) (in Spanish). ReliefWeb. Retrieved April 13, 2018.
- ↑ "Two-Day Graphical Tropical Weather Outlook". National Hurricane Center. October 6, 2017. Retrieved October 9, 2017.
- ↑ "Two-Day Graphical Tropical Weather Outlook". National Hurricane Center. October 7, 2017. Retrieved October 9, 2017.
- ↑ "Two-Day Graphical Tropical Weather Outlook". National Hurricane Center. October 8, 2017. Retrieved October 9, 2017.
- ↑ Cangialosi, John (October 9, 2017). "Tropical Depression Seventeen Advisory Number 1". National Hurricane Center. Retrieved October 13, 2017.
- ↑ Cangialosi, John (October 9, 2017). "Tropical Depression Seventeen Discussion Number 1". National Hurricane Center. Retrieved October 13, 2017.
- ↑ Stewart, Stacy (October 9, 2017). "Tropical Storm Ophelia Discussion Number 2". National Hurricane Center. Retrieved October 13, 2017.
- ↑ Zelinsky, David (October 11, 2017). "Hurricane Ophelia Discussion Number 11". National Hurricane Center. Retrieved October 13, 2017.
- ↑ Freedman, Andrew (12 October 2017). "Hurricane Ophelia reaches Category 2 intensity, to make rare run at Ireland and UK". Mashable. Archived from the original on 2017-10-13. Retrieved 12 October 2017.
- ↑ Philip Klotzbach [@philklotzbach] (14 October 2017). "Ophelia is now a major hurricane - the farthest east (26.6°W) an Atlantic major hurricane has existed on record" (Tweet). Retrieved 14 October 2017 – via Twitter.
- ↑ "Hurricane Ophelia: Woman killed as tree hits car". BBC News. 2017-10-16.
- ↑ News, Today FM (16 Oct 2017). "Second fatality from Ophelia". @TodayFMNews. Retrieved 2017-10-16.
- ↑ Feeney, Oisin. "BREAKING: Man passes away after car hit by tree in Dundalk | Buzz.ie". Buzz.ie. Retrieved 2017-10-16.
- ↑ "Storm Ophelia aftermath: Two men killed while repairing damage at home named locally - Independent.ie". Independent.ie. Retrieved 2017-10-25.
- ↑ "Tropical Weather Outlook (October 22, 2017. 2:00 PM EDT)". National Hurricane Center.
- ↑ "Tropical Weather Outlook (October 23, 2017. 8:00 PM EDT)". National Hurricane Center.
- ↑ "Tropical Weather Outlook (October 26, 2017. 2:00 PM EDT)". National Hurricane Center.
- 1 2 Lixion A. Avila (November 28, 2017). Tropical Cyclone Report: Tropical Storm Philippe (PDF) (Report). Miami, Florida: National Hurricane Center. Retrieved February 2, 2018.
- ↑ Brown, Daniel (January 31, 2018). Tropical Cyclone Report: Tropical Storm Philippe (PDF) (Report). National Hurricane Center. p. 3. AL182017. Archived (PDF) from the original on February 3, 2018. Retrieved February 4, 2018.
- ↑ "Tropical Depression Nineteen Discussion Number 1". www.nhc.NOAA.gov. Retrieved 17 November 2017.
- ↑ John P. Cangialosi (January 9, 2018). Tropical Cyclone Report: Tropical Storm Rina (PDF) (Report). Miami, Florida: National Hurricane Center. Retrieved August 28, 2018.
- ↑ "Tropical Storm RINA". www.nhc.NOAA.gov. Retrieved 17 November 2017.
- ↑ "Tropical Weather Outlook (August 27, 2017. 8:00 PM EDT)". National Hurricane Center.
- ↑ Blake, Eric S. (August 29, 2017). "Two-Day Graphical Tropical Weather Outlook". National Hurricane Center. Miami, Florida: United States Government. Retrieved September 17, 2017.
- ↑ Berg, Robbie J. (August 29, 2017). "Potential Tropical Cyclone Ten Discussion Number 9". National Hurricane Center. Miami, Florida: United States Government. Retrieved September 17, 2017.
- ↑ Berg, Robbie. "Potential Tropical Cyclone TEN Discussion Number 9". www.nhc.noaa.gov.
- ↑ Service, NOAA's National Weather. "WPC Surface Analysis Archive". www.wpc.ncep.noaa.gov.
- ↑ http://www.met.fu-berlin.de/de/wetter/maps/Prognose_20170903.gif
- ↑ http://www.met.fu-berlin.de/de/wetter/maps/Analyse_20170904.gif
- ↑ "Tropical Cyclone Names#Atlantic". National Hurricane Center. Retrieved December 24, 2016.
- ↑ Erik Ortiz (July 18, 2017). "Tropical Storm Don Develops in Atlantic, but Its Name Is Not a Political Jab". NBC News. Retrieved July 19, 2017.
- ↑ "Tropical Storms 'Don' And 'Hilary' Bring Out Political Jokes On Twitter". WBZ-TV. July 19, 2017. Retrieved July 19, 2017.
- ↑ Feltgen, Dennis (April 12, 2018). "Harvey, Irma, Maria and Nate retired by the World Meteorological Organization". National Oceanic and Atmospheric Administration. Archived from the original on April 13, 2018. Retrieved April 13, 2018.
- ↑ "Harvey, Irma, Maria and Nate Retired Following Devastating 2017 Atlantic Hurricane Season | The Weather Channel". The Weather Channel. Retrieved 2018-09-21.
External links
| Wikimedia Commons has media related to 2017 Atlantic hurricane season. |