Accumulated cyclone energy
Accumulated cyclone energy (ACE) is a measure used by various agencies including the National Oceanic and Atmospheric Administration (NOAA) and the India Meteorological Department to express the activity of individual tropical cyclones and entire tropical cyclone seasons. It uses an approximation of the wind energy used by a tropical system over its lifetime and is calculated every six hours. The ACE of a season is the sum of the ACEs for each storm and takes into account the number, strength, and duration of all the tropical storms in the season. The highest ACE calculated for a single storm is 82, for Hurricane/Typhoon Ioke in 2006.[1]
Calculation
The ACE of a season is calculated by summing the squares of the estimated maximum sustained velocity of every active tropical storm (wind speed 35 knots [65 km/h, 40 mph] or higher), at six-hour intervals. Since the calculation is sensitive to the starting point of the six-hour intervals, the convention is to use 00:00, 06:00, 12:00, and 18:00 UTC. If any storms of a season happen to cross years, the storm's ACE counts for the previous year.[2] The numbers are usually divided by 10,000 to make them more manageable. One unit of ACE equals 104 kn2, and for use as an index the unit is assumed. Thus:

where vmax is estimated sustained wind speed in knots.
Kinetic energy is proportional to the square of velocity, and by adding together the energy per some interval of time, the accumulated energy is found. As the duration of a storm increases, more values are summed and the ACE also increases such that longer-duration storms may accumulate a larger ACE than more-powerful storms of lesser duration. Although ACE is a value proportional to the energy of the system, it is not a direct calculation of energy (the mass of the moved air and therefore the size of the storm would show up in a real energy calculation).
A related quantity is hurricane destruction potential (HDP), which is ACE but only calculated for the time where the system is a hurricane.[3]
Atlantic basin ACE
Categories
A season's ACE is used by NOAA and others to categorize the hurricane season into 3 groups by its activity.[4] Measured over the period 1951–2000 for the Atlantic basin, the median annual index was 87.5 and the mean annual index was 93.2. The NOAA categorization system divides seasons into:
- Above-normal season: An ACE value above 111 (120% of the 1981–2010 median), provided at least two of the following three parameters are also exceeded: number of tropical storms: 12, hurricanes: 6, and major hurricanes: 2.
- Near-normal season: neither above-normal nor below normal
- Below-normal season: An ACE value below 66 (71.4% of the 1981–2010 median), or none of the following three parameters are exceeded: number of tropical storms: 9, hurricanes: 4, and major hurricanes: 1.
According to the NOAA categorization system for the Atlantic, the most recent above-normal season is the 2018 season, the most recent near-normal season is the 2014 season, and the most recent below normal season is the 2015 season.
Hyperactivity
The term hyperactive is used by Goldenberg et al. (2001)[5] based on a different weighting algorithm[6], which places more weight on major hurricanes, but typically equating to an ACE of about 153 (175% of the 1951–2000 median) or more.
Individual storms in the Atlantic
The highest ever ACE estimated for a single storm in the Atlantic is 73.6, for the San Ciriaco hurricane in 1899. This single storm had an ACE higher than many whole Atlantic storm seasons. Other Atlantic storms with high ACEs include Hurricane Ivan in 2004, with an ACE of 70.4, Hurricane Irma in 2017, with an ACE of 64.9, the Great Charleston Hurricane in 1893, with an ACE of 63.5, Hurricane Isabel in 2003, with an ACE of 63.3, and the 1932 Cuba hurricane, with an ACE of 59.8.[7]
Since 1950, the highest ACE of a tropical storm was Tropical Storm Laura in 1971, which attained an ACE of 8.6. The highest ACE of a Category 1 hurricane was Hurricane Nadine in 2012, which attained an ACE of 26.3. The lowest ACE of a tropical storm was 2000's Tropical Storm Chris and 2017's Tropical Storm Philippe, both of which were tropical storms for only six hours and had an ACE of just 0.1. The lowest ACE of any hurricane was 2005's Hurricane Cindy, which was only a hurricane for six hours, and 2007's Hurricane Lorenzo, which was a hurricane for twelve hours; both of which had an ACE of just 1.5. The lowest ACE of a major hurricane (Category 3 or higher), was Hurricane Gerda in 1969, with an ACE of 5.3.[8] The only years since 1950 to feature two storms with an ACE index of over 40 points have been 1966, 2003, and 2004, and the only year to feature three storms is 2017.[9]
The following table shows those storms in the Atlantic basin from 1950–2017 that have attained over 40 points of ACE.[8]
| Storm | Year | Peak classification | ACE | Duration |
|---|---|---|---|---|
| Hurricane Ivan | 2004 | 70.4 | 23 days | |
| Hurricane Irma | 2017 | 64.9 | 13 days | |
| Hurricane Isabel | 2003 | 63.3 | 14 days | |
| Hurricane Donna | 1960 | 57.6 | 16 days | |
| Hurricane Carrie | 1957 | 55.8 | 21 days | |
| Hurricane Inez | 1966 | 54.6 | 21 days | |
| Hurricane Luis | 1995 | 53.5 | 16 days | |
| Hurricane Allen | 1980 | 52.3 | 12 days | |
| Hurricane Esther | 1961 | 52.2 | 18 days | |
| Hurricane Matthew | 2016 | 50.9 | 12 days | |
| Hurricane Flora | 1963 | 49.4 | 16 days | |
| Hurricane Edouard | 1996 | 49.3 | 14 days | |
| Hurricane Beulah | 1967 | 47.9 | 17 days | |
| Hurricane Dog | 1950 | 47.5 | 13 days | |
| Hurricane Betsy | 1965 | 47.0 | 18 days | |
| Hurricane Frances | 2004 | 45.9 | 15 days | |
| Hurricane Faith | 1966 | 45.4 | 17 days | |
| Hurricane Maria | 2017 | 44.8 | 14 days | |
| Hurricane Ginger | 1971 | 44.2 | 28 days | |
| Hurricane David | 1979 | 44.0 | 12 days | |
| Hurricane Jose | 2017 | 43.3 | 17 days | |
| Hurricane Fabian | 2003 | 43.2 | 14 days | |
| Hurricane Hugo | 1989 | 42.7 | 12 days | |
| Hurricane Gert | 1999 | 42.3 | 12 days | |
| Hurricane Igor | 2010 | 41.9 | 14 days | |
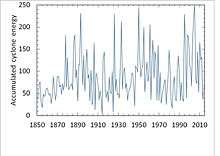
Atlantic hurricane seasons, 1851–2018
ACE data for the Atlantic hurricane season is less reliable prior to the modern satellite era, but NOAA has analyzed the best available information dating back to 1851. The 1933 Atlantic hurricane season is considered the highest ACE on record with a total of 259.[10] For the current season or the season that just ended, the ACE is preliminary based on National Hurricane Center bulletins, which may later be revised.
| Season | ACE | TS | HU | MH | Classification |
|---|---|---|---|---|---|
| 1851 | 36.24 | 6 | 3 | 1 | Below normal |
| 1852 | 73.28 | 5 | 5 | 1 | Near normal |
| 1853 | 76.49 | 8 | 4 | 2 | Near normal |
| 1854 | 31.00 | 5 | 3 | 1 | Below normal |
| 1855 | 18.12 | 5 | 4 | 1 | Below normal |
| 1856 | 48.94 | 6 | 4 | 2 | Below normal |
| 1857 | 46.84 | 4 | 3 | 0 | Below normal |
| 1858 | 44.79 | 6 | 6 | 0 | Below normal |
| 1859 | 55.73 | 8 | 7 | 1 | Below normal |
| 1860 | 62.06 | 7 | 6 | 1 | Below normal |
| 1861 | 49.71 | 8 | 6 | 0 | Below normal |
| 1862 | 46.03 | 6 | 3 | 0 | Below normal |
| 1863 | 50.35 | 9 | 5 | 0 | Below normal |
| 1864 | 26.55 | 5 | 3 | 0 | Below normal |
| 1865 | 49.13 | 7 | 3 | 0 | Below normal |
| 1866 | 83.65 | 7 | 6 | 1 | Near normal |
| 1867 | 59.97 | 9 | 7 | 1 | Below normal |
| 1868 | 34.65 | 4 | 3 | 0 | Below normal |
| 1869 | 51.02 | 10 | 7 | 1 | Below normal |
| 1870 | 87.8 | 11 | 10 | 2 | Near normal |
| 1871 | 88.39 | 8 | 6 | 2 | Near normal |
| 1872 | 65.38 | 5 | 4 | 0 | Below normal |
| 1873 | 69.47 | 5 | 3 | 2 | Near normal |
| 1874 | 47.05 | 7 | 4 | 0 | Below normal |
| 1875 | 72.48 | 6 | 5 | 1 | Near normal |
| 1876 | 56.05 | 5 | 4 | 2 | Below normal |
| 1877 | 73.36 | 8 | 3 | 1 | Below normal |
| 1878 | 180.85 | 12 | 10 | 2 | Hyperactive |
| 1879 | 63.63 | 8 | 6 | 2 | Below normal |
| 1880 | 131.08 | 11 | 9 | 2 | Near normal |
| 1881 | 59.25 | 7 | 4 | 0 | Below normal |
| 1882 | 59.4675 | 6 | 4 | 2 | Below normal |
| 1883 | 66.7 | 4 | 3 | 2 | Near normal |
| 1884 | 72.06 | 4 | 4 | 1 | Below normal |
| 1885 | 58.3 | 8 | 6 | 0 | Below normal |
| 1886 | 166.165 | 12 | 10 | 4 | Hyperactive |
| 1887 | 181.26 | 19 | 11 | 2 | Hyperactive |
| 1888 | 84.945 | 9 | 6 | 2 | Near normal |
| 1889 | 104.0425 | 9 | 6 | 0 | Near normal |
| 1890 | 33.345 | 4 | 2 | 1 | Below normal |
| 1891 | 116.105 | 10 | 7 | 1 | Near normal |
| 1892 | 115.8375 | 9 | 5 | 0 | Near normal |
| 1893 | 231.1475 | 12 | 10 | 5 | Hyperactive |
| 1894 | 135.42 | 7 | 5 | 4 | Near normal |
| 1895 | 68.765 | 6 | 2 | 0 | Below normal |
| 1896 | 136.0825 | 7 | 6 | 2 | Near normal |
| 1897 | 54.54 | 6 | 3 | 0 | Below normal |
| 1898 | 113.2375 | 11 | 5 | 1 | Near normal |
| 1899 | 151.025 | 10 | 5 | 2 | Near normal |
| 1900 | 83.345 | 7 | 3 | 2 | Near normal |
| 1901 | 98.975 | 13 | 6 | 0 | Near normal |
| 1902 | 32.65 | 5 | 3 | 0 | Below normal |
| 1903 | 102.07 | 10 | 7 | 1 | Near normal |
| 1904 | 30.345 | 6 | 4 | 0 | Below normal |
| 1905 | 28.3775 | 5 | 1 | 1 | Below normal |
| 1906 | 162.88 | 11 | 6 | 3 | Near normal |
| 1907 | 13.06 | 5 | 0 | 0 | Below normal |
| 1908 | 95.11 | 10 | 6 | 1 | Near normal |
| 1909 | 93.34 | 12 | 6 | 4 | Near normal |
| 1910 | 63.9 | 5 | 3 | 1 | Below normal |
| 1911 | 34.2875 | 6 | 3 | 0 | Below normal |
| 1912 | 57.2625 | 7 | 4 | 1 | Below normal |
| 1913 | 35.595 | 6 | 4 | 0 | Below normal |
| 1914 | 2.53 | 1 | 0 | 0 | Below normal |
| 1915 | 130.095 | 6 | 5 | 3 | Near normal |
| 1916 | 144.0125 | 15 | 10 | 5 | Above normal |
| 1917 | 60.6675 | 4 | 2 | 2 | Below normal |
| 1918 | 39.8725 | 6 | 4 | 1 | Below normal |
| 1919 | 55.04 | 5 | 2 | 1 | Below normal |
| 1920 | 29.81 | 5 | 4 | 0 | Below normal |
| 1921 | 86.53 | 7 | 5 | 2 | Near normal |
| 1922 | 54.515 | 5 | 3 | 1 | Below normal |
| 1923 | 49.31 | 9 | 4 | 1 | Below normal |
| 1924 | 100.1875 | 11 | 5 | 2 | Near normal |
| 1925 | 7.2525 | 4 | 1 | 0 | Below normal |
| 1926 | 229.5575 | 11 | 8 | 6 | Hyperactive |
| 1927 | 56.4775 | 8 | 4 | 1 | Below normal |
| 1928 | 83.475 | 6 | 4 | 1 | Below normal |
| 1929 | 48.0675 | 5 | 3 | 1 | Below normal |
| 1930 | 49.7725 | 3 | 2 | 2 | Below normal |
| 1931 | 47.835 | 13 | 3 | 1 | Below normal |
| 1932 | 169.6625 | 15 | 6 | 4 | Hyperactive |
| 1933 | 258.57 | 20 | 11 | 6 | Hyperactive |
| 1934 | 79.0675 | 13 | 7 | 1 | Near normal |
| 1935 | 106.2125 | 8 | 5 | 3 | Near normal |
| 1936 | 99.775 | 17 | 7 | 1 | Near normal |
| 1937 | 65.85 | 11 | 4 | 1 | Near normal |
| 1938 | 77.575 | 9 | 4 | 2 | Near normal |
| 1939 | 43.6825 | 6 | 3 | 1 | Below normal |
| 1940 | 67.79 | 9 | 6 | 0 | Near normal |
| 1941 | 51.765 | 6 | 4 | 3 | Below normal |
| 1942 | 62.485 | 11 | 4 | 1 | Below normal |
| 1943 | 94.01 | 10 | 5 | 2 | Near normal |
| 1944 | 104.4525 | 14 | 8 | 3 | Near normal |
| 1945 | 63.415 | 11 | 5 | 2 | Below normal |
| 1946 | 19.6125 | 7 | 3 | 0 | Below normal |
| 1947 | 88.49 | 10 | 5 | 2 | Near normal |
| 1948 | 94.9775 | 10 | 6 | 4 | Near normal |
| 1949 | 96.4475 | 16 | 7 | 2 | Near normal |
| 1950 | 211.2825 | 16 | 11 | 6 | Hyperactive |
| 1951 | 126.325 | 12 | 8 | 3 | Above normal |
| 1952 | 69.08 | 11 | 5 | 2 | Near normal |
| 1953 | 98.5075 | 14 | 7 | 3 | Near normal |
| 1954 | 110.88 | 16 | 7 | 3 | Near normal |
| 1955 | 158.17 | 13 | 9 | 4 | Hyperactive |
| 1956 | 56.6725 | 12 | 4 | 1 | Below normal |
| 1957 | 78.6625 | 8 | 3 | 2 | Near normal |
| 1958 | 109.6925 | 12 | 7 | 3 | Above normal |
| 1959 | 77.1075 | 14 | 7 | 2 | Near normal |
| 1960 | 72.9 | 8 | 4 | 2 | Near normal |
| 1961 | 205.395 | 11 | 8 | 7 | Hyperactive |
| 1962 | 35.5675 | 5 | 3 | 1 | Below normal |
| 1963 | 117.9325 | 9 | 7 | 2 | Near normal |
| 1964 | 169.7675 | 12 | 6 | 6 | Near normal |
| 1965 | 84.33 | 6 | 4 | 1 | Below normal |
| 1966 | 145.2175 | 11 | 7 | 3 | Above normal |
| 1967 | 121.705 | 8 | 6 | 1 | Near normal |
| 1968 | 45.0725 | 8 | 5 | 0 | Below normal |
| 1969 | 165.7375 | 18 | 12 | 5 | Hyperactive |
| 1970 | 40.18 | 10 | 5 | 2 | Below normal |
| 1971 | 96.5275 | 13 | 6 | 1 | Near normal |
| 1972 | 35.605 | 7 | 3 | 0 | Below normal |
| 1973 | 47.85 | 8 | 4 | 1 | Below normal |
| 1974 | 68.125 | 11 | 4 | 2 | Below normal |
| 1975 | 76.0625 | 9 | 6 | 3 | Near normal |
| 1976 | 84.1725 | 10 | 6 | 2 | Near normal |
| 1977 | 25.3175 | 6 | 5 | 1 | Below normal |
| 1978 | 63.2175 | 12 | 5 | 2 | Below normal |
| 1979 | 92.9175 | 9 | 6 | 2 | Near normal |
| 1980 | 148.9375 | 11 | 9 | 2 | Near normal |
| 1981 | 100.3275 | 12 | 7 | 3 | Near normal |
| 1982 | 31.5025 | 6 | 2 | 1 | Below normal |
| 1983 | 17.4025 | 4 | 3 | 1 | Below normal |
| 1984 | 84.295 | 13 | 5 | 1 | Near normal |
| 1985 | 87.9825 | 11 | 7 | 3 | Near normal |
| 1986 | 35.7925 | 6 | 4 | 0 | Below normal |
| 1987 | 34.36 | 7 | 3 | 1 | Below normal |
| 1988 | 102.9925 | 12 | 5 | 3 | Near normal |
| 1989 | 135.125 | 11 | 7 | 2 | Near normal |
| 1990 | 96.8025 | 14 | 8 | 1 | Near normal |
| 1991 | 35.5375 | 8 | 4 | 2 | Below normal |
| 1992 | 76.2225 | 7 | 4 | 1 | Below normal |
| 1993 | 38.665 | 8 | 4 | 1 | Below normal |
| 1994 | 32.02 | 7 | 3 | 0 | Below normal |
| 1995 | 227.1025 | 19 | 11 | 5 | Hyperactive |
| 1996 | 166.1825 | 13 | 9 | 6 | Hyperactive |
| 1997 | 40.9275 | 8 | 3 | 1 | Below normal |
| 1998 | 181.7675 | 14 | 10 | 3 | Hyperactive |
| 1999 | 176.5275 | 12 | 8 | 5 | Hyperactive |
| 2000 | 119.1425 | 15 | 8 | 3 | Above normal |
| 2001 | 110.32 | 15 | 9 | 4 | Near normal |
| 2002 | 67.9925 | 12 | 4 | 2 | Near normal |
| 2003 | 176.84 | 16 | 7 | 3 | Hyperactive |
| 2004 | 226.88 | 15 | 9 | 6 | Hyperactive |
| 2005 | 250.1275 | 28 | 15 | 7 | Hyperactive |
| 2006 | 78.535 | 10 | 5 | 2 | Near normal |
| 2007 | 73.885 | 15 | 6 | 2 | Near normal |
| 2008 | 145.7175 | 16 | 8 | 5 | Above normal |
| 2009 | 52.58 | 9 | 3 | 2 | Below normal |
| 2010 | 165.4825 | 19 | 12 | 5 | Hyperactive |
| 2011 | 126.3025 | 19 | 7 | 4 | Above normal |
| 2012 | 132.6325 | 19 | 10 | 2 | Above normal |
| 2013 | 36.12 | 14 | 2 | 0 | Below normal |
| 2014 | 66.725 | 8 | 6 | 2 | Near normal |
| 2015 | 62.685 | 11 | 4 | 2 | Below normal |
| 2016 | 141.2525 | 15 | 7 | 4 | Above normal |
| 2017 | 224.8775 | 17 | 10 | 6 | Hyperactive |
| 2018 | 118.84 | 14 | 7 | 2 | Current season |
Eastern Pacific ACE
Categories
The (unofficial) categorization of seasons for this table is based mutatis mutandis on that used in the Atlantic basin:
- Hyperactivity: Index approximately 190 (200% of the median of 2002-2016) or more.
- Above-normal season: An ACE value above 135 (117% of the median), provided at least two of the following three parameters exceed the long-term average: number of tropical storms (16), hurricanes (9), and major hurricanes (4).
- Near-normal season: neither above-normal nor below normal
- Below-normal season: An ACE value below 86 (75% of the median)

Individual storms in the Eastern Pacific (east of 180°W)
The highest ever ACE estimated for a single storm in the Eastern or Central Pacific, while located east of the International Date Line is 62.8, for Hurricane Fico of 1978. Other Eastern Pacific storms with high ACEs include Hurricane John in 1994, with an ACE of 54.0, Hurricane Kevin in 1991, with an ACE of 52.1, and Hurricane Hector of 2018, with an ACE of 49.6.[11]
The following table shows those storms in the Eastern and Central Pacific basins from 1971–2018 that have attained over 30 points of ACE.[12]
| Storm | Year | Peak classification | ACE | Duration |
|---|---|---|---|---|
| Hurricane Fico | 1978 | 62.8 | 20 days | |
| Hurricane John |
1994 | 54.0 | 19 days | |
| Hurricane Kevin | 1991 | 52.1 | 17 days | |
| Hurricane Hector |
2018 | 49.6 | 13 days | |
| Hurricane Tina | 1992 | 47.7 | 22 days | |
| Hurricane Trudy | 1990 | 45.8 | 16 days | |
| Hurricane Lane | 2018 | 44.2 | 13 days | |
| Hurricane Dora |
1999 | 41.4 | 13 days | |
| Hurricane Jimena | 2015 | 40.0 | 15 days | |
| Hurricane Guillermo | 1997 | 40.0 | 16 days | |
| Hurricane Norbert | 1984 | 39.6 | 12 days | |
| Hurricane Norman | 2018 | 36.6 | 12 days | |
| Hurricane Celeste | 1972 | 36.3 | 16 days | |
| Hurricane Lester | 2016 | 35.4 | 14 days | |
| Hurricane Sergio | 2018 | 35.4 | 13 days | |
| Hurricane Olaf | 2015 | 34.6 | 12 days | |
| Hurricane Jimena | 1991 | 34.5 | 12 days | |
| Hurricane Doreen | 1973 | 34.3 | 16 days | |
| Hurricane Ioke |
2006 | 34.2 | 7 days | |
| Hurricane Marie | 1990 | 33.1 | 14 days | |
| Hurricane Orlene | 1992 | 32.4 | 12 days | |
| Hurricane Greg | 1993 | 32.3 | 13 days | |
| Hurricane Hilary | 2011 | 31.2 | 9 days | |
![]()
Eastern Pacific hurricane seasons, 1971–2018
Accumulated Cyclone Energy is also used in the eastern and central Pacific Ocean. Data on ACE is considered reliable starting with the 1971 season. The season with the highest ACE since 1971 is the 1992 season. The 1977 season has the lowest ACE. The most recent above-normal season is the 2018 season, the most recent near-normal season is the 2017 season, and the most recent below normal season is the 2013 season.[13] The 35 year median 1971–2005 is 115 x 104 kn2 (100 in the EPAC zone east of 140°W, 13 in the CPAC zone); the mean is 130 (112 + 18). +
| Season | ACE | TS | HU | MH | Classification |
|---|---|---|---|---|---|
| 1971 | 139 | 18 | 12 | 6 | Above normal |
| 1972 | 136 | 14 | 8 | 4 | Near normal |
| 1973 | 114 | 12 | 7 | 3 | Near normal |
| 1974 | 90 | 18 | 11 | 3 | Near normal |
| 1975 | 112 | 17 | 9 | 4 | Near normal |
| 1976 | 121 | 15 | 9 | 5 | Near normal |
| 1977 | 22 | 8 | 4 | 0 | Below normal |
| 1978 | 207 | 19 | 14 | 7 | Above normal |
| 1979 | 57 | 10 | 6 | 4 | Below normal |
| 1980 | 77 | 14 | 7 | 3 | Below normal |
| 1981 | 72 | 15 | 8 | 1 | Below normal |
| 1982 | 161 | 23 | 12 | 5 | Above normal |
| 1983 | 206 | 21 | 12 | 8 | Above normal |
| 1984 | 193 | 21 | 13 | 7 | Above normal |
| 1985 | 192 | 24 | 13 | 8 | Above normal |
| 1986 | 107 | 17 | 9 | 3 | Near normal |
| 1987 | 132 | 20 | 10 | 4 | Near normal |
| 1988 | 127 | 15 | 7 | 3 | Near normal |
| 1989 | 110 | 17 | 9 | 4 | Near normal |
| 1990 | 245 | 21 | 16 | 6 | Above normal |
| 1991 | 178 | 14 | 10 | 5 | Above normal |
| 1992 | 295 | 27 | 16 | 10 | Above normal |
| 1993 | 201 | 15 | 11 | 9 | Above normal |
| 1994 | 185 | 20 | 10 | 5 | Above normal |
| 1995 | 100 | 10 | 7 | 3 | Near normal |
| 1996 | 53 | 9 | 5 | 2 | Below normal |
| 1997 | 167 | 19 | 9 | 7 | Above normal |
| 1998 | 134 | 13 | 9 | 6 | Near normal |
| 1999 | 90 | 9 | 6 | 2 | Near normal |
| 2000 | 95 | 19 | 6 | 2 | Near normal |
| 2001 | 90 | 15 | 8 | 2 | Near normal |
| 2002 | 124 | 15 | 8 | 6 | Near normal |
| 2003 | 56 | 16 | 7 | 0 | Below normal |
| 2004 | 71 | 12 | 6 | 3 | Below normal |
| 2005 | 96 | 15 | 7 | 2 | Near normal |
| 2006 | 155 | 19 | 11 | 6 | Above normal |
| 2007 | 52 | 11 | 4 | 1 | Below normal |
| 2008 | 83 | 17 | 7 | 2 | Below normal |
| 2009 | 125 | 20 | 8 | 5 | Near normal |
| 2010 | 49 | 8 | 3 | 2 | Below normal |
| 2011 | 118 | 11 | 10 | 6 | Near normal |
| 2012 | 98 | 17 | 10 | 5 | Near normal |
| 2013 | 76 | 20 | 9 | 1 | Below normal |
| 2014 | 198 | 22 | 16 | 9 | Above normal |
| 2015 | 287 | 26 | 16 | 11 | Above normal |
| 2016 | 183 | 22 | 13 | 6 | Above normal |
| 2017 | 100 | 18 | 9 | 4 | Near normal |
| 2018 | 294 | 19 | 12 | 9 | Current season |
See also
References
- ↑ Mark Saunders; Adam Lea (2007). "Summary of 2006 NW Pacific Typhoon Season and Verification of Authors' Seasonal Forecasts" (PDF). Tropical Storm Risk. Archived from the original (PDF) on 2007-11-29. Retrieved 2013-09-01.
- ↑ Last advisory for T.S. Zeta 2005
- ↑ Bell GD, Halpert MS, Schnell RC, et al. (2000). "Climate Assessment for 1999" (PDF). Bulletin of the American Meteorological Society. 81 (6): 1328. Bibcode:2000BAMS...81.1328B. doi:10.1175/1520-0477(2000)081<1328:CAF>2.3.CO;2.
- ↑ Climate Prediction Center (May 22, 2014). "Background information: the North Atlantic Hurricane Season". United States National Oceanic and Atmospheric Administration. Retrieved June 5, 2014.
- ↑ Goldberg SB, Landsea CW, Mestas-Nuñez AM, Gray WM (July 2001). "The Recent Increase in Atlantic Hurricane Activity: Causes and Implications" (PDF). Science. 293 (5529): 474–9. Bibcode:2001Sci...293..474G. doi:10.1126/science.1060040. PMID 11463911.
Supplementary material
- ↑ "Summary of 2000 Atlantic tropical cyclone activity and verification of authors' seasonal activity prediction". Archived from the original on 2006-08-22. Retrieved 2006-08-22.
- ↑ "Atlantic hurricane best track (HURDAT version 2)". Hurricane Research Division (Database). National Hurricane Center. May 1, 2018. Retrieved October 16, 2018.
- 1 2 "Atlantic hurricanes by ACE - 1950-2012". Policlimate. Retrieved 7 August 2017.
- ↑ Klotzbach, Phil; McNoldy, Brian. "The extreme 2017 hurricane season adds another remarkable record to its long list". The Washington Post. Retrieved 12 May 2018.
- ↑ "Original vs. Revised HUDRAT". NOAA. Retrieved 28 September 2017.
- ↑ "Eastern Pacific Best Track Data - (1949 - present)". National Hurricane Center. Retrieved 12 August 2018.
- ↑ Webb, Eric. "Hurricane Hector 2018 - Discussion". Twitter. Retrieved 12 August 2018.
- ↑ East North Pacific ACE (through 30 Nov. 2005)
External links
| Wikimedia Commons has media related to Accumulated cyclone energy. |
- NOAA ACE by year from 1851
- National Climatic Data Center — Atlantic Basin 2004 Accumulated Cyclone Energy (ACE) Index
- National Climatic Data Center — Atlantic Basin 2005 Accumulated Cyclone Energy (ACE) Index
- 2004 Pacific NW Typhoon Season ACE
- Global Tropical Cyclone Best Track Database
- Hurricane Metrics