Atlantic hurricane season
The Atlantic hurricane season is the period in a year when hurricanes usually form in the Atlantic Ocean. Tropical cyclones in the North Atlantic are called hurricanes, tropical storms, or tropical depressions. In addition, there have been several storms over the years that have not been fully tropical and are categorized as subtropical depressions and subtropical storms. Even though subtropical storms and subtropical depressions are not technically as strong as tropical cyclones, the damages can still be devastating.
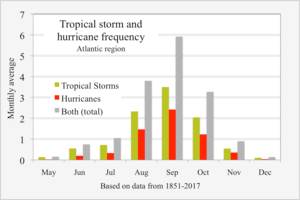
Worldwide, tropical cyclone activity peaks in late summer, when the difference between temperatures aloft and sea surface temperatures is the greatest. However, each particular basin has its own seasonal patterns. On a worldwide scale, May is the least active month, while September is the most active.[2] In the Northern Atlantic Ocean, a distinct hurricane season occurs from June 1 to November 30, sharply peaking from late August through September;[2] the season's climatological peak of activity occurs around September 10 each season.[3] This is the norm, but in 1938, the Atlantic hurricane season started as early as January 3.
Tropical disturbances that reach tropical storm intensity are named from a pre-determined list. On average, 10.1 named storms occur each season, with an average of 5.9 becoming hurricanes and 2.5 becoming major hurricanes (Category 3 or greater). The most active season was 2005, during which 28 tropical cyclones formed, of which a record 15 became hurricanes. The least active season was 1914, with only one known tropical cyclone developing during that year.[4] The Atlantic hurricane season is a time when most tropical cyclones are expected to develop across the northern Atlantic Ocean. It is currently defined as the time frame from June 1 through November 30, though in the past the season was defined as a shorter time frame. During the season, regular tropical weather outlooks are issued by the National Hurricane Center, and coordination between the Weather Prediction Center and National Hurricane Center occurs for systems which have not formed yet, but could develop during the next three to seven days.
Concept
The basic concept of a hurricane season began during 1935,[5] when dedicated wire circuits known as hurricane circuits began to be set up along the Gulf and Atlantic coasts,[6] a process completed by 1955.[7] It was originally the time frame when the tropics were monitored routinely for tropical cyclone activity, and was originally defined as from June 15 through October 31.[8] Over the years, the beginning date was shifted back to June 1, while the end date was shifted to November 15,[6] before settling at November 30 by 1965.[9][10] This was when hurricane reconnaissance planes were sent out to fly across the Atlantic and Gulf of Mexico on a routine basis to look for potential tropical cyclones, in the years before the continuous weather satellite era.[8] Since regular satellite surveillance began, hurricane hunter aircraft fly only into storm areas which are first spotted by satellite imagery.[11]
Operations
During the hurricane season, the National Hurricane Center routinely issues their Tropical Weather Outlook product, which identifies areas of concern within the tropics which could develop into tropical cyclones. If systems occur outside the defined hurricane season, special Tropical Weather Outlooks will be issued.[12] Routine coordination occurs at 1700 UTC each day between the Weather Prediction Center and National Hurricane Center to identify systems for the pressure maps three to seven days into the future within the tropics, and points for existing tropical cyclones six to seven days into the future.[13] Possible tropical cyclones are depicted with a closed isobar, while systems with less certainty to develop are depicted as "spot lows" with no isobar surrounding them.
HURDAT
The North Atlantic hurricane database, or HURDAT, is the database for all tropical storms and hurricanes for the Atlantic Ocean, Gulf of Mexico and Caribbean Sea, including those that have made landfall in the United States. The original database of six-hourly positions and intensities were put together in the 1960s in support of the Apollo space program to help provide statistical track forecast guidance. In the intervening years, this database — which is now freely and easily accessible on the Internet from the National Hurricane Center's (NHC) webpage — has been utilized for a wide variety of uses: climatic change studies, seasonal forecasting, risk assessment for county emergency managers, analysis of potential losses for insurance and business interests, intensity forecasting techniques and verification of official and various model predictions of track and intensity.
HURDAT was not designed with all of these uses in mind when it was first put together and not all of them may be appropriate given its original motivation. HURDAT contains numerous systematic as well as some random errors in the database. Additionally, analysis techniques have changed over the years at NHC as their understanding of tropical cyclones has developed, leading to biases in the historical database. Another difficulty in applying the hurricane database to studies concerned with landfalling events is the lack of exact location, time and intensity at hurricane landfall.
Re-analysis project
HURDAT is regularly updated annually to reflect the previous season's activity. The older portion of the database has been regularly revised since 2001. The first time in 2001 led to the addition of tropical cyclone tracks for the years 1851 to 1885. The second time was August 2002 when Hurricane Andrew was upgraded to a Category 5. Recent efforts into uncovering undocumented historical hurricanes in the late 19th and 20th centuries by various researchers have greatly increased our knowledge of these past events. Possible changes for the years 1951 onward are not yet incorporated into the HURDAT database. Because of all of these issues, a re-analysis of the Atlantic hurricane database is being attempted that will be completed in three years.
In addition to the groundbreaking work by Partagas, additional analyses, digitization and quality control of the data was carried out by researchers at the NOAA Hurricane Research Division funded by the NOAA Office of Global Programs. This re-analysis will continue to progress through the remainder of the 20th century.[14]
The National Hurricane Center's Best Track Change Committee has approved changes for a few recent cyclones, such as Hurricane Andrew. Official changes to the Atlantic hurricane database are approved by the National Hurricane Center Best Track Change Committee. Thus research conducted by Chris Landsea and colleagues as part of the Atlantic hurricane database reanalysis project are submitted through this review process. Not all Landsea's recommendations are accepted by the Committee.
1494–1850 (pre-HURDAT era)
| Period | Seasons | Individual years |
|---|---|---|
| Pre-19th century | Pre-17th century (pre 1600), 17th century (1600s), 18th century (1700s) | 1780 |
| 1800–1849 | 1800–1809, 1810–1819, 1820–1829, 1830–1839, 1840–1849 | 1842 |
1850–1899 (1851–present HURDAT era)
1850s
| Year | Map | Number of tropical storms | Number of hurricanes | Number of major hurricanes | Deaths | Strongest storm | Major landfall hurricanes | Notes |
|---|---|---|---|---|---|---|---|---|
| 1850 | 7 | 7 | 0 | Not known | One | |||
| 1851 |  |
6 | 3 | 1 | 24 | Four | • Great Florida Middle Panhandle Hurricane of 1851 (cat 3) | |
| 1852 |  |
5 | 5 | 1 | 100+ | One | • Great Mobile Hurricane of 1852 (cat 3) | |
| 1853 |  |
8 | 4 | 2 | 40 | Three | ||
| 1854 | 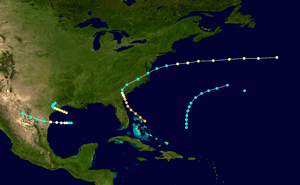 |
5 | 3 | 1 | 30+ | Three | • Coastal Hurricane of 1854 (cat 3) | |
| 1855 | 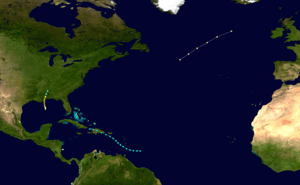 |
5 | 4 | 1 | Not known | Five | • Middle Gulf Shore Hurricane of 1855 (cat 3) | |
| 1856 |  |
6 | 4 | 2 | 200+ | One | • The Last Island Hurricane of 1856 (cat 4) | |
| 1857 | 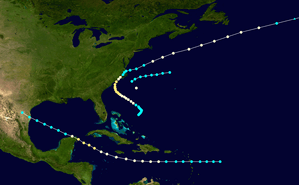 |
4 | 3 | 0 | 424 | Two & Four | ||
| 1858 | 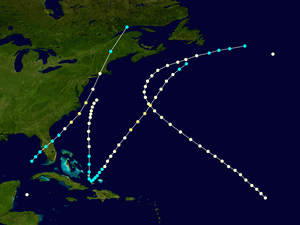 |
6 | 6 | 0 | None | Three & Six | ||
| 1859 |  |
8 | 7 | 1 | Numerous | Six | ||
1860s
| Year | Map | Number of tropical storms | Number of hurricanes | Number of major hurricanes | Deaths | Strongest storm | Major landfall hurricanes | Notes |
|---|---|---|---|---|---|---|---|---|
| 1860 |  |
7 | 6 | 1 | 60+ | One | ||
| 1861 |  |
2 | 6 | 0 | 22+ | One and Three | ||
| 1862 |  |
3 | 3 | 0 | 3 | Two and Three | ||
| 1863 |  |
4 | 5 | 0 | 90 | One, Two, Three & Four | ||
| 1864 |  |
2 | 3 | 0 | None | One, Three & Five | ||
| 1865 | 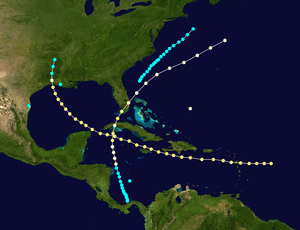 |
4 | 3 | 0 | 326 | Four & Seven | ||
| 1866 |  |
7 | 6 | 1 | 383 | Six | • Great Bahamas Hurricane of 1866 (cat 4) | |
| 1867 | 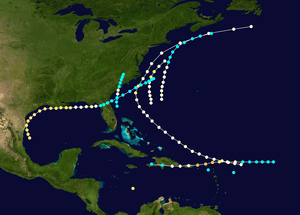 |
2 | 6 | 1 | 811 | 'San Narciso' | • Hurricane San Narciso of 1867 (cat 3) | |
| 1868 | 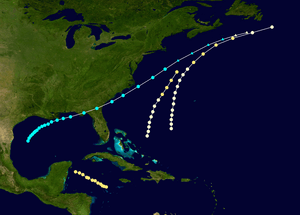 |
1 | 3 | 0 | 2 | One, Two & Four | ||
| 1869 | 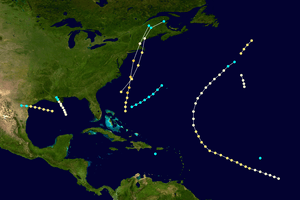 |
3 | 6 | 1 | 38 | Six | • First New England Gale of 1869 (cat 3) • Saxby's New England Gale of 1869 (cat 2) |
|
1870s
| Year | Map | Number of tropical storms | Number of hurricanes | Number of major hurricanes | Deaths | Strongest storm | Major landfall hurricanes | Notes |
|---|---|---|---|---|---|---|---|---|
| 1870 |  |
11 | 10 | 2 | 2,052 | Four | • First Key West Hurricane 1870/Hurricane of San Marcos 1870 (cat 3) • Second Key West Hurricane 1870 (cat 2) |
|
| 1871 |  |
8 | 6 | 2 | 30 | Three and Four | • Central Florida Hurricane of 1871 (cat 3) • Hurricane Santa Juana of 1871 (cat 3) |
|
| 1872 |  |
5 | 4 | 0 | Unknown | Two | ||
| 1873 |  |
5 | 3 | 2 | 626 | Five | • Central Florida Hurricane of 1873 (cat 3) | |
| 1874 |  |
7 | 4 | 0 | Unknown | Seven | ||
| 1875 |  |
6 | 5 | 1 | 800 | Three | • Great Indianola Hurricane of 1875 (cat 3) | |
| 1876 |  |
5 | 4 | 2 | 19 | "San Felipe" | • Hurricane San Felipe of 1876 (cat 3) • Cuba-South Florida Hurricane of 1876 (cat 3) |
|
| 1877 |  |
8 | 3 | 1 | 34 | Four | ||
| 1878 |  |
12 | 10 | 1 | 108 | Seven | • Gale of 1878 (cat 2) | |
| 1879 |  |
8 | 6 | 2 | 47 | Four | • Great Beaufort Carolina Hurricane of 1879 (cat 3) • Louisiana Hurricane of 1879 (cat 3) |
|
1880s
| Year | Map | Number of tropical storms | Number of hurricanes | Number of major hurricanes | Deaths | Strongest storm | Major landfall hurricanes | Notes |
|---|---|---|---|---|---|---|---|---|
| 1880 | 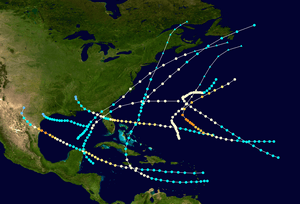 |
11 | 9 | 2 | 133 | Eight | • Brownsville Hurricane of 1880 (cat 4) | |
| 1881 | 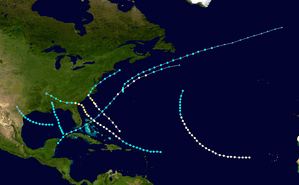 |
7 | 4 | 0 | 700 | Five and Six | • Georgia Hurricane of 1881 (cat 2) | |
| 1882 | 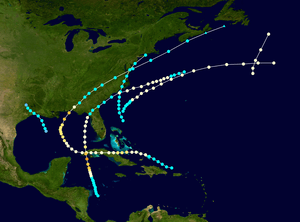 |
6 | 5 | 2 | 6 | Six | • Pensacola Hurricane of 1882 (cat 3) • Cuba Hurricane of 1882 (cat 4) |
|
| 1883 |  |
4 | 3 | 2 | 236 | Two and Three | • Bahamas-North Carolina Hurricane of 1883 (cat 3) | |
| 1884 |  |
4 | 4 | 1 | 8 | Two | ||
| 1885 | 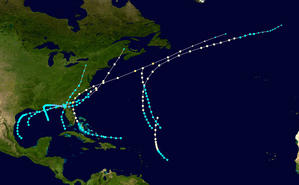 |
8 | 6 | 1 | 25 | Two | ||
| 1886 | 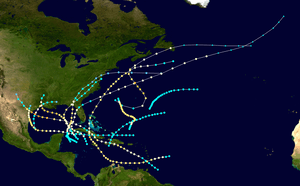 |
12 | 10 | 4 | 200+ | "Indianola" | • Indianola Hurricane of 1886 (cat 4) • Cuba Hurricane of 1886 (cat 3) • Texas-Louisiana Hurricane of 1886 (cat 3) |
Seven hurricanes struck the United States, the most during a single year.[15] Indianola, Texas struck by two major hurricanes (1875 and 1886) which effectively closed down the town.[16] |
| 1887 | 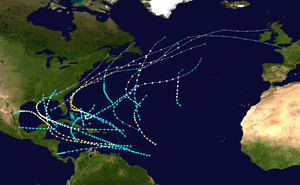 |
19 | 11 | 2 | 2 | Seven | Tied for third most active season on record following very active 1886 season. Has the most storms forming outside the normal hurricane season One of only 4 seasons to have both a preseason and postseason storm | |
| 1888 | 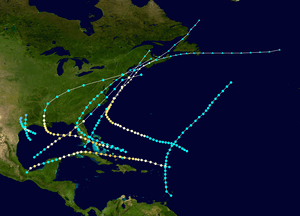 |
9 | 6 | 2 | 924 | Three and Four | • Louisiana Hurricane of 1888 (cat 3) • Hurricane San Gil of 1888 (cat 3) |
|
| 1889 | |
9 | 6 | 0 | 40 | Six | ||
1890s
| Year | Map | Number of tropical storms | Number of hurricanes | Number of major hurricanes | Deaths | Strongest storm | Major landfall hurricanes | Notes |
|---|---|---|---|---|---|---|---|---|
| 1890 | 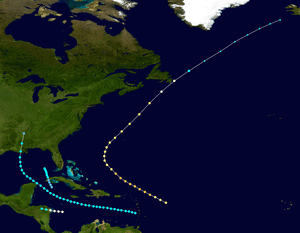 |
4 | 2 | 1 | 9 | Three | ||
| 1891 | 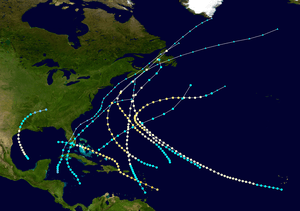 |
10 | 7 | 1 | 700+ | "Martinique" | • Martinique Hurricane of 1891 (cat 3) | |
| 1892 | 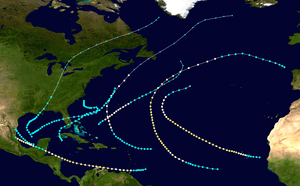 |
9 | 5 | 0 | 16 | Three, Five, and Seven | ||
| 1893 |  |
12 | 10 | 5 | 4,028 | "Cheniere Caminada" | • Hurricane San Roque of 1893 (cat 3) • New York Hurricane of 1893 (cat 3) • 1893 Sea Islands Hurricane (cat 3) • Great Charleston Hurricane (cat 3) • 1893 Cheniere Caminada hurricane (cat 4) |
5 major hurricanes made landfall this year. Two hurricanes caused more than 2,000 deaths in the United States. Four simultaneous hurricanes on August 22, one of two times on record. |
| 1894 | 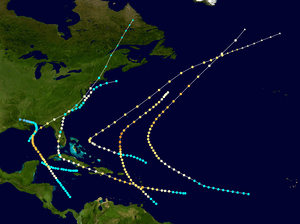 |
7 | 5 | 4 | 200+ | Six | • Florida Panhandle Hurricane of 1894 (cat 3) | |
| 1895 | 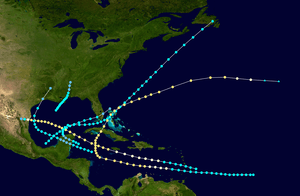 |
6 | 2 | 0 | 56 | Two | ||
| 1896 |  |
7 | 6 | 2 | 130 | Four | • Hurricane San Ramon of 1896 (cat 3) • Cedar Keys Hurricane of 1896 (cat 3) |
|
| 1897 | 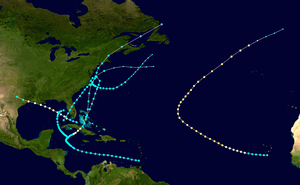 |
6 | 3 | 0 | None | One | ||
| 1898 |  |
11 | 5 | 1 | 562 | "Georgia" | • Georgia Hurricane of 1898 (cat 4) | Major hurricane last struck Georgia in 1881 |
| 1899 |  |
9 | 5 | 2 | 3,439 | "San Ciriaco" | • Hurricane San Ciriaco of 1899/Great Bahamas Hurricane of 1899 (cat 4) | The San Ciriaco hurricane was the longest lasting Atlantic hurricane on record |
1900s
NOTE: In the following tables, all estimates of damage costs are expressed in contemporaneous US dollars (USD).
1900s
| Year | Map | Number of tropical storms | Number of hurricanes | Number of major hurricanes | Deaths | Damage USD | Strongest storm | Major landfall hurricanes | Notes |
|---|---|---|---|---|---|---|---|---|---|
| 1900 |  |
7 | 3 | 2 | 8,000+ | $60 million | "Galveston" | • Great Galveston Hurricane of 1900 (cat 4) | The Galveston hurricane was the deadliest disaster in the United States. |
| 1901 |  |
12 | 5 | 1 | 10 | $1 million | Seven | ||
| 1902 | 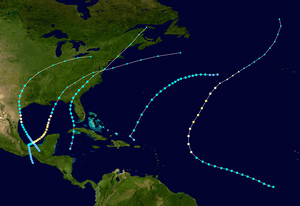 |
5 | 3 | 0 | None | Unknown | Four | ||
| 1903 | 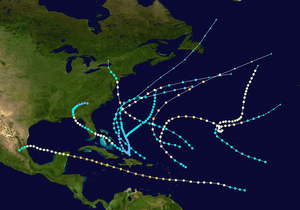 |
10 | 7 | 1 | 228 | $1.15 million | Two | • Jamaica Hurricane of 1903 (cat 3) | |
| 1904 | 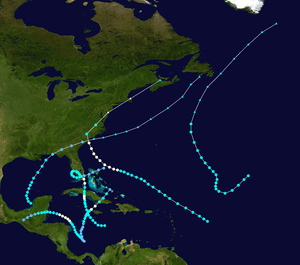 |
5 | 3 | 0 | 87 | $1 million | Two | ||
| 1905 | 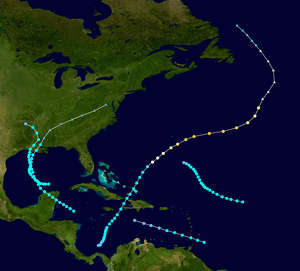 |
5 | 1 | 1 | 1 | Unknown | Four | ||
| 1906 |  |
11 | 6 | 3 | 367 | $2.48 million | Four | • Mississippi Hurricane of 1906 (cat 3) • Florida Keys Hurricane of 1906 (cat 3) |
|
| 1907 | 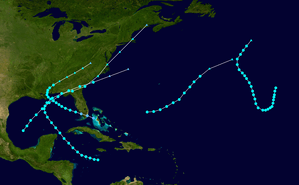 |
5 | 0 | 0 | None | Unknown | One | One of two seasons with no recorded hurricanes | |
| 1908 | 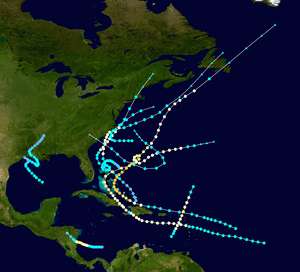 |
10 | 6 | 1 | None | Unknown | Six | Includes the only known March tropical cyclone in the basin | |
| 1909 | 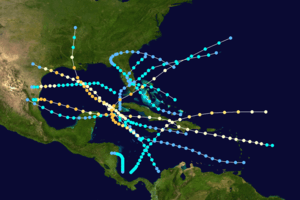 |
11 | 6 | 4 | 4,614 | $75 million | "Grand Isle" | • 1909 Velasco hurricane (cat 3) • 1909 Monterrey hurricane (cat 3) • 1909 Grand Isle hurricane (cat 3) • 1909 Key West Hurricane (cat 3) 1909 Greater Antilles hurricane (cat 2) |
3 major hurricanes made landfall this year |
1910s
| Year | Map | Number of tropical storms | Number of hurricanes | Number of major hurricanes | Deaths | Damage USD | Strongest storm | Major landfall hurricanes | Notes |
|---|---|---|---|---|---|---|---|---|---|
| 1910 |  |
5 | 3 | 1 | 100 | $1.25 million | "Cuba" | • The Great Cuba Hurricane of 1910 (cat 4) | |
| 1911 | 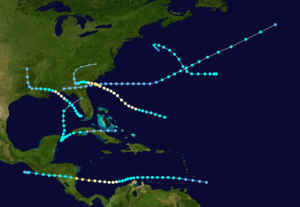 |
6 | 3 | 0 | 27 | $3 million | Three | ||
| 1912 |  |
7 | 4 | 1 | 116 | $67,000 | Seven | • The Jamaica Hurricane of 1912 (cat 3) | |
| 1913 | 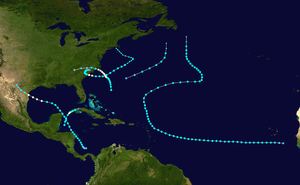 |
6 | 4 | 0 | 5 | $4 million | Four | ||
| 1914 | 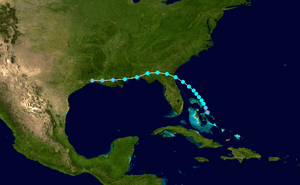 |
1 | 0 | 0 | 0 | Unknown | One | Least active season on record. One of two seasons with no recorded hurricanes. | |
| 1915 | 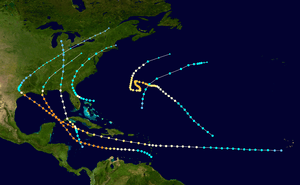 |
6 | 5 | 4 | 675 | $63 million | "New Orleans" | • Great Galveston Hurricane of 1915 (cat 4) • New Orleans Hurricanes of 1915 (cat 4) |
Two cat 4 hurricanes made landfall in US in same year. Galveston last struck with major hurricane in 1900. |
| 1916 | 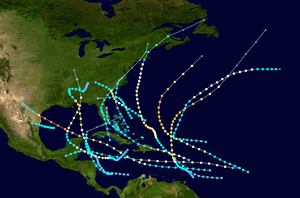 |
15 | 10 | 5 | 31 | $5.9 million | "Texas" | • Gulf Coast Hurricane of 1916 (cat 3) • Charleston Hurricane of 1916 (cat 3) • Great Texas Hurricane of 1916 (cat 4) |
3 major hurricanes made landfall this year following a very active 1915 season. |
| 1917 | 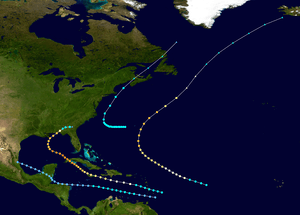 |
4 | 2 | 2 | 5 | $170,000 | "Nueva Gerona" | • Nueva Gerona Hurricane of 1917 (cat 4) | |
| 1918 | 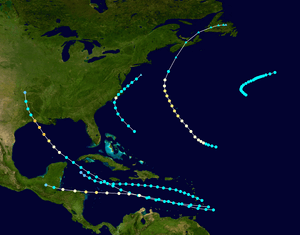 |
6 | 4 | 1 | 34 | $5+ million | One | • Louisiana Hurricane of 1918 (cat 3) | |
| 1919 | 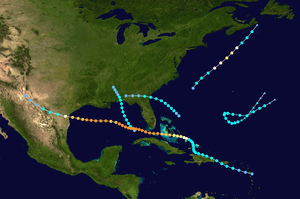 |
5 | 2 | 1 | ~900 | $22 million | "Florida Keys" | • Great Florida Keys Hurricane of 1919 (cat 4) | |
1920s
| Year | Map | Number of tropical storms | Number of hurricanes | Number of major hurricanes | Deaths | Damage USD | Strongest storm | Major landfall hurricanes | Notes |
|---|---|---|---|---|---|---|---|---|---|
| 1920 | 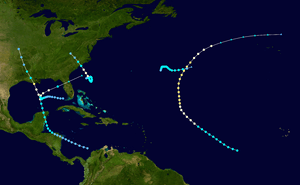 |
5 | 4 | 0 | 2 | $15.75 million | One | ||
| 1921 |  |
7 | 5 | 2 | 6 | $36.5 million | "Tampa Bay" | • Hurricane San Pedro of 1921 (cat 3) • Great Tampa Bay Hurricane of 1921 (cat 4) |
|
| 1922 |  |
5 | 3 | 1 | Unknown | Unknown | Two | ||
| 1923 |  |
9 | 4 | 1 | 0 | Unknown | Five | ||
| 1924 |  |
11 | 5 | 2 | 150+ | Unknown | "Cuba" | • Great Cuba Hurricane of 1924 (cat 5) | The earliest officially classified Category 5 Atlantic hurricane on the Saffir–Simpson Scale |
| 1925 |  |
4 | 2 | 0 | 59+ | $19.9 million | One | ||
| 1926 | 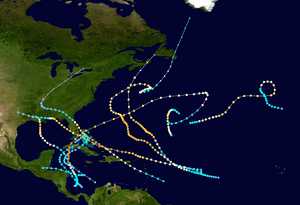 |
11 | 8 | 6 | 1,315+ | $1.4+ billion | "Miami" | • The Great Bahamas Hurricane of 1926 (cat 4) • Nova Scotia Hurricane of 1926 (cat 3) • Louisiana hurricane of 1926 (cat 3) • Great Miami Hurricane of 1926 (cat 4) • Great Havana-Bermuda Hurricane of 1926 (cat 4) |
6 major hurricanes this year, 5 major landfalls |
| 1927 | 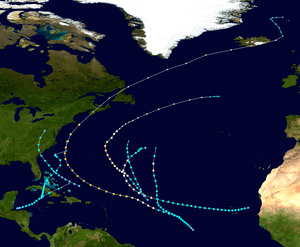 |
8 | 4 | 1 | 184 | Unknown | "Nova Scotia" | • Nova Scotia Hurricane of 1927 (cat 3) | |
| 1928 | 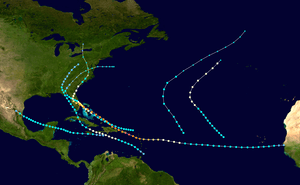 |
6 | 4 | 1 | 4,000+ | $952.5+ million | "Okeechobee" | • Great Okeechobee Hurricane of 1928 (cat 5) | The Okeechobee hurricane is the only known hurricane to strike Puerto Rico at Category 5 strength. |
| 1929 | 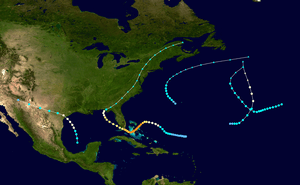 |
5 | 3 | 1 | 51 | $9.0 million | "Florida" | • Great Bahamas Hurricane of 1929 (cat 4) | |
1930s
| Year | Map | Number of tropical storms | Number of hurricanes | Number of major hurricanes | Deaths | Damage USD | Strongest storm | Major landfall hurricanes | Notes |
|---|---|---|---|---|---|---|---|---|---|
| 1930 | 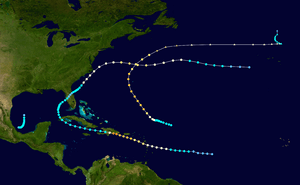 |
3 | 2 | 2 | 8,000 | $50 million | "Dominican Republic" | • Dominican Republic Hurricane of 1930 (cat 4) | The fifth deadliest hurricane on record |
| 1931 | 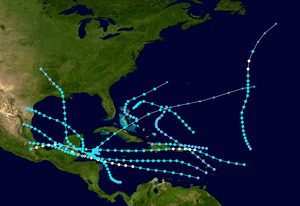 |
13 | 3 | 1 | 2,502 | $7.5 million | "Belize" | • Belize Hurricane of 1931 (cat 4) | |
| 1932 |  |
15 | 6 | 4 | 3,315 | $37 million | "Cuba" | • Freeport Texas Hurricane of 1932 (cat 4) • Great Bahamas Hurricane of 1932 (cat 5) • Hurricane San Ciprián of 1932 (cat 4) • Great Cuba Hurricane of 1932 (cat 5) |
Two Category 5 hurricanes; one in November (the latest such on record); four major hurricanes made landfall |
| 1933 |  |
20 | 11 | 6 | 651 | $86.6 million | "Tampico" | • Chesapeake–Potomac Hurricane of 1933 (cat 4) • Great Cuba-Brownsville Hurricane of 1933 (cat 5) • Treasure Coast Hurricane of 1933 (cat 4) • Outer Banks Hurricane of 1933 (cat 4) • Tampico Yucatán Hurricane of 1933 (cat 5) |
Second most active season on record following very active 1932 season. Two Category 5 hurricanes. Five major hurricanes made landfall |
| 1934 | 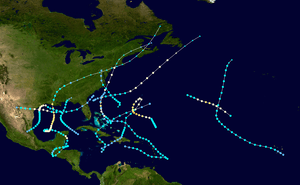 |
13 | 7 | 1 | 2,017 | $4.26 million | Thirteen | ||
| 1935 | 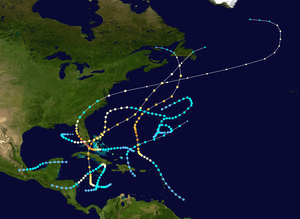 |
8 | 5 | 3 | 2,604 | $12.5 million | "Labor Day" | • Great Labor Day Hurricane of 1935 (cat 5) • Cuba Hurricane of 1935 (cat 4) |
The Labor Day hurricane is most intense landfalling tropical cyclone in the Atlantic known to date |
| 1936 | 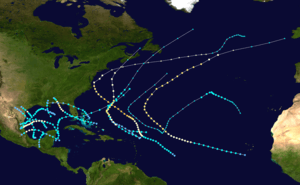 |
17 | 7 | 1 | 5 | $1.23 million | Thirteen | Very active season with no major landfalling hurricanes | |
| 1937 |  |
11 | 4 | 1 | 0 | Unknown | Six | ||
| 1938 |  |
9 | 4 | 2 | ~700 | $290.3 million | "New England" | • Long Island Express Hurricane (cat 5) | Earliest starting season on record (January 3). Long Island express made landfall as a fast moving category 3. |
| 1939 |  |
6 | 3 | 1 | 5 | Unknown | Five | ||
1940s


1950s
| Year | Map | Number of tropical storms | Number of hurricanes | Number of major hurricanes | Deaths | Damage USD | Strongest storm | Retired names | Notes |
|---|---|---|---|---|---|---|---|---|---|
| 1950 | 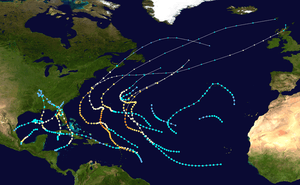 |
16 | 11 | 6 | 20 | $37 million | Dog | None | Record 8 tropical storms in October |
| 1951 | 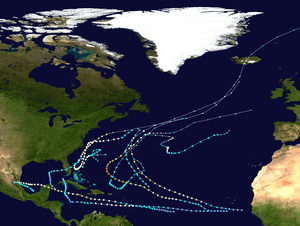 |
12 | 8 | 3 | 257 | $80 million | Easy | None | |
| 1952 | 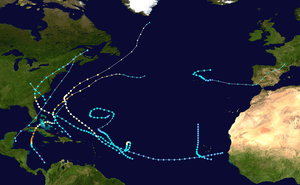 |
11 | 5 | 2 | 607 | $3.75 million | Fox | None | Includes the only known February tropical cyclone in the basin |
| 1953 |  |
14 | 7 | 3 | 1 | $6 million | Carol | None | First year of female names for storms. One of only 4 seasons to have both a preseason and postseason storm. |
| 1954 | 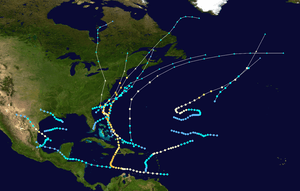 |
16 | 7 | 3 | 1,069 | $752 million | Hazel | Carol, Edna, Hazel | Includes Alice, one of only two storms in the basin to span two calendar years, tying for the latest storm in a season |
| 1955 | 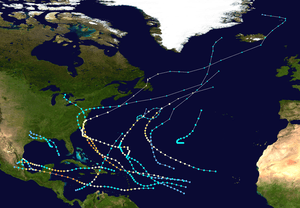 |
13 | 9 | 4 | 1,518 | $1.2 billion | Janet | Connie, Diane, Ione, Janet | |
| 1956 |  |
12 | 4 | 1 | 76 | $67.8 million | Betsy | None | |
| 1957 |  |
8 | 3 | 2 | 513 | $152.5 million | Carrie | Audrey | |
| 1958 | 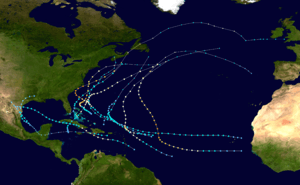 |
12 | 7 | 3 | 41 | $12 million | Helene | None | |
| 1959 | 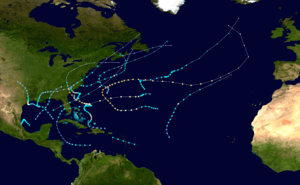 |
14 | 7 | 2 | 59 | $23.3 million | Gracie | Gracie? | Status of Gracie's retirement is unclear |
1960s
| Year | Map | Number of tropical storms | Number of hurricanes | Number of major hurricanes | Deaths | Damage USD | Strongest storm | Retired names | Notes |
|---|---|---|---|---|---|---|---|---|---|
| 1960 | 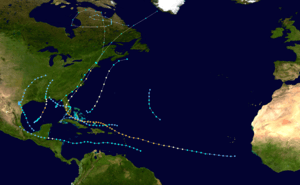 |
8 | 4 | 2 | 385 | $410 million | Donna | Donna | Current extent of the reanalysis project as of July 2016 |
| 1961 | 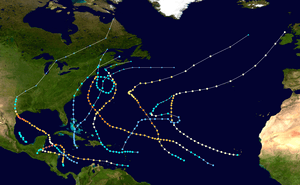 |
11 | 8 | 7 | 345 | $392 million | Hattie | Carla, Hattie | Two Category 5 Hurricanes Tied for most major hurricanes |
| 1962 | 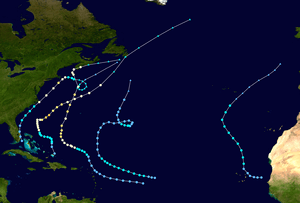 |
5 | 3 | 1 | 4 | $10 million | Ella | None | |
| 1963 | 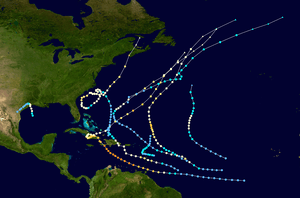 |
9 | 7 | 2 | 7,225 | $589 million | Flora | Flora | The sixth deadliest hurricane on record |
| 1964 | 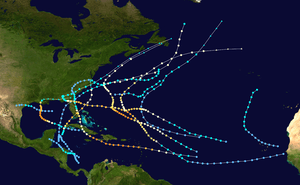 |
12 | 6 | 6 | 261 | $605 million | Hilda | Cleo, Dora, Hilda | |
| 1965 | 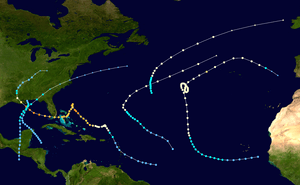 |
6 | 4 | 1 | 76 | $1.45 billion | Betsy | Betsy | |
| 1966 | 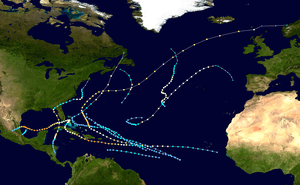 |
11 | 7 | 3 | 1,094 | $410 million | Inez | Inez | One named storm de-classified in post-analysis |
| 1967 | 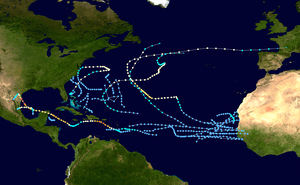 |
8 | 6 | 1 | 64 | $217 million | Beulah | Beulah | |
| 1968 |  |
8 | 4 | 0 | 10 | $10 million | Gladys | None | The name "Edna" was retired due to the storm in 1954,; also includes one subtropical storm. No major hurricanes. |
| 1969 | 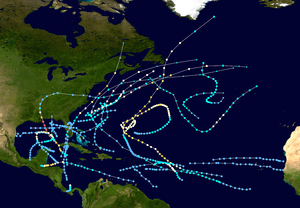 |
18 | 12 | 5 | 364 | $1.7 billion | Camille | Camille | Fourth most active season on record. Tied for second most hurricanes in a season on record. Includes one subtropical storm. |
1970s
| Year | Map | Number of tropical storms | Number of hurricanes | Number of major hurricanes | Deaths | Damage USD | Strongest storm | Retired names | Notes |
|---|---|---|---|---|---|---|---|---|---|
| 1970 | 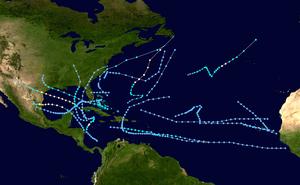 |
10 | 5 | 2 | 71 | $454 million | Celia | Celia | First season of a 24-year period of decreased activity in the Atlantic (-AMO) |
| 1971 | 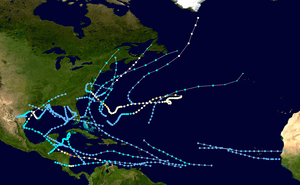 |
13 | 6 | 1 | 45 | $213 million | Edith | None | Includes first documented Hurricane to cross Central America, Irene |
| 1972 |  |
7 | 3 | 0 | 122 | $2.1 billion | Betty | Agnes | Includes three subtropical storms No major hurricanes |
| 1973 |  |
8 | 4 | 1 | 15 | $18 million | Ellen | None | Includes one subtropical storm |
| 1974 |  |
11 | 4 | 2 | 8,260+ | $1.97 billion | Carmen | Carmen, Fifi | Includes four subtropical storms Fifi was the fourth deadliest hurricane on record |
| 1975 |  |
9 | 6 | 3 | 80 | $100 million | Gladys | Eloise | Includes one subtropical storm |
| 1976 |  |
10 | 6 | 2 | 72 | $100 million | Belle | None | Includes two subtropical storms |
| 1977 |  |
6 | 5 | 1 | 10 | $10 million | Anita | Anita | |
| 1978 |  |
12 | 5 | 2 | 37 | $45 million | Greta | Greta | Includes the January subtropical storm in the Atlantic |
| 1979 |  |
9 | 5 | 2 | 2,118 | $4.3 billion | David | David, Frederic | First year for alternating male/female names. Includes one subtropical storm. |
1980s
| Year | Map | Number of tropical cyclones | Number of tropical storms | Number of hurricanes | Number of major hurricanes | Deaths | Damage USD | Strongest storm | Retired names | Notes |
|---|---|---|---|---|---|---|---|---|---|---|
| 1980 |  |
15 | 11 | 9 | 2 | 256 | $1 billion | Allen | Allen | Includes the storm with the highest sustained winds attained so far in the Atlantic |
| 1981 |  |
18 | 12 | 7 | 3 | 10 | $45 million | Harvey | None | |
| 1982 |  |
9 | 6 | 2 | 1 | 141 | $100 million | Debby | None | Includes one subtropical storm |
| 1983 | 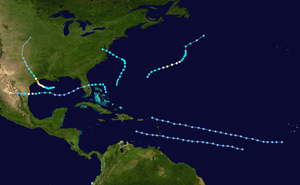 |
7 | 4 | 3 | 1 | 22 | $2.6 billion | Alicia | Alicia | Least active hurricane season in the satellite era |
| 1984 | 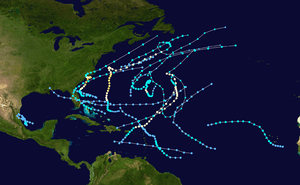 |
17 | 13 | 5 | 1 | 35 | $66 million | Diana | None | Includes one subtropical storm |
| 1985 | 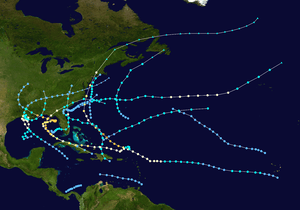 |
13 | 11 | 7 | 3 | 241 | $4.5 billion | Gloria | Elena, Gloria | Hurricane Kate struck Florida on November 21, the latest United States hurricane landfall |
| 1986 | 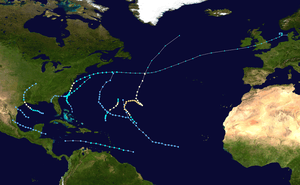 |
10 | 6 | 4 | 0 | 70 | $57 million | Earl | None | No major hurricanes |
| 1987 | 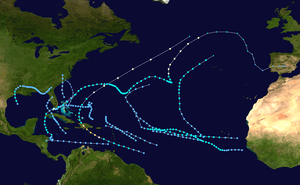 |
14 | 7 | 3 | 1 | 10 | $90 million | Emily | None | |
| 1988 | 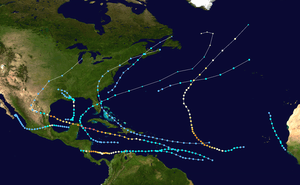 |
19 | 12 | 5 | 3 | 550 | $7 billion | Gilbert | Gilbert, Joan | Included strongest hurricane on record until 2005; first hurricane since 1978 to cross Central America |
| 1989 | 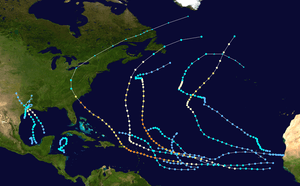 |
15 | 11 | 7 | 2 | 112 | $10.7 billion | Hugo | Hugo | |
1990s
| Year | Map | Number of tropical cyclones | Number of tropical storms | Number of hurricanes | Number of major hurricanes | Deaths | Damage USD | Strongest storm | Retired names | Notes |
|---|---|---|---|---|---|---|---|---|---|---|
| 1990 | 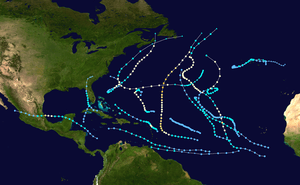 |
16 | 14 | 8 | 1 | 116 | $150 million | Gustav | Diana, Klaus | No tropical storms or hurricanes made landfall in the United States |
| 1991 | 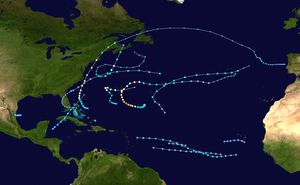 |
12 | 8 | 4 | 2 | 30 | $2.5 billion | Claudette | Bob | |
| 1992 |  |
9 | 7 | 4 | 1 | 66 | $27 billion | Andrew | Andrew | Hurricane Andrew was the costliest U.S. hurricane until 2005. Includes one subtropical storm. |
| 1993 |  |
10 | 8 | 4 | 1 | 274 | $271 million | Emily | None | |
| 1994 |  |
12 | 7 | 3 | 0 | 1,184 | $1.56 billion | Florence | None | No major hurricanes |
| 1995 |  |
21 | 19 | 11 | 5 | 115 | $9.3 billion | Opal | Luis, Marilyn, Opal, Roxanne | Tied for third most active season on record First season of an ongoing period of increased activity in the Atlantic (+AMO) |
| 1996 | 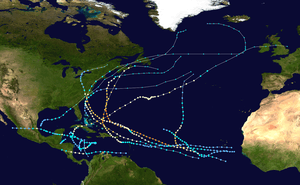 |
13 | 13 | 9 | 6 | 179 | $3.8 billion | Edouard | Cesar, Fran, Hortense | Cesar was renamed Douglas after it crossed Central America. Most amount of major hurricanes at the time |
| 1997 | 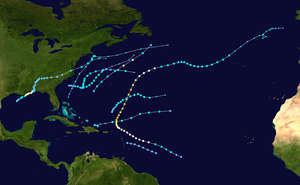 |
9 | 8 | 3 | 1 | 11 | $110 million | Erika | None | Includes one subtropical storm |
| 1998 | 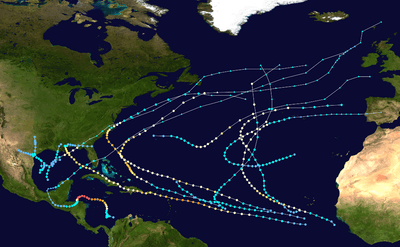 |
14 | 14 | 10 | 3 | 12,000+ | $12.2 billion | Mitch | Georges, Mitch | Four simultaneous hurricanes on September 26, the first time since 1893. Hurricane Mitch was the deadliest hurricane in over 200 years. |
| 1999 |  |
16 | 12 | 8 | 5 | 465 | $5.9 billion | Floyd | Floyd, Lenny | Most Category 4 hurricanes on record |
2000s
NOTE: In the following tables, all estimates of damage costs are expressed in contemporaneous US dollars (USD).
2000s
| Year | Map | Number of tropical cyclones | Number of tropical storms | Number of hurricanes | Number of major hurricanes | Deaths | Damage USD | Strongest storm | Retired names | Notes |
|---|---|---|---|---|---|---|---|---|---|---|
| 2000 |  |
19 | 15 | 8 | 3 | 79 | $1.2 billion | Keith | Keith | Includes one subtropical storm |
| 2001 |  |
17 | 15 | 9 | 4 | 105 | $7.1 billion | Michelle | Allison, Iris, Michelle | |
| 2002 |  |
14 | 12 | 4 | 2 | 53 | $2.6 billion | Isidore | Isidore, Lili | Record-tying 8 named storms formed in September |
| 2003 |  |
21 | 16 | 7 | 3 | 92 | $4.4 billion | Isabel | Fabian, Isabel, Juan | 3 off-season storms |
| 2004 |  |
17 | 15 | 9 | 6 | 3,100+ | $60.1 billion | Ivan | Charley, Frances, Ivan, Jeanne | Includes one subtropical storm Record-tying 8 named storms forming in August |
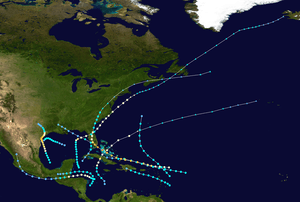
| 2005 |  |
31 | 28 | 15 | 7 | 2,280+ | $180.4 billion | Wilma | Dennis, Katrina, Rita, Stan, Wilma | Second costliest hurricane season on record Season holds most activity records, including cyclones, storms, hurricanes, major hurricanes and Category 5's (4) Most retired names Only year to use the Greek alphabet Includes 1 subtropical storm and 1 subtropical depression |
| 2006 |  |
10 | 10 | 5 | 2 | 14 | $500 million | Gordon and Helene | None | |
| 2007 |  |
17 | 15 | 6 | 2 | 423 | $3 billion | Dean | Dean, Felix, Noel | Includes one subtropical storm Two Category 5 Hurricanes that made landfall |
| 2008 |  |
17 | 16 | 8 | 5 | 1,047 | $47.5 billion | Ike | Gustav, Ike, Paloma | Tied for fifth most active season on record Only year on record in which a major hurricane existed in every month from July through November |
| 2009 |  |
11 | 9 | 3 | 2 | 6 | $77 million | Bill | None | |
2010s
| Year | Map | Number of tropical cyclones | Number of tropical storms | Number of hurricanes | Number of major hurricanes | Deaths | Damage USD | Strongest storm | Retired names | Notes |
|---|---|---|---|---|---|---|---|---|---|---|
| 2010 |  |
21 | 19 | 12 | 5 | 314 | $4.53 billion | Igor | Igor, Tomas | Tied for third most active season on record Tied for second most hurricanes in a season on record Record tying 8 named storms forming in September |
| 2011 | 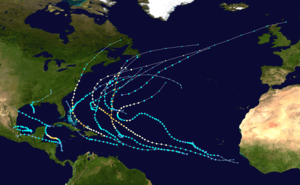 |
20 | 19 | 7 | 4 | 114 | $18.59 billion | Ophelia | Irene | Tied for third most active season on record |
| 2012 |  |
19 | 19 | 10 | 2 | 354 | $77.97 billion | Sandy | Sandy | Tied for third most active season Tied (with 2016) for most active season before July Record tying 8 named storms forming in August |
| 2013 | 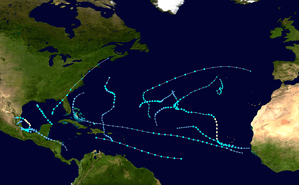 |
15 | 14 | 2 | 0 | 47 | $1.51 billion | Humberto | Ingrid | Includes one subtropical storm No major hurricanes Tied (with 1982) for fewest hurricanes since 1930 |
| 2014 | 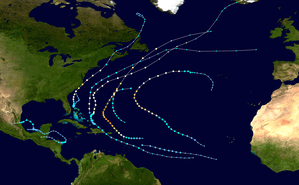 |
9 | 8 | 6 | 2 | 21 | $439.2 million | Gonzalo | None | |
| 2015 | 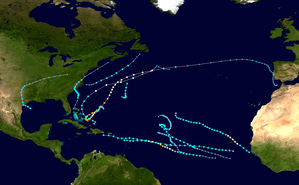 |
12 | 11 | 4 | 2 | 89 | $731.8 million | Joaquin | Erika, Joaquin | |
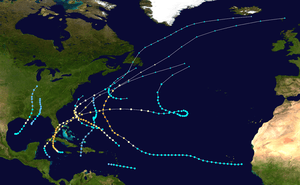
| 2016 |  |
16 | 15 | 7 | 4 | 748 | ≥ $16.1 billion | Matthew | Matthew, Otto | Earliest start since 1938 Record for earliest formation of 3rd and 4th storm Tied (with 2012) for most active season before July Includes southernmost Category 5 on record, and the first since 2007 First hurricane in 20 years to cross Central America into the Eastern Pacific basin |
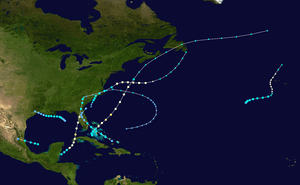
| 2017 |  |
18 | 17 | 10 | 6 | 3,361 | ≥ $282.16 billion | Maria | Harvey, Irma, Maria, Nate | Costliest hurricane season on record First April system since 2003 Earliest Main Development Region named storm on record First U.S. major hurricane landfall since Wilma in 2005 Highest rainfall produced by a tropical cyclone in the United States and its territories First-ever three Category 4 U.S. hurricane landfalls in a single season Second season to feature multiple Category 5 landfalls after 2007 Only one of four seasons to produce ten hurricanes in a row Only season on record with three hurricanes with an ACE value over 40 Most ACE produced in a single month in Atlantic basin |
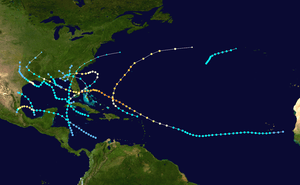
| 2018 |  |
15 | 14 | 7 | 2 | 96 | >53.375 billion | Michael | TBD | Includes a record six subtropical storms Fourth consecutive season for a storm to develop before the official start |
Number of tropical storms and hurricanes per season
This bar chart shows the number of named storms and hurricanes per year from 1851–2018.
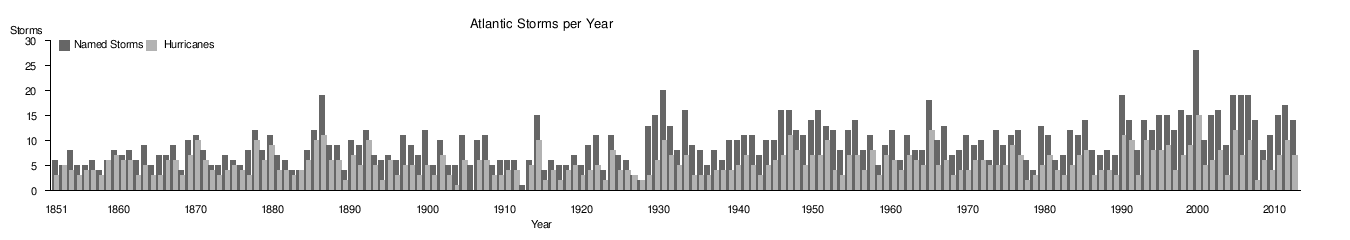
A 2011 study analyzing one of the main sources of hurricanes - the African easterly wave (AEW) - found that the change in AEWs is closely linked to increased activity of intense hurricanes in the North Atlantic. The synoptic concurrence of AEWs in driving the dynamics of the Sahel greening also appears to increase tropical cyclogenesis over the North Atlantic.[18]
Number of storms of each strength since the satellite era
| Season | Tropical Depressions | Named Storms | Hurricanes | Category ≥2 | Major hurricanes (Category ≥3) | Category≥4 | Category 5 |
|---|---|---|---|---|---|---|---|
| 1967 | 29 | 8 | 6 | 2 | 1 | 1 | 1 |
| 1968 | 14 | 8[nb 1] | 5[nb 2] | 0 | 0 | 0 | 0 |
| 1969 | 20 | 18[nb 3] | 12 | 7 | 5 | 1 | 1 |
| 1970 | 19 | 10[nb 4] | 5 | 3 | 2 | 0 | 0 |
| 1971 | 22 | 13 | 6 | 2 | 1 | 1 | 1 |
| 1972 | 19 | 7 | 3 | 1 | 0 | 0 | 0 |
| 1973 | 24 | 8 | 4 | 1 | 1 | 0 | 0 |
| 1974 | 21 | 11[nb 5] | 4 | 3 | 2 | 1 | 0 |
| 1975 | 23 | 9[nb 6] | 6 | 5 | 3 | 1 | 0 |
| 1976 | 23 | 10[nb 7] | 6 | 4 | 2 | 0 | 0 |
| 1977 | 16 | 6 | 5 | 1 | 1 | 1 | 1 |
| 1978 | 24 | 12[nb 8] | 5 | 3 | 2 | 2 | 0 |
| 1979 | 26 | 9[nb 9] | 5[nb 10] | 3 | 2 | 2 | 1 |
| 1980 | 15 | 11 | 9 | 5 | 2 | 1 | 1 |
| 1981 | 22 | 12[nb 11] | 7 | 4 | 3 | 1 | 0 |
| 1982 | 9 | 6[nb 12] | 2 | 1 | 1 | 1 | 0 |
| 1983 | 7 | 4 | 3 | 1 | 1 | 0 | 0 |
| 1984 | 20 | 13[nb 13] | 5 | 2 | 1 | 1 | 0 |
| 1985 | 14 | 11 | 7 | 3 | 3 | 1 | 0 |
| 1986 | 10 | 6 | 4 | 1 | 0 | 0 | 0 |
| 1987 | 14 | 7 | 3 | 1 | 1 | 0 | 0 |
| 1988 | 19 | 12 | 5 | 3 | 3 | 3 | 1 |
| 1989 | 15 | 11 | 7 | 4 | 2 | 2 | 1 |
| 1990 | 16 | 14 | 8 | 2 | 1 | 0 | 0 |
| 1991 | 12 | 8[nb 14] | 4[nb 15] | 3 | 2 | 1 | 0 |
| 1992 | 10 | 7[nb 16] | 4 | 3 | 1 | 1 | 1 |
| 1993 | 10 | 8 | 4 | 2 | 1 | 0 | 0 |
| 1994 | 12 | 7[nb 17] | 3 | 1 | 0 | 0 | 0 |
| 1995 | 21 | 19 | 11 | 8 | 5 | 3 | 0 |
| 1996 | 13[nb 18] | 13[nb 19] | 9[nb 20] | 6 | 6 | 2 | 0 |
| 1997 | 9 | 8[nb 21] | 3 | 1 | 1 | 0 | 0 |
| 1998 | 14 | 14 | 10 | 7 | 3 | 2 | 1 |
| 1999 | 16 | 12 | 8 | 8 | 5 | 5 | 0 |
| 2000 | 19 | 15[nb 22] | 8 | 4 | 3 | 2 | 0 |
| 2001 | 17 | 15 | 9 | 5 | 4 | 2 | 0 |
| 2002 | 14 | 12 | 4 | 3 | 2 | 1 | 0 |
| 2003 | 21 | 16 | 7 | 4 | 3 | 2 | 1 |
| 2004 | 16 | 15 | 9 | 7 | 6 | 4 | 1 |
| 2005 | 31 | 28[nb 23] | 15 | 8 | 7 | 5 | 4 |
| 2006 | 10 | 10[nb 24] | 5 | 2 | 2 | 0 | 0 |
| 2007 | 17 | 15 | 6 | 2 | 2 | 2 | 2 |
| 2008 | 17 | 16 | 8 | 6 | 5 | 4 | 0 |
| 2009 | 11 | 9 | 3 | 3 | 2 | 1 | 0 |
| 2010 | 21 | 19 | 12 | 9 | 5 | 4 | 0 |
| 2011 | 20 | 19 | 7 | 4 | 4 | 2 | 0 |
| 2012 | 19 | 19 | 10 | 5 | 2 | 0 | 0 |
| 2013 | 15 | 14[nb 25] | 2 | 0 | 0 | 0 | 0 |
| 2014 | 9 | 8 | 6 | 3 | 2 | 1 | 0 |
| 2015 | 12 | 11 | 4 | 2 | 2 | 1 | 0 |
| 2016 | 16 | 15[nb 26] | 7 | 4 | 4 | 2 | 1 |
| 2017 | 18[nb 27] | 17[nb 28] | 10 | 8 | 6 | 4 | 2 |
- ↑ This includes one subtropical hurricane that was not named at the time.
- ↑ This includes one subtropical hurricane that was not named at the time.
- ↑ This includes one subtropical storm that was not named at the time.
- ↑ This includes three subtropical storms that were not named at the time.
- ↑ This includes one subtropical storm that was not named at the time.
- ↑ This includes one subtropical storm that was not named at the time.
- ↑ This includes two subtropical storms that were not named at the time.
- ↑ This includes one subtropical storm that was not named at the time.
- ↑ This includes one subtropical hurricane that was not named at the time.
- ↑ This includes one subtropical hurricane that was not named at the time.
- ↑ This includes one subtropical storm that was not named at the time.
- ↑ This includes one subtropical storm that was not named at the time.
- ↑ This includes one subtropical storm that was not named at the time.
- ↑ This includes one tropical hurricane that was not formally named but was nicknamed "the Perfect Storm".
- ↑ This includes one tropical hurricane that was not formally named but was nicknamed "the Perfect Storm".
- ↑ This includes one subtropical storm that was not named at the time.
- ↑ This does not include two additional tropical storm-force cyclones formed late in the season that may have been subtropical or tropical but were each reported by the NHC as extropical.
- ↑ This does not include one subtropical hurricane that formed over the Great Lakes and was not formally named but was nicknamed "Huron".
- ↑ This does not include one subtropical hurricane that formed over the Great Lakes and was not formally named but was nicknamed "Huron".
- ↑ This does not include one subtropical hurricane that formed over the Great Lakes and was not formally named but was nicknamed "Huron".
- ↑ This includes one subtropical storm that was not named at the time.
- ↑ This includes one subtropical storm that was not named at the time.
- ↑ This includes one subtropical storm that was not named at the time.
- ↑ This includes one tropical storm that was not named at the time.
- ↑ This includes one subtropical storm that was not named at the time.
- ↑ This does not include one additional tropical storm-force cyclone over the Bay of Biscay that may have been subtropical but was reported by the NHC as extropical.
- ↑ This does not include one subtropical storm that formed over the Mediterranean Sea and was not reported on by the NHC.
- ↑ This does not include one subtropical storm that formed over the Mediterranean Sea and was not reported on by the NHC.
See also
Parent topics
Atlantic hurricane topics
Other tropical cyclone basins
References
- ↑ Landsea, Chris (contributor from the NHC). "Total and Average Number of Tropical Cylones by Month (1851-2017)". aoml.noaa.gov. National Oceanic and Atmospheric Administration, Atlantic Oceanographic and Meteorological Laboratory. Archived from the original on September 1, 2018.
- 1 2 Atlantic Oceanographic and Meteorological Laboratory, Hurricane Research Division. "Frequently Asked Questions: When is hurricane season?". NOAA. Archived from the original on July 18, 2006. Retrieved July 25, 2006.
- ↑ McAdie, Colin (May 10, 2007). "Tropical Cyclone Climatology". National Hurricane Center. Archived from the original on May 28, 2007. Retrieved June 9, 2007.
- ↑ "Atlantic hurricane best track (HURDAT version 2)". Hurricane Research Division (Database). National Hurricane Center. May 1, 2018. Retrieved October 12, 2018.
- ↑ Associated Press (June 15, 1941). "Hurricane Bureau Begins Season's Vigil Tonight". St. Petersburg Times. Retrieved July 9, 2011.
- 1 2 Associated Press (June 15, 1959). "1959 Hurricane Season Opens Officially Today". Meridian Record. Retrieved July 9, 2011.
- ↑ Associated Press (June 15, 1955). "Hurricane Season Opens; New England Joins Circuit". The Robesonian. Retrieved July 9, 2011.
- 1 2 Associated Press (June 15, 1960). "1960 Hurricane Season Open As Planes Prowl". The Evening Independent. Retrieved July 9, 2011.
- ↑ Neal Dorst (January 21, 2010). "Subject: G1) When is hurricane season ?". National Hurricane Center. Archived from the original on June 28, 2011. Retrieved July 9, 2011.
- ↑ Brownsville Herald (June 1, 1965). Hurricane Season Officially Opened.
- ↑ United Press International (May 30, 1966). "Hurricane Season Opens This Week". The News and Courier. Retrieved July 9, 2011.
- ↑ National Hurricane Center (2011). "Atlantic Graphical Tropical Weather Outlook". National Oceanic and Atmospheric Administration. Archived from the original on June 23, 2011. Retrieved July 9, 2011.
- ↑ United States Department of Commerce (2006). Assessment: Hurricane Katrina, August 23–31, 2005. Retrieved on 2008-09-03.
- ↑ "Archived copy". Archived from the original on October 6, 2008. Retrieved November 5, 2011.
- ↑ Hurricane Research Division (2008). "Chronological List of All Hurricanes which Affected the Continental United States: 1851-2007". National Oceanic and Atmospheric Administration. Retrieved March 21, 2008.
- ↑ Indianola, Texas
- ↑ Dorst, Neal (October 23, 2012). "They Called the Wind Mahina: The History of Naming Cyclones" (PPTX). Hurricane Research Division, Atlantic Oceanographic and Meteorological Laboratory. National Oceanic and Atmospheric Administration. p. Slides 49–51.
- ↑ Wang and Gillies (2011). "Observed Change in Sahel Rainfall, Circulations, African Easterly Waves, and Atlantic Hurricanes Since 1979". doi:10.1155/2011/259529.