Bayfield County, Wisconsin
Bayfield County is the northernmost county in the U.S. state of Wisconsin. As of the 2010 census, the population was 15,014.[1] Its county seat is Washburn.[2] The county was created in 1845 and organized in 1850.[3]
Bayfield County | |
|---|---|
 | |
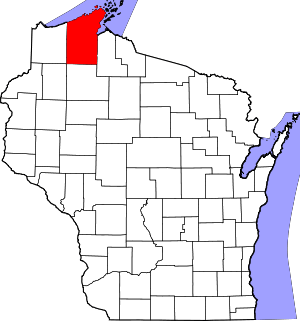 Location within the U.S. state of Wisconsin | |
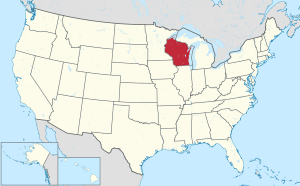 Wisconsin's location within the U.S. | |
| Coordinates: 46°38′N 91°11′W | |
| Country | |
| State | |
| Founded | April 12, 1850 |
| Named for | Henry Bayfield |
| Seat | Washburn |
| Largest city | Washburn |
| Area | |
| • Total | 2,042 sq mi (5,290 km2) |
| • Land | 1,478 sq mi (3,830 km2) |
| • Water | 564 sq mi (1,460 km2) 28% |
| Population (2010) | |
| • Total | 15,014 |
| • Estimate (2018) | 15,042 |
| • Density | 7.4/sq mi (2.8/km2) |
| Time zone | UTC−6 (Central) |
| • Summer (DST) | UTC−5 (CDT) |
| Congressional district | 7th |
| Website | www |
History
Originally, in 1848 it was named La Pointe County, Wisconsin. After Douglas (1854) and Ashland (1860) Counties were split off from the original La Pointe County, the remainder was renamed Bayfield County on April 12, 1866.
Geography
According to the U.S. Census Bureau, the county has a total area of 2,042 square miles (5,290 km2), of which 1,478 square miles (3,830 km2) is land and 564 square miles (1,460 km2) (28%) is water.[4] It is the third-largest county in Wisconsin by total area and second-largest by land area.
Adjacent counties
- Ashland County – east
- Sawyer County – south
- Washburn County – southwest
- Douglas County – west
- Lake County, Minnesota – north
Major highways
|
|
Airport
Cable Union Airport (FAA LID: 3CU) serves Bayfield County and the surrounding communities.
National protected areas
- Apostle Islands National Lakeshore (part)
- Chequamegon National Forest (part)
- Whittlesey Creek National Wildlife Refuge
Demographics
| Historical population | |||
|---|---|---|---|
| Census | Pop. | %± | |
| 1850 | 489 | — | |
| 1860 | 353 | −27.8% | |
| 1870 | 344 | −2.5% | |
| 1880 | 564 | 64.0% | |
| 1890 | 7,390 | 1,210.3% | |
| 1900 | 14,392 | 94.7% | |
| 1910 | 15,987 | 11.1% | |
| 1920 | 17,201 | 7.6% | |
| 1930 | 15,006 | −12.8% | |
| 1940 | 15,827 | 5.5% | |
| 1950 | 13,760 | −13.1% | |
| 1960 | 11,910 | −13.4% | |
| 1970 | 11,683 | −1.9% | |
| 1980 | 13,822 | 18.3% | |
| 1990 | 14,008 | 1.3% | |
| 2000 | 15,013 | 7.2% | |
| 2010 | 15,014 | 0.0% | |
| Est. 2018 | 15,042 | [5] | 0.2% |
| U.S. Decennial Census[6] 1790–1960[7] 1900–1990[8] 1990–2000[9] 2010–2018[1] | |||

As of the 2010 census, there were 15,014 people living in the county. 86.7% were White, 9.6% Native American, 0.3% Asian, 0.3% Black or African American, 0.2% of some other race and 2.9% of two or more races. 1.1% were Hispanic or Latino (of any race).
As of the census[10] of 2000, there were 15,013 people, 6,207 households, and 4,276 families living in the county. The population density was 10 people per square mile (4/km²). There were 11,640 housing units at an average density of 8 per square mile (3/km²). The racial makeup of the county was 88.46% White, 0.13% Black or African American, 9.39% Native American, 0.27% Asian, 0.01% Pacific Islander, 0.26% from other races, and 1.49% from two or more races. 0.61% of the population were Hispanic or Latino of any race. 23.3% were of German, 10.4% Norwegian, 8.4% Swedish, 6.1% Irish, 5.9% Polish, 5.7% Finnish and 5.0% English ancestry. 96.8% spoke English as their first language.
There were 6,207 households out of which 28.90% had children under the age of 18 living with them, 55.90% were married couples living together, 7.80% had a female householder with no husband present, and 31.10% were non-families. 26.40% of all households were made up of individuals and 11.50% had someone living alone who was 65 years of age or older. The average household size was 2.40 and the average family size was 2.88.
In the county, the population was spread out with 24.60% under the age of 18, 5.30% from 18 to 24, 25.20% from 25 to 44, 28.50% from 45 to 64, and 16.40% who were 65 years of age or older. The median age was 42 years. For every 100 females there were 102.20 males. For every 100 females age 18 and over, there were 100.70 males.
In 2017, there were 116 births, giving a general fertility rate of 66.6 births per 1000 women aged 15–44, the 23rd highest rate out of all 72 Wisconsin counties.[11] Additionally, there were fewer than five reported induced abortions performed on women of Bayfield County residence in 2017.[12]
Communities

Cities
- Ashland (mostly in Ashland County)
- Bayfield
- Washburn (county seat)
Village
Towns
Census-designated places
- Cable
- Cornucopia
- Drummond
- Grand View
- Herbster
- Iron River
- Port Wing
Politics
Bayfield County has voted for the Democratic candidate in every presidential election since 1960, except 1972.
| Year | Republican | Democratic | Third parties |
|---|---|---|---|
| 2016 | 42.9% 4,124 | 51.5% 4,953 | 5.6% 535 |
| 2012 | 36.8% 3,603 | 61.6% 6,033 | 1.6% 152 |
| 2008 | 35.5% 3,365 | 63.1% 5,972 | 1.4% 131 |
| 2004 | 38.7% 3,754 | 60.3% 5,845 | 1.0% 100 |
| 2000 | 39.5% 3,266 | 53.6% 4,427 | 6.9% 566 |
| 1996 | 30.7% 2,250 | 53.1% 3,895 | 16.3% 1,195 |
| 1992 | 29.5% 2,393 | 47.7% 3,873 | 22.8% 1,846 |
| 1988 | 41.5% 3,095 | 58.0% 4,323 | 0.5% 40 |
| 1984 | 45.9% 3,474 | 53.3% 4,034 | 0.8% 59 |
| 1980 | 42.1% 3,278 | 47.6% 3,705 | 10.4% 806 |
| 1976 | 39.2% 2,624 | 58.1% 3,885 | 2.8% 184 |
| 1972 | 51.9% 3,045 | 46.7% 2,736 | 1.4% 84 |
| 1968 | 40.9% 2,333 | 53.2% 3,036 | 5.8% 333 |
| 1964 | 32.7% 1,886 | 67.1% 3,875 | 0.3% 16 |
| 1960 | 46.9% 2,841 | 52.7% 3,196 | 0.4% 23 |
| 1956 | 53.3% 3,096 | 46.4% 2,691 | 0.3% 19 |
| 1952 | 56.0% 3,419 | 42.8% 2,616 | 1.2% 72 |
| 1948 | 40.1% 2,338 | 52.8% 3,081 | 7.1% 416 |
| 1944 | 42.0% 2,475 | 57.1% 3,362 | 0.9% 53 |
| 1940 | 38.5% 2,829 | 59.8% 4,387 | 1.7% 126 |
| 1936 | 31.1% 2,071 | 65.5% 4,366 | 3.4% 226 |
| 1932 | 38.1% 2,035 | 55.9% 2,981 | 6.0% 319 |
| 1928 | 63.4% 3,279 | 33.1% 1,709 | 3.5% 183 |
| 1924 | 36.4% 1,675 | 4.5% 205 | 59.1% 2,720 |
| 1920 | 73.3% 2,536 | 17.0% 589 | 9.6% 333 |
| 1916 | 51.1% 1,320 | 38.6% 996 | 10.3% 267 |
| 1912 | 23.0% 514 | 29.8% 666 | 47.1% 1,052 |
| 1908 | 70.3% 1,957 | 20.8% 579 | 8.9% 249 |
| 1904 | 85.0% 2,665 | 11.2% 350 | 3.9% 121 |
| 1900 | 76.9% 2,428 | 20.0% 632 | 3.0% 96 |
| 1896 | 72.6% 2,244 | 24.9% 770 | 2.5% 78 |
| 1892 | 50.5% 1,467 | 46.4% 1,349 | 3.1% 89 |
See also
References
- "State & County QuickFacts". United States Census Bureau. Archived from the original on July 6, 2011. Retrieved January 17, 2014.
- "Find a County". National Association of Counties. Archived from the original on July 4, 2012. Retrieved June 7, 2011.
- "Wisconsin: Individual County Chronologies". Wisconsin Atlas of Historical County Boundaries. The Newberry Library. 2007. Retrieved August 12, 2015.
- "2010 Census Gazetteer Files". United States Census Bureau. August 22, 2012. Retrieved August 2, 2015.
- "Population and Housing Unit Estimates". Retrieved July 26, 2019.
- "U.S. Decennial Census". United States Census Bureau. Retrieved August 2, 2015.
- "Historical Census Browser". University of Virginia Library. Retrieved August 2, 2015.
- Forstall, Richard L., ed. (March 27, 1995). "Population of Counties by Decennial Census: 1900 to 1990". United States Census Bureau. Retrieved August 2, 2015.
- "Census 2000 PHC-T-4. Ranking Tables for Counties: 1990 and 2000" (PDF). United States Census Bureau. April 2, 2001. Retrieved August 2, 2015.
- "U.S. Census website". United States Census Bureau. Retrieved May 14, 2011.
- "Annual Wisconsin Birth and Infant Mortality Report, 2017 P-01161-19 (June 2019): Detailed Tables". Archived from the original on June 19, 2019. Retrieved June 20, 2019.
- Reported Induced Abortions in Wisconsin, Office of Health Informatics, Division of Public Health, Wisconsin Department of Health Services. Section: Trend Information, 2013-2017, Table 18, pages 17-18
- Leip, David. "Dave Leip's Atlas of U.S. Presidential Elections". uselectionatlas.org. Retrieved April 11, 2018.
Further reading
External links
| Wikimedia Commons has media related to Bayfield County, Wisconsin. |
- Bayfield County government website
- Bayfield County Economic Development Corporation
- Bayfield County map from the Wisconsin Department of Transportation
Places adjacent to Bayfield County, Wisconsin | ||||||||||
|---|---|---|---|---|---|---|---|---|---|---|
| ||||||||||
Municipalities and communities of Bayfield County, Wisconsin, United States | ||
|---|---|---|
| Cities | | |
| Village | ||
| Towns | ||
| CDPs | ||
| Unincorporated communities | ||
| Indian reservation | ||
| Footnotes | ‡This populated place also has portions in an adjacent county or counties | |
| Authority control |
|
|---|