List of U.S. states and territories by carbon dioxide emissions
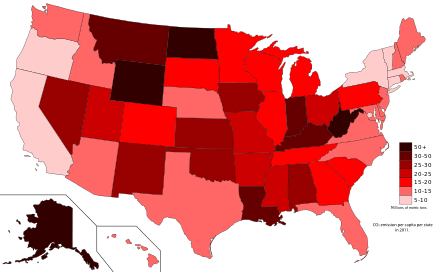
This is a list of U.S. states and territories by carbon dioxide emissions due to human activity. The data presented below is from the U.S. Energy Information Administration (2016 data).[1][2]
The Northern Mariana Islands is not ranked in the table below because there is no data for that territory.[note 1] The Northern Mariana Islands is the only state/territory with no carbon dioxide emissions data.
The region with the highest total carbon dioxide emissions is Texas, and the region with the lowest total carbon dioxide emissions is American Samoa. The region with the highest per capita carbon dioxide emissions is Wyoming, and the region with the lowest per capita carbon dioxide emissions is the District of Columbia.
Table
| Rank | Jurisdiction | Annual CO2 emissions in 2016 (in millions of metric tons)[1][note 2] |
Percentage of total emissions [note 3] |
Population (estimate in 2016)[3] |
Percentage of total population[note 4] |
CO2 emissions per capita (in metric tons) |
Annual CO2emissions in 2016
per 1000 sq. miles (in millions of |
|---|---|---|---|---|---|---|---|
| - | States, D.C. and territories total |
5,214.58 [note 5] | 100% | 326,912,174 [note 6] | 100% | 15.95 [note 7] | 1.472 |
| - | States and D.C. Total | 5,189.4 | 99.51% [note 8] | 323,127,513 | 98.84% [note 9] | 16.059 | 1.467 |
| 1 | 657.4 | 12.7% | 27,862,596 | 8.52% | 23.59 | 2.5 | |
| 2 | 363.3 | 7.0% | 39,250,017 | 12.006% | 9.256 | 2.3 | |
| 3 | 231.3 | 4.5% | 20,612,439 | 6.305% | 11.22 | 4.3 | |
| 4 | 218.6 | 4.2% | 12,784,227 | 3.91% | 17.09 | 4.9 | |
| 5 | 210.3 | 4.1% | 4,681,666 | 1.43% | 44.919 | 4.8 | |
| 6 | 207.4 | 4.0% | 11,614,373 | 3.55% | 17.857 | 5.1 | |
| 7 | 205.2 | 4.0% | 12,801,539 | 3.915% | 16.029 | 3.7 | |
| 8 | 182.9 | 3.5% | 6,633,053 | 2.029% | 27.57 | 5.1 | |
| 9 | 164.6 | 3.2% | 19,745,289 | 6.039% | 8.33 | 3.5 | |
| 10 | 152.6 | 2.9% | 9,928,300 | 3.036% | 15.37 | 2.7 | |
| 11 | 137.0 | 2.6% | 10,310,371 | 3.153% | 13.287 | 2.4 | |
| 12 | 124.6 | 2.4% | 4,436,974 | 1.357% | 28.082 | 3.1 | |
| 13 | 121.2 | 2.3% | 10,146,788 | 3.103% | 11.944 | 2.5 | |
| 14 | 118.3 | 2.3% | 6,093,000 | 1.863% | 19.415 | 1.7 | |
| 15 | 115.7 | 2.2% | 4,863,300 | 1.487% | 23.79 | 2.3 | |
| 16 | 111.4 | 2.1% | 8,944,469 | 2.736% | 12.454 | 15 | |
| 17 | 104.8 | 2.0% | 8,411,808 | 2.573% | 12.458 | 2.6 | |
| 18 | 103.6 | 2.0% | 6,651,194 | 2.034% | 15.57 | 2.5 | |
| 19 | 97.4 | 1.9% | 3,923,561 | 1.20% | 24.824 | 1.4 | |
| 20 | 96.1 | 1.9% | 5,778,708 | 1.767% | 16.63 | 1.8 | |
| 21 | 95.1 | 1.8% | 1,831,102 | 0.56% | 51.935 | 3.9 | |
| 22 | 89.7 | 1.7% | 5,519,952 | 1.688% | 16.25 | 1.1 | |
| 23 | 89.5 | 1.7% | 5,540,545 | 1.694% | 16.153 | 0.9 | |
| 24 | 87.5 | 1.7% | 6,931,071 | 2.12% | 12.624 | 0.8 | |
| 25 | 79.3 | 1.5% | 7,288,000 | 2.229% | 10.88 | 1.2 | |
| 26 | 73.5 | 1.4% | 3,134,693 | 0.958% | 23.44 | 1.3 | |
| 27 | 72.1 | 1.4% | 4,961,119 | 1.517% | 14.53 | 2.4 | |
| 28 | 69.3 | 1.3% | 2,988,726 | 0.914% | 23.187 | 1.5 | |
| 29 | 64.5 | 1.2% | 6,811,779 | 2.083% | 9.468 | 8.2 | |
| 30 | 62.8 | 1.2% | 2,988,248 | 0.914% | 21.015 | 1.2 | |
| 31 | 62.4 | 1.2% | 2,907,289 | 0.889% | 21.46 | 0.8 | |
| 32 | 61.0 | 1.2% | 585,501 | 0.179% | 104.184 | 0.6 | |
| 33 | 59.1 | 1.1% | 3,051,207 | 0.933% | 19.369 | 0.7 | |
| 34 | 57.9 | 1.1% | 6,016,447 | 1.84% | 9.623 | 5.9 | |
| 35 | 54.6 | 1.1% | 757,952 | 0.231% | 72.036 | 0.8 | |
| 36 | 48.8 | 0.9% | 1,907,116 | 0.583% | 25.588 | 0.6 | |
| 37 | 48.7 | 0.9% | 2,081,015 | 0.636% | 23.402 | 0.4 | |
| 38 | 38.2 | 0.7% | 4,093,465 | 1.252% | 9.331 | 0.4 | |
| 39 | 36.9 | 0.7% | 2,940,058 | 0.899% | 12.55 | 0.3 | |
| 40 | 35.1 | 0.7% | 741,894 | 0.226% | 47.311 | 0.1 | |
| 41 | 34.5 | 0.7% | 3,576,452 | 1.094% | 9.646 | 7.1 | |
| 42 | 30.6 | 0.6% | 1,042,520 | 0.318% | 29.351 | 0.2 | |
| 43 | 19.8 | 0.38% | 3,411,307 | 1.043% | 5.818 | 3.7 | |
| 44 | 18.5 | 0.4% | 1,428,557 | 0.436% | 12.95 | 2.9 | |
| 45 | 18.5 | 0.4% | 1,683,140 | 0.514% | 10.991 | 0.2 | |
| 46 | 16.6 | 0.3% | 1,331,479 | 0.407% | 12.467 | 0.5 | |
| 47 | 15.1 | 0.3% | 865,454 | 0.264% | 17.447 | 0.2 | |
| 48 | 13.8 | 0.3% | 1,334,795 | 0.408% | 10.338 | 1.5 | |
| 49 | 13.4 | 0.3% | 952,065 | 0.291% | 14.074 | 6.9 | |
| 50 | 9.8 | 0.2% | 1,056,426 | 0.323% | 9.276 | 9.5 | |
| 51 | 6.0 | 0.1% | 624,594 | 0.191% | 9.606 | 0.6 | |
| 52 | 2.8 | 0.1% | 681,170 | 0.208% | 4.11 | 41.2 | |
| 53 | 2.764 | 0.053% | 102,951 | 0.0314% | 26.847 | 20.6 | |
| 54 | 2.214 | 0.042% | 162,742 | 0.049% | 13.604 | 10.4 | |
| 55 | 0.361 | 0.0069% | 54,194 | 0.0165% | 6.663 | 4.7 | |
| — | No data | No data | 53,467 | 0.0163% | No data | No data |
Source for territories (population): CIA World Factbook (2016 web.archive.org captures) for 2016 populations,[4][note 10] plus 2019 versions of the CIA World Factbook which contain 2017 carbon dioxide data for four of the five territories[5][6][7][8]
See also
- Greenhouse gas emissions by the United States
- Climate change
- Comparisons of life-cycle greenhouse gas emissions
- Global warming
- List of countries by carbon dioxide emissions
- List of countries by greenhouse gas emissions
- List of countries by carbon dioxide emissions per capita
- List of countries by greenhouse gas emissions per capita
- List of companies by carbon dioxide emissions per year
Notes
General
- The 'States and D.C. Total' value represents the sum of CO
2 emissions from the 50 U.S. states plus the District of Columbia. This value differs from total U.S. CO2 emissions from fossil fuel combustion reported in the Inventory of U.S. Greenhouse Gas Emissions and Sinks. The U.S. inventory value is larger because it includes emissions from U.S. territories and protectorates; it also uses a different approach for estimating emissions from non-energy uses of fossil fuels (which are not included in the combustion-related values shown in this table). - Nationally, CO2 emissions from fossil fuel combustion represented the largest source (76%) of total GWP–weighted emissions from all emission sources in 2014.[2] Similarly, CO2 emissions from fossil fuel combustion are the largest source of greenhouse gas emissions within a state.[2]
- Numbers for territories include only fossil fuel numbers — they do not include petroleum, natural gas, and coal numbers.<-- should the U.S. territories include these numbers?—>
Specific
- The CIA World Factbook does not have any information about CO2 emissions in their Northern Mariana Islands page, and the EIA lists carbon dioxide emissions for the Northern Mariana Islands as “NA” (Not Available).
- Territories data is from 2017.
- Total emissions is for the 50 states and District of Columbia only. Percentages for states are out of the 50 states and District of Columbia. Percentages for territories are the percent they would be if territories were included in the total.
- The total population is the 50 states, District of Columbia, and 5 inhabited self-governing territories. (Percentages for each state/territory use the 326,912,174 number as the total.)
- Total is for the 50 states, the District of Columbia, American Samoa, Guam, Puerto Rico and U.S. Virgin Islands. Does not include the Northern Mariana Islands (no data for the Northern Mariana Islands).
- 2016 populations: 323,127,513 (50 states + DC) + 54,194 (AS) + 162,742 (GU) + 53,467 (MP) + 3,411,307 (PR) + 102,951 (VI) — 50 states, DC & Puerto Rico data from Census; other territories data from CIA World Factbook (2016 web.archive.org captures).
- Because the Northern Mariana Islands has no data, the per capita number uses the total population minus the Northern Mariana Islands population (i.e. 326,858,707 total).
- If only the 50 states and D.C. are included, total is 100%. If counting the 50 states, D.C. and territories, the total for only the states and D.C. (out of that group) is 99.5%.
- If including only the states and D.C., percent is 100%. If the total is for states, D.C. and territories, the percent for only states and D.C. (out of that group) is 98.84%
- Puerto Rico 2016 population derived from Census, not CIA World Facebook
References
- https://www.eia.gov/state/data.php?sid=US
Eia.gov. (Note: The URL is for total US data. To see data of an individual state, change the two-letter abbreviation at end of URL to the state’s abbreviation, such as AL for Alabama, or AQ / GQ / CQ / RQ / VQ for the territories.) Retrieved June 2019. - "U.S. Greenhouse Gas Inventory Report: 1990-2014". US Environmental Protection Agency. Retrieved 14 September 2016.
- https://factfinder.census.gov/faces/tableservices/jsf/pages/productview.xhtml?src=bkmk Archived 2016-10-19 at the Wayback Machine American FactFinder. Annual Estimates of the Resident Population. April 1, 2010 to July 1, 2016. 2016 Population Estimates. Retrieved June 2019.
- https://web.archive.org/web/20161011002629/https://www.cia.gov/library//publications/the-world-factbook/geos/aq.html
https://web.archive.org/web/20161011000037/https://www.cia.gov/library//publications/the-world-factbook/geos/gq.html
https://web.archive.org/web/20161011002151/https://www.cia.gov/library//publications/the-world-factbook/geos/cq.html
https://web.archive.org/web/20161011002006/https://www.cia.gov/library//publications/the-world-factbook/geos/vq.html
CIA World Factbook (web.archive.org captures) — American Samoa, Guam, Northern Mariana Islands, U.S. Virgin Islands. Retrieved July 3, 2019. - https://www.cia.gov/library/publications/resources/the-world-factbook/geos/aq.html
The CIA World Factbook. American Samoa. Retrieved July 3, 2019. - https://www.cia.gov/library/publications/resources/the-world-factbook/geos/gq.html
CIA World Factbook — Guam. Retrieved July 3, 2019. - https://www.cia.gov/library/publications/resources/the-world-factbook/geos/rq.html CIA World Factbook — Puerto Rico. Retrieved July 3, 2019.
- https://www.cia.gov/library/publications/resources/the-world-factbook/geos/vq.html CIA World Factbook — U.S. Virgin Islands. Retrieved July 3, 2019.
External links
- EPA website
- Energy CO2 Emissions by State
- Energy-Related Carbon Dioxide Emissions by State, 2000-2015
- Interactive graphs and maps of the 2014 data on Tableau Public
Tableau Public Chart of the 2014 data on Tableau Public