Greenhouse gas emissions by the United States
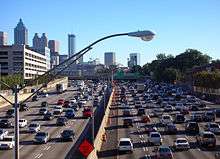
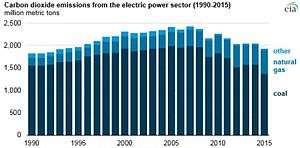
The United States produced 5.4 billion metric tons of carbon dioxide equivalent greenhouse gas (GHG) emissions in 2018,[1] the second largest in the world after China and among the worst countries by greenhouse gas emissions per person. Because coal-fired power stations are gradually shutting down, in the 2010s emissions from electricity generation fell to second place behind transportation, which is now the largest single source.[2]
General
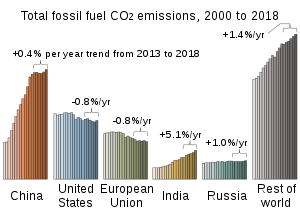
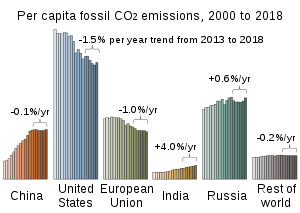
2 emissions in China and the rest of world have eclipsed the output of the United States and Europe.[3]
While the Bush administration opted against Kyoto-type policies to reduce emissions, the Obama administration and various state, local, and regional governments attempted to adopt some Kyoto Protocol goals on a local basis. For example, the Regional Greenhouse Gas Initiative (RGGI), founded in 2007, is a state-level emissions capping and trading program by nine northeastern U.S. states.
The US.State Department offered a nation-level perspective in the Fourth US Climate Action Report (USCAR) to the United Nations Framework Convention on Climate Change, including measures to address climate change.[4]
According to a 2016 study US methane emissions were underestimated by the EPA for at least a decade, by some 30 to 50 percent.[5]
2018
In February 2018, an explosion and blowout in a natural gas well in Belmont County, Ohio was detected by the Copernicus Sentinel-5P satellite's Tropospheric Monitoring Instrument. The well was owned by XTO Energy. About 30 homes were evacuated, and brine and produced water were discharged into streams flowing into the Ohio River.
The blowout lasted 20 days, releasing more than 50,000 tons of methane into the atmosphere. The blowout leaked more methane than is discharged by most European nations in a year from their oil and gas industries.[6][7][8][9]
Carbon emissions by categories
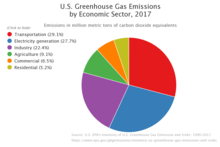
The largest source of emissions in 2017 was transportation at 29%, followed by electricity generation at 28% and industry at 22%.[10]
Individual action
Recommended actions individuals can take on climate change include limiting miles flown and driven, and the amount of beef eaten;[11] and registering and voting.[12]
Reporting requirement
Since 2011 the USEPA's Mandatory Reporting of Greenhouse Gases rule, requires thousands of companies in the US to monitor and report their greenhouse gas emissions.[13]
A detailed inventory of fossil fuel CO
2 emissions is provided by the Project Vulcan.[14]
Strategy and measures to address climate change
Near-term measures
Transportation
As of 2011, 71% of petroleum consumed in the US was used for transportation.[15]
Programs to reduce greenhouse gas emissions from the transportation sector:
- CAFE:
- The Corporate Average Fuel Economy (CAFE) program requires automobile manufacturers to meet average fuel economy standards for the light-duty vehicles, large passenger vans and SUVs sold in the United States. Fuel economy standards vary according to the size of the vehicle.
- SmartWay
- Renewable Fuel Standard:
- Under the Energy Policy Act of 2005, United States Environmental Protection Agency is responsible for promulgating regulations to ensure that gasoline sold in the United States contains a specific volume of renewable fuel.[15]
- FreedomCAR and Fuel Partnership and Vehicle Technologies Program:
- The program[16] works jointly with DOE's hydrogen, fuel cell, and infrastructure R&D efforts and the efforts to develop improved technology for hybrid electric vehicle, which include the hybrid electric components (such as batteries and electric motors).
- The U.S. government uses six "criteria pollutants" as indicators of air quality: ozone, carbon monoxide, sulfur dioxide, nitrogen dioxides, particulate matter, and lead and does not include carbon dioxide and other greenhouse gases.
- Clean Cities[17]
- Congestion Mitigation and Air Quality Improvement (CMAQ) Program.[18]
- Aircraft Fuel Efficiency:
- Aviation yields GHG emissions that have the potential to influence global climate. In the United States, aviation makes up about 3% of the national GHG inventory and about 12% of transportation emissions. Currently, measuring and tracking fuel efficiency from aircraft operations provide the data for assessing the improvements in aircraft and engine technology, operational procedures, and the airspace transportation system that reduce aviation's contribution to CO 2 emissions. In the near term, new technologies to improve air traffic management will help reduce fuel burn and, thus, emissions. In the long term, new engines and aircraft will feature more efficient components and aircraft aerodynamics, enhanced engine cycles, and reduced weight, thereby improving fuel efficiency.
- Biomass and Biorefinery Systems Program[19]
Energy: residential and commercial sectors
- EPA Clean Energy Programs - Energy Star
- Commercial Building Integration[20] and Residential Building Integration (Build America).[21]
- Weatherization Assistance Program[22]
- State Energy Program[23]
As of 2010, buildings in the United States consume roughly 48% of the country's electricity and contribute a similar percentage of GHG.[24]
Energy: industrial sector
- Energy Star for industry
- Industrial Technologies Program (ITP)[25]
Energy: supply
_(43797645490).png)
- Wind power in the United States[26]
- Solar power in the United States[27]
- Geothermal power in the United States[28]
- Biofuel in the United States:[29]
- Distributed generation[30]
- EPA Clean Energy Programs - Green Power Partnership[31]
- EPA Clean Energy Programs - Combined Heat and Power Partnership[32]
- Carbon Capture and Storage Research Program[33]
Industry: non-CO2 GHGs
- Methane Programs [37]
- Environmental Stewardship —The objective of this initiative is to limit emissions of HFCs, PFCs, and SF6 in three industrial applications: semiconductor production, electric power distribution, and magnesium production.
- HFC-23 —To reduce HFC-23 emissions from the manufacture of the ozone-depleting substance HCFC-22
Agriculture
Waste management
- WasteWise to encourage recycling and source reduction.
Cross-sectoral
- Authorized under Section 1605(b) of the Energy Policy Act of 1992, this voluntary program provides a means for utilities, industries, and other entities to establish a public record of their emissions and the results of voluntary measures to reduce, avoid, or sequester GHG emission
Nonfederal policies and measures
State initiatives
- Vehicle Air Pollution (SR 27)- States and implies that California Senate does not have to adhere to cutbacks in emissions standards further allowing stricter emissions standards than the federal government for the state of California.[38] Under this senate resolution the current administration or other federal powers will be opposed by California in any reduction or cutback of the Clean Air Act policies that are currently in place; allowing California to have higher emissions and air quality standards. This policy is because of the threat by the current administration's efforts to reverse environmental policies, in this case vehicle emissions standards.[39] This opposition of federal policy changes is allowed through California's Clean Air Act preemption waiver granted to the state by the EPA on July 8, 2009.[40] California's waiver applies to vehicles made in 2009 and later.[40] The current standard being followed by the state is a goal of all vehicles reaching an average of 35 miles per gallon.[Environmental protection Agency Federal Register / Vol. 74, No. 129 / 1][40] California saw a large decline in vehicle emissions from 2007 to 2013 as well as a rise in emissions following 2013 which can be attributed to different circumstances some of which include increased population, increased employment, increase in overall state GDP meaning more productivity in the state.[41]
- Vehicle Registration: Environmental Rebates (SB 745)- Establishes a rebate for any transportation improvement fee on a vehicle. This Senate Bill allots funds from the Greenhouse Gas Reduction Fund to the Climate Policy Special rebate fund and which are then transferred to the department of motor vehicles to pay for newly registered vehicles or renewed vehicles. According to the policy the cost per vehicle is to be displayed in the registration paperwork.[38]
Regional initiatives
- Western Climate Initiative
- As of 2015, the Regional Greenhouse Gas Initiative includes Connecticut, Delaware, Maine, Maryland, Massachusetts, New Hampshire, New York, Rhode Island, and Vermont. It is a cap and trade program in which states "sell nearly all emission allowances through auctions and invest proceeds in energy efficiency, renewable energy and other consumer benefit programs".[42]
- Western Governors Association Clean and Diversified Energy Initiative
- Powering the Plains[43]
- Carbon Sequestration Regional Partnerships[44]
- U.S. Mayors Climate Protection Agreement
- National Governors Association (NGA)´s Securing a Clean Energy Future.[45]
- In 2007 NGA announced plans to expand statewide regulations on GHG emissions and clean energy initiatives. Governors Tim Pawlenty of Minnesota and Kathleen Sebelius of Kansas led a task force along with six other governors to promote renewable energy, conservation, and a reduction in GHG emissions through statewide policies. The US Department of Energy provided $610,000 in support for this initiative.
- As chairman of NGA, Governor Tim Pawlenty (R-MN) said that on energy issues, "We have a federal government that doesn't seem to want to move as fast or as bold as many would like." With states creating their own emissions standards, Pawlenty said, there will be a push for the federal government to come up with a nationwide energy policy to address global warming. If enough states act to reduce GHG emissions, it would "become a de facto national policy".[46]
Climate action plans
Lead by example programs
Long-term measures
- Carbon Sequestration Regional Partnerships[44]
- Nuclear:
- Generation IV Nuclear Energy Systems Initiative
- Nuclear Hydrogen Initiative
- Advanced Fuel Cycle Initiative
- Global Nuclear Energy Partnership
- Clean Automotive Technology
- Hydrogen Technology[49]
- and High-temperature superconductivity
International measures
See also
- Climate Registry
- Coal in the United States
- Energy conservation in the United States
- Greenhouse gas emissions in Kentucky
- List of countries by carbon dioxide emissions
- List of U.S. states by carbon dioxide emissions
- Phase-out of fossil fuel vehicles
- Politics of global warming
- Post–Kyoto Protocol negotiations on greenhouse gas emissions
- Regulation of Greenhouse Gases Under the Clean Air Act
- Select Committee on Energy Independence and Global Warming
- U.S. Climate Change Science Program
References
- Rattner, Emma Newburger,Nate (2019-12-15). "'Any growth is more than we can afford': Carbon dioxide pollution hits record high as planet warms". CNBC. Retrieved 2019-12-15.
- EPA,OA, US (2015-12-29). "Sources of Greenhouse Gas Emissions - US EPA". US EPA. Retrieved 19 April 2018.
- Friedlingstein et al. 2019, Table 7.
- "Fourth Climate Action Report to the UN Framework Convention on Climate Change". 2009-2017.state.gov. Retrieved 2020-04-22.
- "US methane emissions are drastically underestimated, a new study shows". PRI. 2016.
- "Exxon's XTO caps leaking Ohio gas well, 20 days after blowout". Reuters. 2018-03-07. Retrieved 2019-12-24.
- Pandey, Sudhanshu; Gautam, Ritesh; Houweling, Sander; Gon, Hugo Denier van der; Sadavarte, Pankaj; Borsdorff, Tobias; Hasekamp, Otto; Landgraf, Jochen; Tol, Paul; Kempen, Tim van; Hoogeveen, Ruud (2019-12-12). "Satellite observations reveal extreme methane leakage from a natural gas well blowout". Proceedings of the National Academy of Sciences. doi:10.1073/pnas.1908712116. ISSN 0027-8424. PMC 6936547. PMID 31843920.
- Falconer, Rebecca (December 17, 2009). "Satellite reveals Ohio gas well blowout to be a massive methane "super-emitter"". Axios. Retrieved 2019-12-24.
- European Space Agency (2019-12-20). "Massive Methane Leak Visible From Space". SciTechDaily. Retrieved 2019-12-24.
- US EPA, OAR (2015-12-29). "Sources of Greenhouse Gas Emissions". US EPA. Retrieved 2020-03-03.
- "Carbon Footprint Factsheet - Center for Sustainable Systems". css.umich.edu. Retrieved 19 April 2018.
- Frankel, Jeffrey (2020-01-20). "The best way to help the climate is to increase the price of CO2 emissions | Jeffrey Frankel". The Guardian. ISSN 0261-3077. Retrieved 2020-01-20.
- EPA,OEI, US. "Page being updated" (PDF). www.epa.gov. Retrieved 19 April 2018.
- Gurney, Kevin. "The Vulcan Project - Index". vulcan.project.asu.edu. Retrieved 19 April 2018.
- US Energy Information Administration, Primary energy by source and sector, 2011, PDF.
- "EERE: Vehicle Technologies Program Home Page". Archived from the original on 2007-09-25. Retrieved 2007-09-11.
- "Clean Cities Coalition Network: Building Partnerships to Advance Affordable, Domestic Transportation Fuels and Technologies". Archived from the original on April 27, 2007.
- "CMAQ - Air Quality - Environment - FHWA". www.fhwa.dot.gov. Retrieved 19 April 2018.
- "EERE: Biomass Program Home Page". Archived from the original on 2007-09-13. Retrieved 2007-09-11.
- "DOE: High Performance Buildings". Archived from the original on 2007-09-03. Retrieved 2007-09-11.
- "Building Technologies Program: Building America". Archived from the original on 2006-03-05. Retrieved 2007-09-11.
- "Weatherization Assistance Program". Archived from the original on 2008-08-29. Retrieved 2008-09-24.
- "EERE: State Energy Program Home Page". Archived from the original on 2007-09-25. Retrieved 2007-09-11.
- Mazria, Ed. "2030 Challenge". Archived from the original on 2009-12-24.
- "Industrial Technologies Program BestPractices". Archived from the original on 2010-08-27. Retrieved 2007-09-11.
- "Wind and Hydropower Technologies Program: Wind Energy Research". Archived from the original on 2007-08-27. Retrieved 2007-09-11.
- "Office of Energy Efficiency & Renewable Energy | Department of Energy". Eere.energy.gov. Retrieved 2018-07-11.
- "EERE: Geothermal Technologies Program Home Page". Archived from the original on 2007-09-25. Retrieved 2007-09-11.
- "EERE: Biomass Program Home Page". Archived from the original on 2007-09-13. Retrieved 2007-09-11.
- "OE: Distributed Energy Program Home Page". Archived from the original on 2007-09-29. Retrieved 2007-09-11.
- "Green Power Partnership". www.epa.gov. U.S. Environmental Protection Agency. Retrieved 28 July 2014.
- "Combined Heat and Power Partnership". www.epa.gov. U.S. Environmental Protection Agency. Retrieved 28 July 2014.
- "Carbon Capture and Storage Research". Energy.gov. U.S. Department of Energy, Office of Fossil Energy. Retrieved 28 July 2014.
- "Advanced Energy Systems Program". NETL website. National Energy Technology Laboratory, U.S. Department of Energy. Retrieved 28 July 2014.
- "Carbon Capture". NETL website. National Energy Technology Laboratory, U.S. Department of Energy. Retrieved 28 July 2014.
- "Carbon Storage Technology". NETL website. National Energy Technology Laboratory, U.S. Department of Energy. Retrieved 28 July 2014.
- US EPA, OAR (June 26, 2018). "What the U.S. is Doing in the Global Methane Initiative". US EPA. Retrieved 2019-12-24.
- Board, California Air Resources. "Air Quality Legislation". www.arb.ca.gov. Retrieved 2018-09-07.
- "California Senate approves Wieckowski Clean Air Act resolution". Senator Bob Wieckowski. 2017-04-03. Retrieved 2018-09-07.
- EPA; OAR; OTAQ (2016-10-14). "California Greenhouse Gas Waiver Request | US EPA". US EPA. Retrieved 2018-09-07.
- "California's Greenhouse Gas Emission Inventory". www.arb.ca.gov. Retrieved 2018-09-07.
- "Welcome". Regional Greenhouse Gas Initiative, Inc. n.d. Retrieved 9 February 2015.
- "Powering the Plains: Energy Transition Roadmap" (PDF). GPI website. Great Plains Institute. Retrieved 28 July 2014.
- "Regional Carbon Sequestration Partnerships". NETL website. National Energy Technology Laboratory, U.S. Department of Energy. Retrieved 28 July 2014.
- National Governors Association]. "2007-2008 NGA Chair's Initiative". Archived from the original on 2007-10-27.
- "NGA Officially Launches Chair's Initiative: Securing a Clean Energy Future". 2007-09-12. Archived from the original on 2007-10-27. Retrieved 2007-09-17.
- Jay, Kate (November 14, 2008). "First Carbon Neutral Zone Created in the United States". Reuters. Archived from the original on September 7, 2009.
- Auchmutey, Jim (January 26, 2009). "Trying on carbon-neutral trend". Atlanta Journal-Constitution.
- "Technologies for Hydrogen Production". Gasifipedia. National Energy Technology Laboratory, U.S. Department of Energy. Retrieved 28 July 2014.
External links
| Wikisource has original text related to this article: |
- Live carbon emissions from electricity generation in some states
- U.S. Emissions Data (Energy Information Administration).
Greenhouse gas emissions by the Americas | ||
|---|---|---|
| ||
| Sovereign states |
| .svg.png) |
| ||