List of U.S. states and territories by income
This is a list of U.S. states, territories and the District of Columbia by income.
| This article is part of a series on |
| Income in the United States of America |
|---|
 |
|
Lists by income
|
|
|
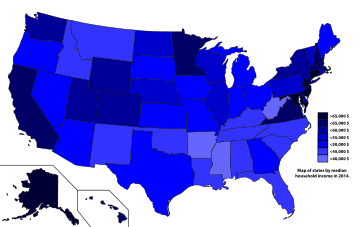
States and territories ranked by median household income
Data for the states, the District of Columbia and Puerto Rico is from the American Community Survey (Note that table does not reflect the margin of error in the values).[1] ACS data is unavailable for American Samoa, Guam, the Northern Mariana Islands and the U.S. Virgin Islands; data for those territories is from 2010.[note 1]
| Rank | State or territory | 2018 | 2017 | 2016 | 2015 | 2014[note 2] |
|---|---|---|---|---|---|---|
| 1 | $85,203 | $82,372 | $75,506 | $75,628 | $71,648 | |
| 2 | $83,242 | $80,776 | $78,945 | $75,847 | $73,971 | |
| 3 | $81,740 | $80,088 | $76,126 | $72,222 | $71,919 | |
| 4 | $80,212 | $77,765 | $74,511 | $73,486 | $69,592 | |
| 5 | $79,835 | $77,385 | $75,297 | $70,628 | $69,160 | |
| 6 | $76,348 | $74,168 | $73,433 | $71,346 | $70,048 | |
| 7 | $75,277 | $71,805 | $67,739 | $64,500 | $61,933 | |
| 8 | $74,991 | $73,381 | $70,936 | $70,303 | $66,532 | |
| 9 | $74,346 | $73,181 | $76,440 | $73,355 | $71,583 | |
| 10 | $74,073 | $70,979 | $67,106 | $64,129 | $61,366 | |
| 11 | $72,577 | $71,535 | $68,114 | $66,262 | $64,902 | |
| 12 | $71,953 | $69,117 | $65,685 | $63,909 | $61,303 | |
| 13 | $71,414 | $65,358 | $65,977 | $62,912 | $60,922 | |
| 14 | $70,315 | $68,388 | $65,599 | $63,488 | $61,481 | |
| 15 | $67,844 | $64,894 | $62,909 | $60,850 | $58,878 | |
| 16 | $65,030 | $62,992 | $60,960 | $59,588 | $57,444 | |
| 17 | $64,805 | $62,852 | $61,757 | $61,255 | $59,716 | |
| 18 | $64,340 | $63,870 | $60,596 | $58,073 | $54,891 | |
| 19 | $63,837 | $61,843 | $60,656 | $60,557 | $59,029 | |
| 20 | $63,426 | $60,212 | $57,532 | $54,148 | $51,075 | |
| — | $63,179 | $60,336 | $57,617 | $55,775 | $53,657 | |
| 21 | $61,584 | $60,434 | $59,882 | $60,214 | $57,055 | |
| 22 | $60,905 | $59,105 | $56,907 | $55,702 | $53,234 | |
| 23 | $60,782 | $57,513 | $57,677 | $56,990 | $54,166 | |
| 24 | $60,773 | $59,305 | $56,811 | $55,638 | $52,622 | |
| 25 | $60,629 | $59,206 | $56,565 | $55,653 | $53,035 | |
| 26 | $59,955 | $58,570 | $56,247 | $54,736 | $53,712 | |
| 27 | $59,566 | $59,970 | $56,927 | $54,996 | $52,686 | |
| 28 | $59,246 | $56,581 | $53,558 | $51,492 | $50,068 | |
| 29 | $58,756 | $56,183 | $53,559 | $51,244 | $49,321 | |
| 30 | $58,646 | $58,003 | $55,180 | $52,431 | $51,450 | |
| 31 | $58,218 | $56,422 | $54,935 | $53,906 | $52,504 | |
| 32 | $56,697 | $54,909 | $52,491 | $51,084 | $49,847 | |
| 33 | $56,274 | $56,521 | $54,467 | $53,017 | $50,979 | |
| 34 | $56,111 | $54,021 | $52,344 | $51,075 | $49,308 | |
| 35 | $55,746 | $54,181 | $52,314 | $50,532 | $49,446 | |
| 36 | $55,602 | $55,277 | $53,079 | $51,494 | $49,462 | |
| 37 | $55,583 | $52,225 | $51,807 | $48,275 | $47,861 | |
| 38 | $55,462 | $52,594 | $50,860 | $49,426 | $47,463 | |
| 39 | $55,328 | $53,386 | $50,027 | $49,509 | $46,328 | |
| 40 | $54,478 | $53,578 | $51,746 | $50,238 | $48,363 | |
| 41 | $53,855 | $52,752 | $50,584 | $47,830 | $46,556 | |
| 42 | $52,375 | $51,340 | $48,547 | $47,275 | $44,361 | |
| 43 | $52,306 | $50,570 | $49,501 | $47,238 | $45,238 | |
| 44 | $51,924 | $50,051 | $49,176 | $48,568 | $47,529 | |
| 45 | $50,247 | $48,375 | $46,659 | $45,215 | $42,958 | |
| 46 | $49,861 | $48,123 | $46,257 | $44,765 | $42,830 | |
| 47 | — | — | — | — | $48,274[3] | |
| 48 | $47,905 | $46,145 | $45,146 | $45,727 | $44,555 | |
| 49 | $47,169 | $46,744 | $46,748 | $45,382 | $44,803 | |
| 50 | $47,062 | $45,869 | $44,334 | $41,995 | $41,262 | |
| 51 | $44,717 | $43,529 | $41,754 | $40,593 | $39,680 | |
| 52 | $44,097 | $43,469 | $43,385 | $42,019 | $41,059 | |
| 53 | — | — | — | — | $37,254[4] | |
| 54 | — | — | — | — | $23,892[5] | |
| 55 | — | — | — | — | $19,958[6] | |
| 56 | $20,296 | $19,343 | $20,078 | $18,626 | $18,928 |
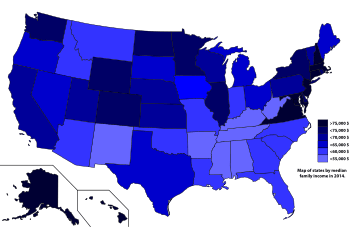
States and territories ranked by per capita income
Most data is from the 2010 to 2014 American Community Survey 1-Year Estimates.[7][8][note 3]
| Rank | State or territory | Per capita income |
Median household income |
Median family income |
Population | Number of households |
Number of families |
|---|---|---|---|---|---|---|---|
| 1 | $45,877 | $71,648 | $84,094 | 658,893 | 277,378 | 117,864 | |
| 2 | $39,373 | $70,048 | $88,819 | 3,596,677 | 1,355,817 | 887,263 | |
| 3 | $37,288 | $69,160 | $87,951 | 8,938,175 | 2,549,336 | 1,610,581 | |
| 4 | $36,593 | $71,919 | $88,419 | 6,938,608 | 3,194,844 | 2,203,675 | |
| 5 | $36,338 | $73,971 | $89,678 | 5,976,407 | 2,165,438 | 1,445,972 | |
| 6 | $34,691 | $66,532 | $80,581 | 1,326,813 | 519,756 | 345,901 | |
| 7 | $34,052 | $64,902 | $78,290 | 8,326,289 | 3,083,820 | 2,058,820 | |
| 8 | $33,095 | $58,878 | $71,115 | 19,746,227 | 7,282,398 | 4,621,954 | |
| 9 | $33,071 | $59,029 | $75,221 | 739,482 | 305,431 | 187,800 | |
| 10 | $33,062 | $71,583 | $82,307 | 736,732 | 249,659 | 165,015 | |
| 11 | $32,638 | $61,481 | $77,941 | 5,457,173 | 2,129,195 | 1,369,594 | |
| 12 | $32,357 | $61,303 | $75,405 | 5,355,866 | 2,039,592 | 1,315,283 | |
| 13 | $31,841 | $61,366 | $74,193 | 7,061,530 | 2,679,601 | 1,725,099 | |
| 14 | $30,830 | $54,891 | $71,212 | 1,055,173 | 409,654 | 257,165 | |
| 15 | $30,488 | $59,716 | $72,594 | 935,614 | 349,743 | 233,000 | |
| 16 | $30,441 | $61,933 | $71,015 | 38,802,500 | 12,758,648 | 8,762,059 | |
| 17 | $30,417 | $57,444 | $71,796 | 12,880,580 | 4,772,421 | 3,099,184 | |
| 18 | $29,736 | $69,592 | $79,187 | 1,419,561 | 450,769 | 314,151 | |
| 19 | $29,698 | $57,055 | $72,460 | 584,153 | 232,594 | 149,032 | |
| 20 | $29,220 | $53,234 | $67,876 | 12,787,209 | 4,945,972 | 3,185,054 | |
| 21 | $29,178 | $54,166 | $67,154 | 626,562 | 257,229 | 162,017 | |
| $28,889 | $53,657 | $65,910 | 318,857,056 | 117,259,427 | 77,152,072 | ||
| 22 | $28,361 | $53,712 | $67,771 | 3,107,126 | 1,241,471 | 801,562 | |
| 23 | $28,213 | $52,622 | $67,187 | 5,757,564 | 2,307,685 | 1,485,877 | |
| 24 | $27,978 | $49,462 | $62,078 | 1,330,089 | 549,841 | 344,585 | |
| 25 | $27,870 | $52,504 | $66,425 | 2,904,021 | 1,109,280 | 728,602 | |
| 26 | $27,646 | $51,075 | $62,670 | 3,970,239 | 1,535,511 | 966,250 | |
| 27 | $27,446 | $52,686 | $66,120 | 1,881,503 | 740,765 | 480,317 | |
| 28 | $27,125 | $53,035 | $62,830 | 26,956,958 | 9,277,197 | 6,407,165 | |
| 29 | $26,959 | $50,979 | $66,936 | 853,175 | 334,475 | 211,235 | |
| 30 | $26,937 | $49,308 | $62,300 | 11,594,163 | 4,593,172 | 2,923,523 | |
| 31 | $26,613 | $49,847 | $62,143 | 9,909,877 | 3,834,574 | 2,485,159 | |
| 32 | $26,582 | $47,463 | $57,212 | 19,893,297 | 7,328,046 | 4,693,411 | |
| 33 | $26,126 | $48,363 | $61,299 | 6,063,589 | 2,354,809 | 1,508,816 | |
| 34 | $25,989 | $46,328 | $60,643 | 1,023,579 | 410,962 | 251,176 | |
| 35 | $25,774 | $46,556 | $57,380 | 9,943,964 | 3,790,620 | 2,492,048 | |
| 36 | $25,773 | $51,450 | $60,824 | 2,839,099 | 1,021,519 | 642,461 | |
| 37 | $25,715 | $50,068 | $59,700 | 6,731,484 | 2,428,743 | 1,579,481 | |
| 38 | $25,615 | $49,321 | $58,885 | 10,097,343 | 3,587,521 | 2,426,392 | |
| 39 | $25,229 | $47,529 | $58,710 | 3,878,051 | 1,459,759 | 966,516 | |
| 40 | $25,140 | $49,446 | $60,780 | 6,596,855 | 2,502,739 | 1,657,223 | |
| 41 | $24,922 | $44,361 | $55,557 | 6,549,352 | 2,509,665 | 1,660,344 | |
| 42 | $24,877 | $60,922 | $69,535 | 2,942,902 | 918,370 | 691,495 | |
| 43 | $24,800 | $44,555 | $56,573 | 4,649,676 | 1,718,194 | 1,112,659 | |
| 44 | $24,596 | $45,238 | $56,491 | 4,832,482 | 1,826,914 | 1,201,616 | |
| 45 | $23,938 | $47,861 | $58,101 | 1,634,464 | 591,587 | 407,499 | |
| 46 | $23,684 | $42,958 | $54,776 | 4,413,457 | 1,712,094 | 1,124,586 | |
| 47 | $23,683 | $44,803 | $54,705 | 2,085,572 | 760,916 | 489,532 | |
| 48 | $23,606 | $42,830 | $53,764 | 4,849,377 | 1,841,217 | 1,232,515 | |
| 49 | $22,883 | $41,262 | $51,528 | 2,966,369 | 1,131,288 | 752,212 | |
| 50 | $22,714 | $41,059 | $52,413 | 1,850,326 | 735,375 | 472,869 | |
| 51 | $21,362 | $37,254 | $45,058 | 106,405 | 43,214 | 26,237 | |
| 52 | $21,036 | $39,680 | $50,178 | 2,994,079 | 1,095,823 | 738,463 | |
| 53 | $16,549 | $48,274 | $50,607 | 162,742 | 42,026 | 34,199 | |
| 54 | $12,081 | $19,775 | $23,793 | 3,195,153 | 1,222,606 | 850,665 | |
| 55 | $9,656 | $19,958 | $22,455 | 53,833 | 16,035 | 10,714 | |
| 56 | $6,311 | $23,892 | $24,706 | 55,519 | 9,688 | 8,834 |
Source for American Samoa, Guam, Northern Mariana Islands and U.S. Virgin Islands: American FactFinder.[3]
About Washington, D.C. and territories
Washington, D.C. and the inhabited U.S. territories (Puerto Rico, the U.S. Virgin Islands, Guam, the Northern Mariana Islands and American Samoa) are not formally U.S. states, but their residents are U.S. citizens (except for American Samoa — people born in American Samoa are non-citizen U.S. nationals).[9] Puerto Rico has a higher population than 21 U.S. states, while Washington, D.C. has a higher population than 2 U.S. states.
See also
- List of countries by average wage
- List of U.S. states by median wage
- Highest-income counties in the United States
- Personal income in the United States
- Household income in the United States
- List of the poorest places in the United States
- Thank God for Mississippi
Notes
- The U.S. Census Bureau collects data for the 50 states, the District of Columbia and Puerto Rico every year (in American Community Survey estimates). However, the U.S. Census Bureau collects data for American Samoa, Guam, the Northern Mariana Islands and the U.S. Virgin Islands only once every 10 years.[2]
- Territories data (except Puerto Rico) is from 2010.
- Data for American Samoa, Guam, the Northern Mariana Islands and the U.S. Virgin Islands is from the 2010 U.S. Census (American FactFinder). Puerto Rico data is from the 2013-2017 American Community Survey 5-year estimates.
References
- "S1901: INCOME IN THE PAST 12 MONTHS (IN 2018 INFLATION-ADJUSTED DOLLARS)". data.census.gov. December 19, 2019. Retrieved December 20, 2019.
- https://www.hhs.gov/sites/default/files/section-1557-top-15-languages-faqs.pdf Hhs.gov. Section 1557 FAQs. Retrieved July 5, 2019.
- American FactFinder. Profile of Selected Economic Characteristics: 2010. 2010 American Samoa / Guam / Northern Mariana Islands Demographic Profile Data. Retrieved July 5, 2019.
- https://www.ruralhealthinfo.org/states/us-virgin-islands Ruralhealthinfo.org. U.S. Virgin Islands. Retrieved October 6, 2018.
- https://www.ruralhealthinfo.org/states/american-samoa Ruralhealthinfo.org. American Samoa. Retrieved October 6, 2018.
- https://www.ruralhealthinfo.org/states/northern-mariana Ruralhealthinfo.org. Northern Mariana Islands. Retrieved October 6, 2018.
- "SELECTED ECONOMIC CHARACTERISTICS 2010-2014 American Community Survey 1-Year Estimates". U.S. Census Bureau. Archived from the original on 2020-02-14. Retrieved 2016-02-12.
- "ACS DEMOGRAPHIC AND HOUSING ESTIMATES 2010-2014 American Community Survey 1-Year Estimates". U.S. Census Bureau. Archived from the original on 2020-02-14. Retrieved 2016-02-12.
- https://harvardlawreview.org/2017/04/american-samoa-and-the-citizenship-clause/ American Samoa and the Citizenship Clause: A Study in Insular Cases Revisionism. Chapter 3. Harvard Law Review. Retrieved October 6, 2018.