List of U.S. states by non-Hispanic white population
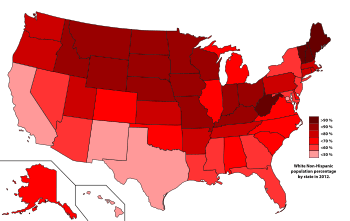
This is a list of U.S. states by non-Hispanic white population. The United States Census Bureau defines non-Hispanic white as white Americans who are not of Hispanic or Latino ancestry (i.e., having ancestry from Spain or Latin America).[1] At 197.2 million in 2012, non-Hispanic whites comprise 62.8% of the total U.S. population.[2][3]
Population by state or territory
| State/Territory | Pop 1990 | % pop 1990 | Pop 2000 | % pop 2000 | Pop 2010 | % pop 2010 | Pop 2012 | % pop 2012 | % growth 2000-2012 | % pop 1990-2012 |
|---|---|---|---|---|---|---|---|---|---|---|
| 2,960,167 | 73.3% | 3,125,819 | 70.3% | 3,204,402 | 67.0% | 3,212,468 | 66.6% | +2.8% | -6.7 pp | |
| 406,722 | 73.9% | 423,788 | 67.6% | 455,320 | 64.1% | 460,453 | 63.0% | +8.7% | -10.9 pp | |
| 2,626,185 | 71.7% | 3,274,258 | 63.8% | 3,695,647 | 57.8% | 3,730,370 | 56.9% | +13.9% | -14.8 pp | |
| 1,933,082 | 82.2% | 2,100,135 | 78.6% | 2,173,469 | 74.5% | 2,179,168 | 73.9% | +3.8% | -8.3 pp | |
| 17,029,126 | 57.2% | 15,816,790 | 46.7% | 14,956,253 | 40.1% | 14,904,055 | 39.2% | -5.8% | -18.0 pp | |
| 2,658,945 | 80.7% | 3,202,880 | 74.5% | 3,520,793 | 70.0% | 3,599,838 | 69.4% | +12.4% | -11.3 pp | |
| 2,754,184 | 83.8% | 2,638,845 | 77.5% | 2,546,262 | 71.2% | 2,512,773 | 70.0% | -4.8% | -13.8 pp | |
| 528,092 | 79.3% | 567,973 | 72.5% | 586,752 | 65.3% | 589,642 | 64.3% | +3.8% | -15.0 pp | |
| 166,131 | 27.4% | 159,178 | 27.8% | 209,464 | 34.8% | 222,975 | 35.3% | +40.1% | +7.9 pp | |
| 9,475,326 | 73.2% | 10,458,509 | 65.4% | 10,884,722 | 57.9% | 10,966,711 | 56.8% | +4.9% | -16.4 pp | |
| 4,543,425 | 70.1% | 5,128,661 | 62.6% | 5,413,920 | 55.9% | 5,460,416 | 55.0% | +6.5% | -15.1 pp | |
| 347,644 | 31.4% | 277,091 | 22.9% | 309,343 | 22.7% | 317,032 | 22.8% | +14.4% | -8.6 pp | |
| 928,661 | 92.2% | 1,139,291 | 88.0% | 1,316,243 | 84.0% | 1,330,942 | 83.4% | +16.8% | -8.8 pp | |
| 8,550,208 | 74.8% | 8,424,140 | 67.8% | 8,167,753 | 63.7% | 8,093,687 | 62.9% | -3.9% | -11.9 pp | |
| 4,965,242 | 89.6% | 5,219,373 | 85.8% | 5,286,453 | 81.5% | 5,289,249 | 80.9% | +1.3% | -8.7 pp | |
| 2,663,840 | 95.9% | 2,710,344 | 92.6% | 2,701,123 | 88.7% | 2,705,704 | 88.0% | -0.2% | -7.9 pp | |
| 2,190,524 | 88.4% | 2,233,997 | 83.1% | 2,230,539 | 78.2% | 2,234,826 | 77.4% | 0.0% | -11.0 pp | |
| 3,378,022 | 91.7% | 3,608,013 | 89.3% | 3,745,655 | 86.3% | 3,760,302 | 85.8% | +4.2% | -5.9 pp | |
| 2,776,022 | 65.8% | 2,794,391 | 62.5% | 2,734,884 | 60.3% | 2,748,748 | 59.7% | -1.6% | -6.1 pp | |
| 1,203,357 | 98.0% | 1,230,297 | 96.5% | 1,254,297 | 94.4% | 1,250,688 | 94.1% | +1.7% | -3.9 pp | |
| 3,326,109 | 69.6% | 3,286,547 | 62.1% | 3,157,958 | 54.7% | 3,166,263 | 53.8% | -3.7% | -15.8 pp | |
| 5,280,292 | 87.8% | 5,198,359 | 81.9% | 4,984,800 | 76.1% | 5,003,798 | 75.3% | -3.7% | -12.6 pp | |
| 7,649,951 | 82.3% | 7,806,691 | 78.6% | 7,569,939 | 76.6% | 7,523,647 | 76.1% | -3.6% | -6.2 pp | |
| 4,101,266 | 93.7% | 4,337,143 | 88.2% | 4,405,142 | 83.1% | 4,424,944 | 82.3% | +2.0% | -11.4 pp | |
| 1,624,198 | 63.1% | 1,727,908 | 60.7% | 1,722,287 | 58.0% | 1,717,214 | 57.5% | -0.6% | -5.6 pp | |
| 4,448,465 | 86.9% | 4,686,474 | 83.8% | 4,850,748 | 81.0% | 4,848,758 | 80.5% | +3.5% | -6.4 pp | |
| 733,878 | 91.8% | 807,823 | 89.5% | 868,628 | 87.8% | 876,782 | 87.2% | +8.5% | -4.6 pp | |
| 1,460,095 | 92.5% | 1,494,494 | 87.3% | 1,499,753 | 82.1% | 1,509,066 | 81.3% | +1.0% | -11.2 pp | |
| 946,357 | 78.7% | 1,303,001 | 65.2% | 1,462,081 | 54.1% | 1,455,200 | 52.7% | +11.7% | -26.0 pp | |
| 1,079,484 | 97.3% | 1,175,252 | 95.1% | 1,215,050 | 92.3% | 1,212,389 | 91.8% | +3.2% | -5.5 pp | |
| 5,718,966 | 74.0% | 5,557,209 | 66.0% | 5,214,878 | 59.3% | 5,134,994 | 57.9% | -7.6% | -16.1 pp | |
| 764,164 | 50.4% | 813,495 | 44.7% | 833,810 | 40.5% | 827,066 | 39.7% | +1.7% | -10.7 pp | |
| 12,460,189 | 69.3% | 11,760,981 | 62.0% | 11,304,247 | 58.3% | 11,227,534 | 57.4% | -4.5% | -11.9 pp | |
| 4,971,127 | 75.0% | 5,647,155 | 70.2% | 6,223,995 | 65.3% | 6,292,533 | 64.5% | +11.4% | -10.5 pp | |
| 601,592 | 94.2% | 589,149 | 91.7% | 598,007 | 88.9% | 616,194 | 88.1% | +4.6% | -6.1 pp | |
| 9,444,622 | 87.1% | 9,538,111 | 84.0% | 9,359,263 | 81.1% | 9,309,291 | 80.6% | -2.4% | -6.5 pp | |
| 2,547,588 | 81.0% | 2,556,368 | 74.1% | 2,575,381 | 68.7% | 2,585,779 | 67.8% | +1.2% | -13.2 pp | |
| 2,579,732 | 90.8% | 2,857,616 | 83.5% | 3,005,848 | 78.5% | 3,026,649 | 77.6% | +5.9% | -13.2 pp | |
| 10,422,058 | 87.7% | 10,322,455 | 84.1% | 10,094,652 | 79.5% | 10,035,953 | 78.6% | -2.8% | -9.1 pp | |
| 896,109 | 89.3% | 858,433 | 81.9% | 803,685 | 76.4% | 791,560 | 75.4% | -7.8% | -13.9 pp | |
| 2,390,056 | 68.5% | 2,652,291 | 66.1% | 2,962,740 | 64.1% | 3,016,843 | 63.9% | +13.7% | -4.6 pp | |
| 634,788 | 91.2% | 664,585 | 88.0% | 689,502 | 84.7% | 698,504 | 83.8% | +5.1% | -7.4 pp | |
| 4,027,631 | 82.6% | 4,505,930 | 79.2% | 4,800,782 | 75.6% | 4,840,886 | 75.0% | +7.4% | -7.6 pp | |
| 10,291,680 | 60.6% | 10,933,313 | 52.4% | 11,397,345 | 45.3% | 11,554,528 | 44.3% | +5.7% | -16.3 pp | |
| 1,571,254 | 91.2% | 1,904,265 | 85.3% | 2,221,719 | 80.4% | 2,278,904 | 79.8% | +19.7% | -11.4 pp | |
| 552,184 | 98.1% | 585,431 | 96.2% | 590,223 | 94.3% | 588,138 | 94.0% | +0.5% | -4.3 pp | |
| 4,701,650 | 76.0% | 4,965,637 | 70.2% | 5,186,450 | 64.8% | 5,234,502 | 63.9% | +5.4% | -12.1 pp | |
| 4,221,622 | 86.7% | 4,652,490 | 78.9% | 4,876,804 | 72.5% | 4,927,042 | 71.4% | +5.9% | -15.3 pp | |
| 1,718,896 | 95.8% | 1,709,966 | 94.6% | 1,726,256 | 93.2% | 1,721,901 | 92.8% | +0.7% | -3.0 pp | |
| 4,464,677 | 91.3% | 4,681,630 | 87.3% | 4,738,411 | 83.3% | 4,738,842 | 82.8% | +1.2% | -8.5 pp | |
| 412,711 | 91.0% | 438,799 | 88.9% | 483,874 | 85.9% | 487,672 | 84.6% | +11.1% | -6.4 pp | |
| 682 | 1.2% | 611 | 1.1% | -10.4% | ||||||
| 10,666 | 6.9% | 11,001 | 6.9% | +3.1% | ||||||
| 1,274 | 1.8% | 916 | 1.7% | -28.1% | ||||||
| 33,966 | 0.9% | 26,946 | 0.7% | 23,542 | 0.6% | -30.7% | ||||
| 8,580 | 7.9% | 3,830 | 3.6% | -55.3% | ||||||
| 188,128,296 | 75.6% | 194,552,774 | 69.1% | 196,817,552 | 63.7% | 197,243,423 | 62.8% | +1.4% | –11.9 pp |
In 2012, in 37 out of the 50 U.S. states non-Hispanic whites made up a greater percentage of the state's population than the U.S. overall share of 62.8%; however, the 13 states with greater shares of non-whites include the four most populous states (California, Texas, New York, and Florida). Also, note that while the total non-Hispanic white population has grown since 2000 in 36 out of the 50 states, the relative share of non-Hispanic whites in the overall state population has declined in all 50 states during that same time period.
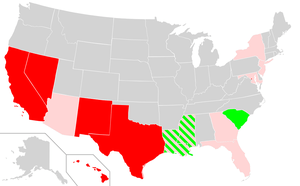
As of 2012, four states are majority-minority: Hawaii, California, New Mexico, and Texas, in addition to the District of Columbia and all 5 inhabited territories.
Historical population by state or territory
| State/Territory | 1910 | 1920 | 1930 | 1940 | 1950 | 1960 | 1970 | 1980 | 1990 | 2000 | 2010 |
|---|---|---|---|---|---|---|---|---|---|---|---|
| 65.3% | 73.3% | 73.3% | 73.3% | 70.3% | 67.0% | ||||||
| 48.3% | 77.2% | 75.8% | 73.9% | 67.6% | 64.1% | ||||||
| 65.1% | 74.3% | 74.5% | 71.7% | 63.8% | 57.8% | ||||||
| 75.2% | 81.0% | 82.2% | 82.2% | 78.6% | 74.5% | ||||||
| 89.5% | 76.3% | 66.6% | 57.2% | 46.7% | 40.1% | ||||||
| 90.3% | 84.6% | 82.7% | 80.7% | 74.5% | 70.0% | ||||||
| 97.9% | 91.4% | 88.0% | 83.8% | 77.5% | 71.2% | ||||||
| 86.4% | 84.1% | 81.3% | 79.3% | 72.5% | 65.3% | ||||||
| 71.4% | 26.5% | 25.7% | 27.4% | 27.8% | 34.8% | ||||||
| 71.5% | 77.9% | 76.7% | 73.2% | 65.4% | 57.9% | ||||||
| 65.2% | 73.4% | 71.6% | 70.1% | 62.6% | 55.9% | ||||||
| 31.5% | 38.0% | 31.1% | 31.4% | 22.9% | 22.7% | ||||||
| 98.4% | 95.9% | 93.9% | 92.2% | 88.0% | 84.0% | ||||||
| 94.7% | 83.5% | 78.0% | 74.8% | 67.8% | 63.7% | ||||||
| 96.3% | 91.7% | 90.2% | 89.6% | 85.8% | 81.5% | ||||||
| 99.2% | 98.0% | 96.9% | 95.9% | 92.6% | 88.7% | ||||||
| 95.6% | 92.7% | 90.5% | 88.4% | 83.1% | 78.2% | ||||||
| 92.5% | 92.4% | 91.7% | 91.7% | 89.3% | 86.3% | ||||||
| 63.7% | 68.2% | 67.6% | 65.8% | 62.5% | 60.3% | ||||||
| 99.7% | 99.1% | 98.3% | 98.0% | 96.5% | 94.4% | ||||||
| 83.3% | 80.4% | 73.9% | 69.6% | 62.1% | 54.7% | ||||||
| 98.6% | 95.4% | 92.3% | 87.8% | 81.9% | 76.1% | ||||||
| 95.7% | 87.1% | 84.1% | 82.3% | 78.6% | 76.6% | ||||||
| 99.0% | 97.7% | 96.1% | 93.7% | 88.2% | 83.1% | ||||||
| 50.6% | 62.6% | 63.6% | 63.1% | 60.7% | 58.0% | ||||||
| 93.4% | 88.6% | 87.7% | 86.9% | 83.8% | 81.0% | ||||||
| 96.2% | 94.7% | 93.4% | 91.8% | 89.5% | 87.8% | ||||||
| 98.2% | 95.2% | 94.0% | 92.5% | 87.3% | 82.1% | ||||||
| 91.6% | 86.7% | 83.2% | 78.7% | 65.2% | 54.1% | ||||||
| 99.9% | 99.1% | 98.4% | 97.3% | 95.1% | 92.3% | ||||||
| 94.3% | 84.7% | 79.1% | 74.0% | 66.0% | 59.3% | ||||||
| 50.9% | 53.8% | 52.6% | 50.4% | 44.7% | 40.5% | ||||||
| 94.6% | 80.1% | 75.0% | 69.3% | 62.0% | 58.3% | ||||||
| 71.9% | 76.5% | 75.3% | 75.0% | 70.2% | 65.3% | ||||||
| 98.3% | 96.9% | 95.5% | 94.2% | 91.7% | 88.9% | ||||||
| 95.0% | 89.8% | 88.2% | 87.1% | 84.0% | 81.1% | ||||||
| 89.9% | 88.1% | 85.0% | 81.0% | 74.1% | 68.7% | ||||||
| 98.6% | 95.8% | 93.3% | 90.8% | 83.5% | 78.5% | ||||||
| 95.1% | 90.3% | 89.1% | 87.7% | 84.1% | 79.5% | ||||||
| 98.3% | 96.1% | 93.4% | 89.3% | 81.9% | 76.4% | ||||||
| 57.1% | 69.0% | 68.3% | 68.5% | 66.1% | 64.1% | ||||||
| 96.2% | 94.6% | 92.3% | 91.2% | 88.0% | 84.7% | ||||||
| 82.5% | 83.7% | 83.1% | 82.6% | 79.2% | 75.6% | ||||||
| 74.1% | 69.6% | 65.7% | 60.6% | 52.4% | 45.3% | ||||||
| 98.2% | 93.6% | 92.4% | 91.2% | 85.3% | 80.4% | ||||||
| 99.7% | 99.2% | 98.5% | 98.1% | 96.2% | 94.3% | ||||||
| 75.3% | 80.1% | 78.2% | 76.0% | 70.2% | 64.8% | ||||||
| 97.7% | 93.6% | 90.2% | 86.7% | 78.9% | 72.5% | ||||||
| 93.7% | 95.7% | 95.6% | 95.8% | 94.6% | 93.2% | ||||||
| 99.2% | 95.6% | 93.6% | 91.3% | 87.3% | 83.3% | ||||||
| 95.9% | 92.1% | 92.0% | 91.0% | 88.9% | 85.9% | ||||||
| 0.9% | 0.7% |
See also
- Demographics of the United States
- Lists of U.S. cities with non-white majority populations
- List of U.S. cities with non-Hispanic white plurality populations in 2010
- List of U.S. states by African-American population
- List of U.S. states by Hispanic and Latino population
References
- U.S. Census Bureau definition of race Archived January 4, 2011, at the Wayback Machine
- "Whites Account for Under Half of Births in U.S."
- "2012 American Community Survey 1-Year Estimates". American FactFinder, U.S. Census Bureau. Archived from the original on 12 February 2020. Retrieved 23 March 2014.
- "2010 U.S. Census website". United States Census Bureau. Retrieved 2016-07-10.
- "Historical Census Statistics on Population Totals By Race, 1790 to 1990, and By Hispanic Origin, 1970 to 1990, For The United States, Regions, Divisions, and States". Census.gov. Archived from the original on July 25, 2008. Retrieved September 15, 2012.
- https://www.census.gov/prod/2001pubs/mso01-wp.pdf
- https://www.census.gov/prod/cen2010/briefs/c2010br-05.pdf