List of U.S. states by American Human Development Index
This article presents a sortable table of U.S. states sorted by their American Human Development Index, according to Measure of America. The data were taken from the American Human Development Report.
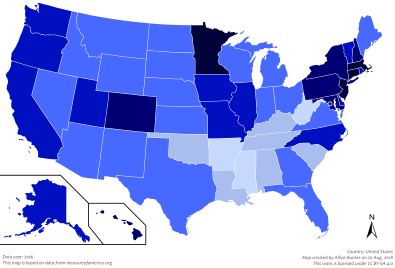
A map of the American Human Development Index within the United States (2016).Legend:
> 6.0
< 6.0
< 5.5
< 5.0
< 4.5
< 4.0
The territories of the United States are listed separately (they were not included in Measure of America's report); the territories data is from a different source (based on United Nations Development Programme), which uses a different numbering system.[1]
States and federal district
| Rank | State/federal district | American HDI | ||
|---|---|---|---|---|
| 2015/2016 values for 2016 [2] |
Change compared to 2008/2009 values for 2005 [2] |
2015/2016 values for 2016 [2] |
Change compared to 2008/2009 values for 2005 [2] | |
| 1 | 6.18 | |||
| 2 | 6.17 | |||
| 3 | 6.12 | |||
| 4 | 6.10 | |||
| 5 | 5.94 | |||
| 6 | 5.73 | |||
| 7 | 5.72 | |||
| 8 | 5.66 | |||
| 9 | 5.53 | |||
| 10 | 5.53 | |||
| 11 | 5.42 | |||
| 12 | 5.40 | |||
| 13 | 5.40 | |||
| 14 | 5.38 | |||
| 15 | 5.31 | |||
| 16 | 5.31 | |||
| 17 | 5.22 | |||
| 18 | 5.19 | |||
| 19 | 5.17 | |||
| 20 | 5.11 | |||
| 21 | 5.06 | |||
| 22 | 5.03 | |||
| 23 | 5.03 | |||
| 24 | 4.96 | |||
| 25 | 4.93 | |||
| 26 | 4.90 | |||
| 27 | 4.89 | |||
| 28 | 4.87 | |||
| 29 | 4.83 | |||
| 30 | 4.82 | |||
| 31 | 4.79 | |||
| 32 | 4.76 | |||
| 33 | 4.71 | |||
| 34 | 4.65 | |||
| 35 | 4.63 | |||
| 36 | 4.62 | |||
| 37 | 4.59 | |||
| 38 | 4.58 | |||
| 39 | 4.56 | |||
| 40 | 4.54 | |||
| 41 | 4.52 | |||
| 42 | 4.50 | |||
| 43 | 4.35 | |||
| 44 | 4.22 | |||
| 45 | 4.14 | |||
| 46 | 4.12 | |||
| 47 | 4.04 | |||
| 48 | 4.02 | |||
| 49 | 3.95 | |||
| 50 | 3.91 | |||
| 51 | 3.81 | |||
Territories
| Territory[1] | HDI | Data Year | Status |
|---|---|---|---|
| 0.901 | 2008 | Very High human development | |
| 0.894 | 2008 | Very High human development | |
| 0.875 | 2008 | Very High human development | |
| 0.845[3] | 2015 | Very High human development | |
| 0.827 | 2008 | Very High human development |
See also
- List of U.S. states by Human Development Index
- List of U.S. states by GDP per capita
- List of U.S. congressional districts by life expectancy
- Measure of America
- Thank God for Mississippi
References
- http://www.unescap.org/sites/default/files/wp-09-02.pdf Filling Gaps In The Human Development Index: Findings For Asia And The Pacific. David A. Hastings. Retrieved 8 January 2018.
- "HDI Map". American Human Development Project of the Social Science Research Council. Retrieved December 28, 2016.
- https://ceterisparibusuprm.org/human-development-index-trends-and-inequality-in-puerto-rico-2010-2015-by-ricardo-r-fuentes-ramirez/ Fuentes-Ramírez, Ricardo R. (2017). Ceteris Paribus: Journal of Socio-Economic Research. 7. Retrieved 8 January 2018.
External links
- Correlation of Human Development Index with Google Searches in different U.S. states
- Best States to Live in the USA Global Report (Statistics & Facts)
This article is issued from Wikipedia. The text is licensed under Creative Commons - Attribution - Sharealike. Additional terms may apply for the media files.