List of U.S. states and territories by economic growth rate
This is a list of U.S. states and territories by economic growth rate. This article includes a list of the 50 U.S. states, the District of Columbia, and the 5 inhabited U.S. territories sorted by economic growth — the percentage change in real GDP for the first quarter of 2019 is listed (for the 50 states and District of Columbia), using the most recent data available from the U.S. Bureau of Economic Analysis.[1] The most recent data for American Samoa, Guam, the Northern Mariana Islands and Puerto Rico is from 2018, and the most recent data for the U.S. Virgin Islands is from 2017.
Within the 50 states and District of Columbia, West Virginia had the largest GDP growth rate (![]()
![]()
![]()
![]()
![]()
First Quarter 2019 list
| Rank | State federal district or territory |
2019 (First Quarter) GDP Percent change [1][3][5][2][6][7][note 2] |
|---|---|---|
| 1 | ||
| 2 | ||
| 3 | ||
| 4 | ||
| 5 | ||
| 6 | ||
| 6 | ||
| 6 | ||
| 6 | ||
| 10 | ||
| 10 | ||
| 10 | ||
| 13 | ||
| 13 | ||
| 15 | ||
| 16 | ||
| 17 | ||
| 18 | ||
| 19 | ||
| 19 | ||
| 19 | ||
| 19 | ||
| 23 | ||
| 23 | ||
| 23 | ||
| 23 | ||
| 23 | ||
| 28 | ||
| 29 | ||
| 29 | ||
| 29 | ||
| 29 | ||
| 29 | ||
| 34 | ||
| 34 | ||
| 34 | ||
| 34 | ||
| 38 | ||
| 38 | ||
| 38 | ||
| 38 | ||
| 42 | ||
| 43 | ||
| 43 | ||
| 45 | ||
| 45 | ||
| 45 | ||
| 48 | ||
| 49 | ||
| 49 | ||
| 51 | ||
| 52 | ||
| 53 | ||
| 54 | ||
| 55 | ||
| 56 |
2017 list
| 2017 Rank |
State or federal district |
2017 GDP Percent change |
|---|---|---|
| — | ||
| 1 | ||
| 2 | ||
| 3 | ||
| 4 | ||
| 5 | ||
| 6 | ||
| 7 | ||
| 9 | ||
| 12 | ||
| 14 | ||
| 17 | ||
| 18 | ||
| 19 | ||
| 21 | ||
| 24 | ||
| — | ||
| 26 | ||
| 28 | ||
| 30 | ||
| 31 | ||
| 32 | ||
| 34 | ||
| 38 | ||
| 39 | ||
| 40 | ||
| 41 | ||
| 43 | ||
| 45 | ||
| 47 | ||
| 48 | ||
| 49 | ||
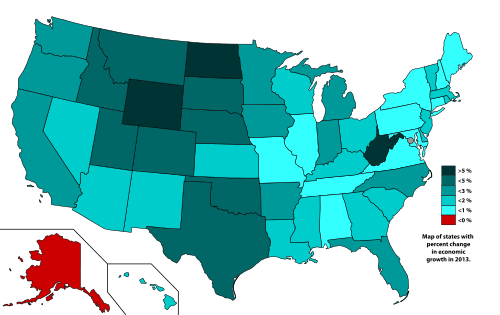
2013 list
| 2013 Rank |
State or federal district |
2013 GDP Percent change[9] |
2010–13 GDP Percent change |
2010–13 Pop. Percent change[10] |
2010–13 Per Capita GDP percent change |
|---|---|---|---|---|---|
| — | |||||
| 1 | |||||
| 2 | |||||
| 3 | |||||
| 4 | |||||
| 5 | |||||
| 6 | |||||
| 7 | |||||
| 8 | |||||
| 9 | |||||
| 10 | |||||
| 11 | |||||
| 12 | |||||
| 13 | |||||
| 14 | |||||
| 15 | |||||
| 16 | |||||
| 17 | |||||
| 18 | |||||
| 19 | |||||
| 20 | |||||
| 21 | |||||
| 22 | |||||
| 23 | |||||
| 24 | |||||
| 25 | |||||
| 26 | |||||
| 27 | |||||
| 28 | |||||
| 29 | |||||
| 30 | |||||
| 31 | |||||
| 32 | |||||
| 33 | |||||
| 34 | |||||
| 35 | |||||
| 36 | |||||
| 37 | |||||
| 38 | |||||
| 39 | |||||
| 40 | |||||
| 41 | |||||
| 42 | |||||
| 43 | |||||
| 44 | |||||
| 45 | |||||
| 46 | |||||
| 47 | |||||
| 48 | |||||
| 49 | |||||
| 50 | |||||
See also
Notes
- Data for the 50 states and District of Columbia is from First Quarter 2019. Data for American Samoa, Guam, the Northern Mariana Islands and Puerto Rico is from 2018. Data for the U.S. Virgin Islands is from 2017.
- Data for the 50 states and District of Columbia is from First Quarter 2019. Data for American Samoa, Guam, the Northern Mariana Islands and Puerto Rico is from 2018. Data for the U.S. Virgin Islands is from 2017.
References
- https://www.bea.gov/news/2019/gross-domestic-product-state-first-quarter-2019 BEA.gov. Gross Domestic Product By State, First Quarter 2019. Retrieved August 28, 2019.
- https://www.bea.gov/news/2019/gross-domestic-product-commonwealth-northern-mariana-islands-cnmi-2018 BEA.gov. Gross Domestic Product for the Commonwealth of the Northern Mariana Islands (CNMI), 2018. Retrieved November 29, 2019.
- https://www.bea.gov/news/2019/american-samoa-gdp-increases-2018 BEA.gov. American Samoa GDP Increases in 2018. Retrieved August 28, 2019.
- https://www.bea.gov/news/blog/2018-10-17/northern-mariana-islands-gdp-increases-2017 BEA.gov. Northern Mariana Islands’ GDP increases in 2017. Retrieved July 3, 2019.
- https://www.bea.gov/news/2019/gross-domestic-product-guam-2018 BEA.gov. Gross Domestic Product for Guam, 2018. Retrieved November 29, 2019.
- https://www.bea.gov/news/2018/us-virgin-islands-gdp-decreases-2017 BEA.gov. U.S. Virgin Islands GDP Decreases in 2017. Retrieved July 3, 2019.
- https://data.worldbank.org/indicator/NY.GDP.MKTP.KD.ZG?locations=PR Data.worldbank.org. Puerto Rico (GDP Growth). Retrieved November 29, 2019.
- "Gross Domestic Product by State and Federal district: First Quarter 2018" (PDF).
- "BEA official report" (PDF). Archived from the original (PDF) on 2017-11-22. Retrieved 2018-03-09.
- "Annual Estimates of the Resident Population for the United States, Regions, States, and Puerto Rico: April 1, 2010 to July 1, 2014". 2014 Population Estimates. United States Census Bureau, Population Division. December 23, 2014. Retrieved December 23, 2014.