List of states and territories of the United States by population density
This article includes a sortable table listing the 50 states, the territories, and the District of Columbia by population density, population rank, and land area. It also includes a sortable table of density by states, territories, divisions and regions by population rank and land area, and a sortable table for density by states, divisions, regions and territories in square miles and square kilometers.
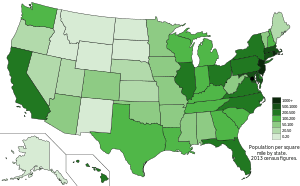

Population density is defined as the population per (divided by) land area. Resident population is from the United States Census Bureau estimates for July 1, 2015, (for the 50 states, DC and Puerto Rico,) and from the 2015 United Nations Department of Economic and Social Affairs for territories besides Puerto Rico.[1][2] In the second table, territorial data (except Puerto Rico's) are from the 2010 Census. Land area is from the 2010 Census.[3]
The population density of the United States is lower than that of many other countries because of the United States' large land area. For example, the population density of the U.S. is a twelfth that of the Netherlands and a fifteenth that of South Korea. However, it is over 8 times higher than that of Canada and over 9 times higher than that of Australia.[4]
2015 density (states, territories and DC)
| State etc. | Population density | Population | Land area | ||||||
|---|---|---|---|---|---|---|---|---|---|
| Rank (all) |
Rank (50 states) |
per mi2 |
per km2 |
Rank | Numbers | Rank | mi2 | km2 | |
| 1 | — | 11011 | 4251 | 50 | 672,228 | 56 | 61 | 158.0 | |
| 2 | 1 | 1218 | 470 | 11 | 8,958,013 | 46 | 7,354 | 19,046.8 | |
| 3 | — | 1046 | 404 | 29 | 3,680,058 | 49 | 3,515 | 9,103.8 | |
| 4 | 2 | 1021 | 394 | 44 | 1,056,298 | 51 | 1,034 | 2,678.0 | |
| 5 | 3 | 871 | 336 | 15 | 6,794,422 | 45 | 7,800 | 20,201.9 | |
| 6 | — | 808 | 314 | 53 | 169,885 | 52 | 210 | 543.9 | |
| 7 | — | 799 | 308 | 54 | 106,906 | 54 | 134 | 347.1 | |
| 8 | 4 | 741 | 286 | 30 | 3,590,886 | 48 | 4,842 | 12,540.7 | |
| 9 | — | 721 | 279 | 55 | 55,538 | 55 | 77 | 199.4 | |
| 10 | 5 | 618 | 238 | 19 | 6,006,401 | 42 | 9,707 | 25,141.0 | |
| 11 | 6 | 485 | 187 | 46 | 945,934 | 50 | 1,949 | 5,047.9 | |
| 12 | 7 | 420 | 162 | 4 | 19,795,791 | 30 | 47,126 | 122,055.8 | |
| 13 | 8 | 378 | 145 | 3 | 20,271,272 | 26 | 53,625 | 138,888.1 | |
| 14 | — | 307 | 118 | 56 | 55,070 | 53 | 179 | 463.6 | |
| 15 | 9 | 286 | 110 | 6 | 12,802,503 | 32 | 44,743 | 115,883.8 | |
| 16 | 10 | 284 | 109 | 7 | 11,614,373 | 35 | 40,861 | 105,829.5 | |
| 17 | 11 | 251 | 97 | 1 | 39,144,818 | 3 | 155,959[5] | 403,932.0 | |
| 18 | 12 | 231 | 89 | 5 | 12,859,995 | 24 | 55,519 | 143,793.5 | |
| 19 | 13 | 222 | 86 | 41 | 1,431,603 | 47 | 6,423 | 16,635.5 | |
| 20 | 14 | 212 | 81 | 12 | 8,382,993 | 36 | 39,490 | 102,278.6 | |
| 21 | 15 | 206 | 79 | 9 | 10,042,802 | 29 | 48,618 | 125,920.0 | |
| 22 | 16 | 184 | 71 | 16 | 6,619,680 | 38 | 35,826 | 92,788.9 | |
| 23 | 17 | 177 | 68 | 8 | 10,214,860 | 21 | 57,513 | 148,958.0 | |
| 24 | 18 | 175 | 67 | 10 | 9,922,576 | 22 | 56,539 | 146,435.3 | |
| 25 | 19 | 162 | 62 | 23 | 4,896,146 | 40 | 30,061 | 77,857.6 | |
| 26 | 20 | 160 | 61 | 17 | 6,600,299 | 34 | 41,235 | 106,798.2 | |
| 27 | 21 | 148 | 57 | 42 | 1,330,608 | 44 | 8,953 | 23,188.2 | |
| 28 | 22 | 112 | 43 | 26 | 4,425,092 | 37 | 39,486 | 102,268.3 | |
| 29 | 23 | 108 | 41 | 25 | 4,670,724 | 33 | 43,204 | 111,897.8 | |
| 30 | 24 | 107 | 41 | 13 | 7,170,351 | 20 | 66,456 | 172,120.2 | |
| 31 | 25 | 106 | 41 | 20 | 5,771,337 | 25 | 54,158 | 140,268.6 | |
| 32 | 26 | 105 | 40 | 2 | 27,469,114 | 2 | 261,232 | 676,587.8 | |
| 33 | 27 | 95 | 37 | 24 | 4,858,979 | 28 | 50,645 | 131,169.9 | |
| 34 | 28 | 88 | 34 | 18 | 6,083,672 | 18 | 68,742 | 178,041.0 | |
| 35 | 29 | 76 | 29 | 39 | 1,844,128 | 41 | 24,038 | 62,258.1 | |
| 36 | 30 | 68 | 26 | 21 | 5,489,594 | 14 | 79,627 | 206,233.0 | |
| 37 | 31 | 67 | 26 | 51 | 626,042 | 43 | 9,217 | 23,871.9 | |
| 38 | 32 | 63 | 24 | 33 | 2,992,333 | 31 | 46,923 | 121,530.0 | |
| 39 | 33 | 60 | 23 | 14 | 6,828,065 | 6 | 113,594 | 294,207.1 | |
| 40 | 34 | 57 | 22 | 34 | 2,978,204 | 27 | 52,035 | 134,770.0 | |
| 41 | 35 | 57 | 22 | 28 | 3,911,338 | 19 | 68,595 | 177,660.2 | |
| 42 | 36 | 55 | 21 | 31 | 3,123,899 | 23 | 55,857 | 144,669.0 | |
| 43 | 37 | 52 | 20 | 22 | 5,456,574 | 8 | 103,642 | 268,431.5 | |
| 44 | 38 | 43 | 16 | 43 | 1,329,328 | 39 | 30,843 | 79,883.0 | |
| 45 | 39 | 41 | 16 | 27 | 4,028,977 | 10 | 95,988 | 248,607.8 | |
| 46 | 40 | 36 | 14 | 32 | 2,995,919 | 12 | 82,170 | 212,819.3 | |
| 47 | 41 | 36 | 14 | 35 | 2,911,641 | 13 | 81,759 | 211,754.8 | |
| 48 | 42 | 26 | 10 | 36 | 2,890,845 | 7 | 109,781 | 284,331.5 | |
| 49 | 43 | 24 | 9 | 38 | 1,896,190 | 15 | 76,824 | 198,973.2 | |
| 50 | 44 | 20 | 7 | 40 | 1,654,930 | 11 | 82,643 | 214,044.4 | |
| 51 | 45 | 17 | 6 | 37 | 2,085,109 | 5 | 121,298 | 314,160.4 | |
| 52 | 46 | 11 | 4 | 47 | 858,469 | 16 | 75,811 | 196,349.6 | |
| 53 | 47 | 10 | 4 | 48 | 756,927 | 17 | 69,001 | 178,711.8 | |
| 54 | 48 | 7 | 2 | 45 | 1,032,949 | 4 | 145,546 | 376,962.4 | |
| 55 | 49 | 6 | 2 | 52 | 586,107 | 9 | 97,093 | 251,469.7 | |
| 56 | 50 | 1 | <1 | 49 | 738,432 | 1 | 570,641 | 1,477,953.4 | |


2013 density (states, territories, divisions and regions)
| Legend |
| Division totals – 9 divisions for 50 states and DC |
| Region totals – 4 regions (2 or 3 divisions each) |
| Individual territories |
| Total U.S. Territories |
| 50 states + DC |
| Divisions & regions as defined by U.S. Census Bureau |
| Last col. shows larger region which contains entity in col. 2 |
| Rank | State/Territory/ Division/Region |
Density (Pop. |
Density (Pop. |
Geog. sort |
|---|---|---|---|---|
| 1 | 10,588.8 | 4,088.4 | MdAtl | |
| 2 | 1,210.1 | 467.2 | MdAtl | |
| 3 | 1,055.9 | 407.7 | Terr. | |
| 4 | 1,017.1 | 392.7 | NEng | |
| -- | Territories | 991.0 | 382.6 | USA |
| 5 | 858.0 | 331.3 | NEng | |
| 6 | 792.2 | 305.9 | Terr. | |
| 7 | 759.6 | 293.3 | Terr. | |
| 8 | 742.6 | 286.7 | NEng | |
| 9 | 726.1 | 280.4 | Terr. | |
| 10 | 610.8 | 235.8 | MdAtl | |
| 11 | 475.1 | 183.4 | MdAtl | |
| 12 | 417.0 | 161.0 | MdAtl | |
| 1 | Mid-Atlantic | 416.5 | 160.8 | NEast |
| 13 | 364.6 | 140.8 | SAtl | |
| 1 | Northeast | 345.5 | 133.4 | USA |
| 14 | 295.5 | 114.1 | Terr. | |
| 15 | 285.5 | 110.2 | MdAtl | |
| 16 | 283.2 | 109.3 | ENC | |
| 17 | 246.1 | 95.0 | Pac | |
| 2 | New England | 233.2 | 90.0 | NEast |
| 3 | South Atlantic | 233.1 | 90.0 | South |
| 18 | 232.0 | 89.6 | ENC | |
| 19 | 218.6 | 84.4 | Pac | |
| 20 | 209.2 | 80.8 | SAtl | |
| 21 | 202.6 | 78.2 | SAtl | |
| 4 | East North Central | 192.1 | 74.2 | MWest |
| 22 | 183.4 | 70.8 | ENC | |
| 23 | 175.0 | 67.6 | ENC | |
| 24 | 173.7 | 67.1 | SAtl | |
| 25 | 158.8 | 61.3 | SAtl | |
| 26 | 157.5 | 60.8 | ESC | |
| 27 | 147.8 | 57.1 | NEng | |
| 2 | South | 136.3 | 52.6 | USA |
| 28 | 111.3 | 43.0 | ESC | |
| 29 | 107.1 | 41.3 | WSC | |
| 30 | 106.0 | 40.9 | ENC | |
| 5 | East South Central | 105.0 | 40.5 | South |
| 31 | 104.9 | 40.5 | Pac | |
| 32 | 103.1 | 40.8 | WSC | |
| 33 | 95.4 | 36.9 | ESC | |
| 3 | Midwest | 90.0 | 34.7 | USA |
| -- | 89.5 | 34.6 | NAmer | |
| 6 | West South Central | 89.1 | 34.4 | South |
| 34 | 87.9 | 33.9 | WNC | |
| 35 | 77.1 | 29.8 | SAtl | |
| 36 | 68.1 | 26.3 | WNC | |
| 37 | 68.0 | 26.3 | NEng | |
| 38 | 63.7 | 24.6 | ESC | |
| 39 | 58.3 | 22.5 | Mtn | |
| 7 | Pacific | 57.4 | 22.2 | West |
| 40 | 56.9 | 21.8 | WSC | |
| 41 | 56.1 | 21.3 | WSC | |
| 42 | 54.8 | 21.2 | WNC | |
| 43 | 50.8 | 19.6 | Mtn | |
| 4 | West | 49.5 | 19.1 | USA |
| 44 | 43.1 | 16.6 | NEng | |
| 8 | West North Central | 41.1 | 15.9 | MWest |
| 45 | 40.9 | 15.8 | Pac | |
| 46 | 35.4 | 13.7 | WNC | |
| 47 | 35.3 | 13.6 | Mtn | |
| 9 | Mountain | 26.7 | 10.3 | West |
| 48 | 25.4 | 9.8 | Mtn | |
| 49 | 24.3 | 9.4 | WNC | |
| 50 | 19.5 | 7.5 | Mtn | |
| 51 | 17.2 | 6.6 | Mtn | |
| 52 | 11.1 | 4.3 | WNC | |
| 53 | 10.5 | 4.0 | WNC | |
| 54 | 7.0 | 2.7 | Mtn | |
| 55 | 6.0 | 2.3 | Mtn | |
| 56 | 1.3 | 0.5 | Pac |
See also
- Big Eight States
- Outline of the United States
- Index of United States-related articles
- United States
- Demographics of the United States
- U.S. state
- List of U.S. states
- List of U.S. states by African-American population
- List of U.S. states by area
- List of U.S. states by coastline
- List of U.S. states by date of admission to the Union
- List of U.S. states by elevation
- List of U.S. states by fertility rate
- List of U.S. states by GDP (nominal)
- List of U.S. states by GDP per capita (nominal)
- List of U.S. states by historical population
- List of U.S. states by income equality
- List of U.S. states by population
- List of U.S. states by population growth rate
- List of U.S. states by time zone
- List of U.S. states by vehicles per capita
- List of U.S. states
References
- Resident Population Data - 2010 Census. United States Census Bureau. Last accessed January 10, 2011.
- 2015 List of Countries by Population Density [for territories]. United Nations Department of Economic and Social Affairs. Retrieved December 31, 2017.
- "Annual Estimates of the Population for the United States, Regions, States, and Puerto Rico: April 1, 2010 to July 1, 2015". 2015 Population Estimates. United States Census Bureau, Population Division. December 2015. Archived from the original (CSV) on December 23, 2015. Retrieved March 5, 2016.
- "Archived copy". Archived from the original on November 17, 2015. Retrieved November 9, 2015.CS1 maint: archived copy as title (link) 2015 - List of Countries by Population Density. United Nations Department of Economic and Social Affairs. Retrieved December 31, 2017.
- "State Area Measurements and Internal Point Coordinates". 2010 United States Census. United States Census Bureau. February 11, 2011. Archived from the original on March 16, 2018. Retrieved April 24, 2014.
- United Nations World Population Prospects Archived December 29, 2010, at the Wayback Machine
- Wiersdorf, G. William. "California Land Area". www.onlinecalifornia.us. Archived from the original on July 24, 2017.