Political party strength in U.S. states
Political party strength in U.S. states refers to the level of representation of the various political parties of the U.S. in each statewide elective office providing legislators to the state and to the U.S. Congress and electing the executives at the state (U.S. state governor) and national (U.S. President) level.
History

Throughout most of the 20th century, although the Republican and Democratic parties alternated in power at a national level, some states were so overwhelmingly dominated by one party that nomination was usually tantamount to election. This was especially true in the Solid South, where the Democratic Party was dominant for the better part of a century, from the end of Reconstruction in the late 1870s, through the period of Jim Crow Laws into the 1960s. Conversely, the New England states of Vermont, Maine, and New Hampshire were dominated by the Republican Party, as were some Midwestern states like Iowa and North Dakota.
However, in the 1970s and 1980s the increasingly conservative Republican Party gradually overtook the Democrats in the southeast. The Democrats' support in the formerly Solid South had been eroded during the vast cultural, political and economic upheaval that surrounded the 1960s. By the 1990s, the Republican Party had completed the transition into the southeast's dominant political party, despite typically having fewer members due to the prevalence of Republican voting generational Democrats. In New England, the opposite trend took place; the former Republican strongholds of Maine and Vermont became solidly Democratic, as did formerly Republican areas of New Jersey, New York, and Connecticut.
As of 2020 the majority of the overall number of seats held in the state legislatures has been switching between the two parties every few years. In the U.S. gubernatorial elections of 2010, the Republican party held an outright majority of approximately 440 with 3,890 seats (53% of total) compared to the Democratic party's number of 3,450 (47% of total) seats elected on a partisan ballot.[1] Of the 7,382 seats in all of the state legislatures combined, independents and third parties account for only 16 members, not counting the 49 members of the Nebraska Legislature, which is the only legislature in the nation to hold non-partisan elections to determine its members. Due to the results of the 2010 elections, Republicans took control of an additional 19 state legislative chambers, giving them majority control of both chambers in 25 states versus the Democrats' majority control of both chambers in only 16 states, with 8 states having split or inconclusive control of both chambers (not including Nebraska); previous to the 2010 elections, it was Democrats who controlled both chambers in 27 states versus the Republican party having total control in only 14 states, with eight states divided and Nebraska being nonpartisan.[2]
Current party strength
Gallup
As of April 2020, Gallup polling found that 31% of Americans identified as Democrats, 30% identified as Republican, and 36% as Independent.[3] Additionally, polling showed that 46% are either "Democrats or Democratic leaners" and 46% are either "Republicans or Republican leaners" when Independents are asked "do you lean more to the Democratic Party or the Republican Party?"[3]
In 2018, the number of competitive states dropped down to 10, the lowest number since 2008. From 2017 to 2018, New Hampshire, Nevada, and Pennsylvania moved from competitive to lean Democratic, while West Virginia, Louisiana, and Indiana moved from competitive to lean Republican, and Nebraska moved from lean Republican to competitive.[4]
As of 2018, Massachusetts was the most Democratic state, with 56% of residents identifying as Democrat, while only 27% of residents identified as Republican. Wyoming was the most Republican state, with 59% of residents identifying as Republican, and only 25% of residents identifying as Democrat.[4]
| Number of U.S. States | ||||||
|---|---|---|---|---|---|---|
| Year | Solid Dem | Lean Dem | Competitive | Lean GOP | Solid GOP | Net Dem |
| 2008 | 29 | 6 | 10 | 1 | 4 | +30 |
| 2009 | 23 | 10 | 12 | 1 | 4 | +28 |
| 2010 | 13 | 9 | 18 | 5 | 5 | +12 |
| 2011 | 11 | 7 | 15 | 7 | 10 | +1 |
| 2012 | 13 | 6 | 19 | 3 | 9 | +7 |
| 2013 | 12 | 5 | 19 | 2 | 12 | +3 |
| 2014 | 11 | 6 | 18 | 5 | 10 | +2 |
| 2015 | 11 | 3 | 16 | 8 | 12 | −6 |
| 2016 | 13 | 1 | 15 | 7 | 14 | −7 |
| 2017 | 15 | 4 | 15 | 3 | 13 | +3 |
| 2018 | 14 | 8 | 10 | 5 | 13 | +4 |
Cook Partisan Voting Index (PVI)
Another metric to measure how much a state leans towards one party or the other is the Cook Partisan Voting Index (PVI). Cook PVIs are calculated by comparing a state's average Democratic Party or Republican Party share of the two-party presidential vote in the past two presidential elections to the nation's average share of the same. PVIs for the states over time can be used to show the trends of U.S. states towards, or away from, one party or the other.[6]
Elections and voter registrations
The following table shows all the U.S. states and to what party (Democratic or Republican) their state governors belong. Also indicated is the majority party of the state legislatures' upper and lower houses as well as U.S. Senate representation. Nebraska's legislature is unicameral, i.e., it has only one legislative house and is officially non-partisan, though party affiliation still has an unofficial influence on the legislative process.
The simplest measure of the party strength in a state's voting population is the breakdown-by-party totals from its voter registration figures (figures that can easily be obtained from the websites of the Secretaries of State or the Boards of Elections of the various states). As of 2019, 28 states and the District of Columbia allow registered voters to indicate a party preference when registering to vote; the following 20 states (mostly in the South and the Midwest) do not provide for party preferences in voter registration: Alabama, Arkansas, Georgia, Hawaii, Illinois, Indiana, Michigan, Minnesota, Mississippi, Missouri, Montana, North Dakota, Ohio, South Carolina, Tennessee, Texas, Vermont, Virginia, Washington and Wisconsin. The partisan breakdown "demographics" provided in the following table are obtained from that state's party registration figures (from late 2014 whenever possible) where indicated.[7] Only Wyoming has a majority of registered voters identifying themselves as Republicans; two states have a majority of registered voters identifying themselves as Democrats: Maryland and Kentucky (since 2010, Louisiana, Pennsylvania and West Virginia have all seen their Democratic-majority registrations slip to just Democratic-pluralities).
For those states that do not allow for registration by party, Gallup's annual polling of voter party identification by state is the next best metric of party strength in the U.S. states. The partisan figures in the table below for the 22 states that don't register voters by party come from Gallup's 2017 polling of voter party identification by state.
Table of U.S. state party statistics as of November 2019
| State | 2016 presidential election |
Governor | State Senate | State House | Senior U.S. Senator |
Junior U.S. Senator |
U.S. House of Representatives | Partisan split (as of 2018) |
|---|---|---|---|---|---|---|---|---|
| Alabama | Republican | Republican | Republican 27–8 | Republican 77–28 | Republican | Democratic | Republican 6–1 | Republican 52–35[lower-alpha 1] |
| Alaska | Republican | Republican | Republican 13–7 | Coalition 23–17[lower-alpha 2] | Republican | Republican | Republican | Republican 24.3–13.3[lower-alpha 3][9] |
| Arizona | Republican | Republican | Republican 17–13 | Republican 31–29 | Democratic | Republican | Democratic 5–4 | Republican 34.9–32.5[lower-alpha 3][10] |
| Arkansas | Republican | Republican | Republican 26–9 | Republican 76–24 | Republican | Republican | Republican 4 | Republican 48–35[lower-alpha 1] |
| California | Democratic | Democratic | Democratic 29–11 | Democratic 61–19 | Democratic | Democratic | Democratic 46–7 | Democratic 45.3–23.9[lower-alpha 3][11] |
| Colorado | Democratic | Democratic | Democratic 19–16 | Democratic 41–24 | Democratic | Republican | Democratic 4–3 | Democratic 30.4–28.0[lower-alpha 3][12] |
| Connecticut | Democratic | Democratic | Democratic 22–14 | Democratic 91–60 | Democratic | Democratic | Democratic 5 | Democratic 36.6–21.0[lower-alpha 3][13] |
| Delaware | Democratic | Democratic | Democratic 12–9 | Democratic 26–15 | Democratic | Democratic | Democratic | Democratic 47.6–27.7[lower-alpha 3][14] |
| Florida | Republican | Republican | Republican 23–17 | Republican 73–47 | Republican | Republican | Republican 14–13 | Democratic 37.4–35.3[lower-alpha 3][15] |
| Georgia | Republican | Republican | Republican 35–21 | Republican 105–75 | Republican | Republican | Republican 9–5 | Democratic 43–42[lower-alpha 1] |
| Hawaii | Democratic | Democratic | Democratic 24–1 | Democratic 46–5 | Democratic | Democratic | Democratic 2 | Democratic 54–29[lower-alpha 1] |
| Idaho | Republican | Republican | Republican 28–7 | Republican 56–14 | Republican | Republican | Republican 2 | Republican 50–34[lower-alpha 1] |
| Illinois | Democratic | Democratic | Democratic 40–19 | Democratic 74–44 | Democratic | Democratic | Democratic 13–5 | Democratic 50–34[lower-alpha 1] |
| Indiana | Republican | Republican | Republican 40–10 | Republican 67–33 | Republican | Republican | Republican 7–2 | Republican 46–38[lower-alpha 1] |
| Iowa | Republican | Republican | Republican 32–18 | Republican 53–47 | Republican | Republican | Democratic 3–1 | Democratic 32.2–31.8[lower-alpha 3][16] |
| Kansas | Republican | Democratic | Republican 28–11–1[lower-alpha 4] | Republican 84–41 | Republican | Republican | Republican 3–1 | Republican 44.4–25.1[lower-alpha 3][17] |
| Kentucky | Republican | Democratic | Republican 29–9 | Republican 61–39 | Republican | Republican | Republican 5–1 | Democratic 48.4–42.8[lower-alpha 3][18] |
| Louisiana | Republican | Democratic | Republican 27–12 | Republican 68–35–2[lower-alpha 4] | Republican | Republican | Republican 5–1 | Democratic 42.0–31.6[lower-alpha 3][19] |
| Maine | Democratic | Democratic | Democratic 21–14 | Democratic 89–56–6[lower-alpha 4] | Republican | Independent[lower-alpha 5] | Democratic 2 | Democratic 33.2–27.2[lower-alpha 3][20] |
| Maryland | Democratic | Republican | Democratic 32–15 | Democratic 99–42 | Democratic | Democratic | Democratic
6-1-1(b, g) |
Democratic 54.9–24.9[lower-alpha 3][21] |
| Massachusetts | Democratic | Republican | Democratic 34–6 | Democratic 127–32–1[lower-alpha 4] | Democratic | Democratic | Democratic 9 | Democratic 32.5–10.1[lower-alpha 3][22] |
| Michigan | Republican | Democratic | Republican 22–16 | Republican 58–52 | Democratic | Democratic | Democratic 7–6–1[lower-alpha 6] | Democratic 45–39[lower-alpha 1] |
| Minnesota | Democratic | Democratic | Republican 35–32 | Democratic 75–59 | Democratic | Democratic | Democratic 5–3 | Democratic 46–38[lower-alpha 1] |
| Mississippi | Republican | Republican | Republican 36–16 | Republican 75–46–1[lower-alpha 4] | Republican | Republican | Republican 3–1 | Republican 48–36[lower-alpha 1] |
| Missouri | Republican | Republican | Republican 24–10 | Republican 116–47 | Republican | Republican | Republican 6–2 | Republican 47–38[lower-alpha 1] |
| Montana | Republican | Democratic | Republican 30–20 | Republican 58–42 | Democratic | Republican | Republican | Republican 46–39[lower-alpha 1] |
| Nebraska | Republican | Republican | Unicameral nonpartisan legislature[lower-alpha 7] | Republican | Republican | Republican 3 | Republican 47.8–29.5[lower-alpha 3][25] | |
| Nevada | Democratic | Democratic | Democratic 13–8 | Democratic 29–13 | Democratic | Democratic | Democratic 3–1 | Democratic 38.6–32.7[lower-alpha 3][26] |
| New Hampshire | Democratic | Republican | Democratic 14–10 | Democratic 234–166 | Democratic | Democratic | Democratic 2 | Democratic 32.2–30.1[lower-alpha 3][27] |
| New Jersey | Democratic | Democratic | Democratic 25–15 | Democratic 54–26 | Democratic | Democratic | Democratic 10-2 | Democratic 38.0–21.8[lower-alpha 3][28] |
| New Mexico | Democratic | Democratic | Democratic 26–16 | Democratic 46–24 | Democratic | Democratic | Democratic 3 | Democratic 45.5–30.4[lower-alpha 3][29] |
| New York | Democratic | Democratic | Democratic 40–22–1 | Democratic 106–43–1[lower-alpha 4] | Democratic | Democratic | Democratic 21–5–1[lower-alpha 4][lower-alpha 6] | Democratic 50.6-21.9[lower-alpha 3][30] |
| North Carolina | Republican | Democratic | Republican 29–21 | Republican 65–55 | Republican | Republican | Republican 10–3 | Democratic 36.2–29.9[lower-alpha 3][31] |
| North Dakota | Republican | Republican | Republican 37–10 | Republican 79–15 | Republican | Republican | Republican | Republican 55-30[lower-alpha 1] |
| Ohio | Republican | Republican | Republican 24–9 | Republican 61–38 | Democratic | Republican | Republican 12–4 | Republican 45–41[lower-alpha 1] |
| Oklahoma | Republican | Republican | Republican 39–9 | Republican 77–24 | Republican | Republican | Republican 4–1 | Republican 48.2–35.3[lower-alpha 3][32] |
| Oregon | Democratic | Democratic | Democratic 18–12 | Democratic 38–22 | Democratic | Democratic | Democratic 4–1 | Democratic 35.1–24.8[lower-alpha 3][33] |
| Pennsylvania | Republican | Democratic | Republican 28–22 | Republican 110–93 | Democratic | Republican | Tied 9–9 | Democratic 47.6–38.2[lower-alpha 3][34] |
| Rhode Island | Democratic | Democratic | Democratic 33–5 | Democratic 66–9 | Democratic | Democratic | Democratic 2 | Democratic 36.4–11.3[lower-alpha 3][35] |
| South Carolina | Republican | Republican | Republican 27–19 | Republican 80–44 | Republican | Republican | Republican 5–2 | Republican 47-37[lower-alpha 1] |
| South Dakota | Republican | Republican | Republican 30–5 | Republican 59–11 | Republican | Republican | Republican | Republican 47.5–28.1[lower-alpha 3][36] |
| Tennessee | Republican | Republican | Republican 28–5 | Republican 73–26 | Republican | Republican | Republican 7–2 | Republican 48–35[lower-alpha 1] |
| Texas | Republican | Republican | Republican 19–12 | Republican 83–67 | Republican | Republican | Republican 23–13 | Republican 42–39[lower-alpha 1] |
| Utah | Republican | Republican | Republican 23–6 | Republican 59–16 | Republican | Republican | Republican 3–1 | Republican 56–28[lower-alpha 1] |
| Vermont | Democratic | Republican | Democratic 22–6–2[lower-alpha 4] | Democratic 95–43–12[lower-alpha 4] | Democratic | Independent[lower-alpha 5] | Democratic | Democratic 55–30[lower-alpha 1] |
| Virginia | Democratic | Democratic | Democratic 21–19 | Democratic 55–45 | Democratic | Democratic | Democratic 7–4 | Democratic 46–39[lower-alpha 1] |
| Washington | Democratic | Democratic | Democratic 29–20 | Democratic 57–41 | Democratic | Democratic | Democratic 7–3 | Democratic 50–35[lower-alpha 1] |
| West Virginia | Republican | Republican | Republican 20–14 | Republican 59–41 | Democratic | Republican | Republican 3 | Democratic 38.9–34.3[lower-alpha 3][37] |
| Wisconsin | Republican | Democratic | Republican 19–14 | Republican 63–36 | Republican | Democratic | Republican 5–3 | EVEN 43–43[lower-alpha 1] |
| Wyoming | Republican | Republican | Republican 27–3 | Republican 50–9–1 | Republican | Republican | Republican | Republican 70.1–18.2[lower-alpha 3][38] |
| Totals | |||||
|---|---|---|---|---|---|
| Presidency (after 2016 Election) |
U.S. Senate (after 2018 Elections) |
U.S. House of Representatives (October 2019) |
Governor (after 2019 Elections) |
Majority in State Senate (after 2019 Elections) |
Majority in State House (after 2019 Elections) |
| Republican 306–232 | Republican 53–47[lower-alpha 5] | Democratic 233–197–1–4[lower-alpha 6] | Republican 26–24 | Republican 31–19 | Republican 28–20–1[lower-alpha 4] |
- Indicated partisan breakdown numbers are from the Party Identification by State figures for 2018 from Gallup polling (note: Gallup figures have been rounded to two significant figures on the assumption that figures from polling are less accurate than registration-by-party figures).[8]
- The Alaska House of Representatives is controlled by a coalition of 15 Democrats, 6 Republicans and 2 Independents.
- Indicated partisan breakdown numbers are from the registration-by-party figures ("active" registered voters, when applicable) from that state's registered voter statistics (early 2020 party registration figures provided whenever possible).
- Vacancy
- Senators Bernie Sanders (I-VT) and Angus King (I-ME) are independents; however, they caucus with Senate Democrats and, as such, are included in that party's total number of Senators for the purposes of calculating partisan breakdown in this article.
- The US House of Representatives currently consists of 233 Democrats, 197 Republicans, and 1 Libertarian (Rep. Justin Amash (L, MI-03), who was elected as a Republican but left the party on July 4, 2019). 3 seats are vacant (NY-27, represented by Republican Rep. Chris Collins until his October 1, 2019 resignation; CA-50, represented by Republican Duncan D. Hunter until his January 13, 2020 resignation; NC-11, represented by Republican Mark Meadows until his March 30, 2020 resignation; and TX-04, represented by Republican John Ratcliffe until his May 22, 2020 resignation.[23][24]
- While the Nebraska Legislature is technically non-partisan, the majority of its Senators are de facto Republicans.
Regional breakdowns
Local and regional political circumstances often influence party strength.
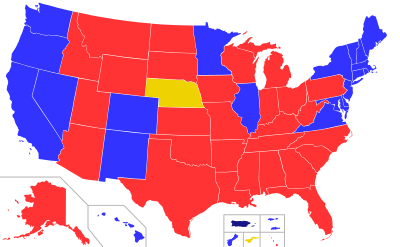
State government
The following figure is for Governors as of December 10, 2019:
| Governor |
|---|
 |
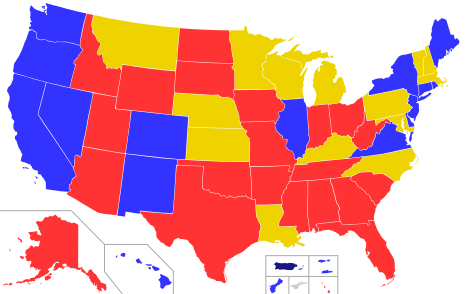
The following figures for party control of state legislative chambers are as of January 2020:
| State Senate | State House |
|---|---|
 |
 |
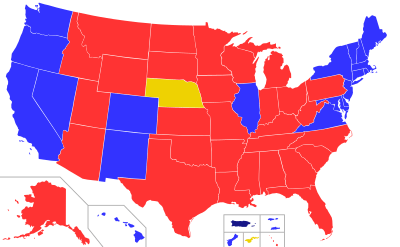
Presidential election results and congressional delegations
The following is based on the results of the 2016 Presidential election:
| Presidential Election |
|---|
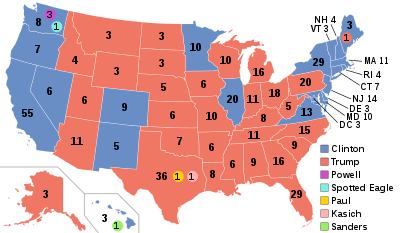 |
The following are the current standings in the U.S. Senate and in the U.S. House as of the 116th Congress:
| Senate | House of Representatives |
|---|---|
 |
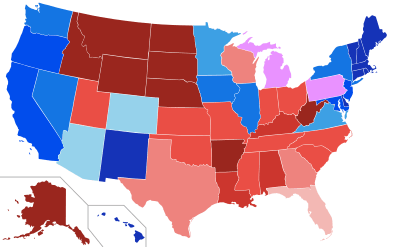 |
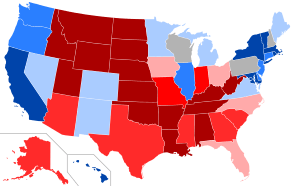
Demographics
| U.S. party percentages by state (2017)[39] |
|---|
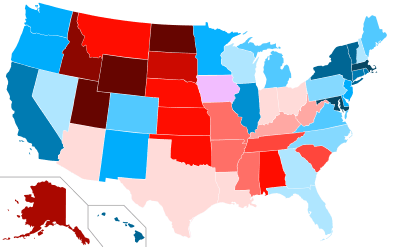 |
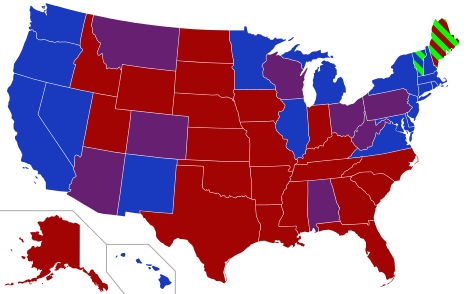
Historical party strength
The following table shows how many state legislatures were controlled outright by each party.[40]
| Year | Democrats | Republicans | Split |
|---|---|---|---|
| 1938 | 21 | 19 | 6 |
| 1940 | 21 | 17 | 8 |
| 1942 | 19 | 24 | 3 |
| 1944 | 19 | 24 | 3 |
| 1946 | 17 | 25 | 4 |
| 1948 | 19 | 16 | 11 |
| 1950 | 19 | 21 | 6 |
| 1952 | 16 | 26 | 4 |
| 1954 | 19 | 20 | 7 |
| 1956 | 22 | 19 | 5 |
| 1958 | 30 | 7 | 11 |
| 1960 | 27 | 15 | 6 |
| 1962 | 25 | 17 | 6 |
| 1964 | 32 | 6 | 10 |
| 1966 | 23 | 16 | 9 |
| 1968 | 20 | 20 | 8 |
| 1970 | 23 | 16 | 9 |
| 1972 | 26 | 16 | 7 |
| 1974 | 37 | 4 | 8 |
| 1976 | 35 | 4 | 10 |
| 1978 | 31 | 11 | 7 |
| 1980 | 29 | 15 | 5 |
| 1982 | 34 | 11 | 4 |
| 1984 | 26 | 11 | 12 |
| 1986 | 28 | 9 | 12 |
| 1988 | 29 | 8 | 12 |
| 1990 | 30 | 6 | 13 |
| 1992 | 25 | 8 | 16 |
| 1994 | 18 | 19 | 12 |
| 1996 | 20 | 18 | 11 |
| 1998 | 20 | 17 | 12 |
| 2000 | 16 | 18 | 15 |
| 2002 | 18 | 17 | 14 |
| 2003 | 16 | 21 | 12 |
| 2004 | 17 | 21 | 11 |
| 2005 | 20 | 20 | 9 |
| 2007 | 24 | 16 | 9 |
| 2008 | 23 | 15 | 12 |
| 2009 | 27 | 15 | 8 |
| 2010 | 27 | 15 | 8 |
| 2011 | 15 | 27 | 8 |
| 2012 | 15 | 29 | 6 |
| 2013 | 17 | 28 | 5 |
| 2014 | 17 | 28 | 5 |
| 2015 | 11 | 31 | 8 |
| 2016 | 11 | 31 | 8 |
| 2017 | 12 | 32 | 6 |
| 2018 | 13 | 32 | 5 |
| 2019 | 18 | 30 | 2 |
| 2020 | 19 | 29 | 2 |
The following table shows how many governorships were controlled outright by each party.[40]
| Year | Democrats | Republicans | Independent |
|---|---|---|---|
| 1922 | 26 | 22 | |
| 1923 | 27 | 21 | |
| 1924 | 23 | 25 | |
| 1926 | 20 | 28 | |
| 1927 | 19 | 29 | |
| 1928 | 16 | 32 | |
| 1930 | 24 | 22 | 2 |
| 1931 | 26 | 20 | 2 |
| 1932 | 36 | 10 | 2 |
| 1934 | 37 | 9 | 2 |
| 1936 | 38 | 7 | 3 |
| 1937 | 39 | 6 | 3 |
| 1938 | 29 | 19 | |
| 1940 | 28 | 20 | |
| 1942 | 24 | 24 | |
| 1943 | 22 | 26 | |
| 1944 | 25 | 23 | |
| 1946 | 23 | 25 | |
| 1947 | 24 | 24 | |
| 1948 | 28 | 20 | |
| 1950 | 22 | 26 | |
| 1952 | 18 | 30 | |
| 1953 | 19 | 29 | |
| 1954 | 27 | 21 | |
| 1956 | 28 | 20 | |
| 1958 | 35 | 15 | |
| 1960 | 34 | 16 | |
| 1962 | 34 | 16 | |
| 1964 | 33 | 17 | |
| 1966 | 25 | 25 | |
| 1967 | 24 | 26 | |
| 1968 | 19 | 31 | |
| 1969 | 18 | 32 | |
| 1970 | 29 | 21 | |
| 1971 | 30 | 20 | |
| 1972 | 31 | 19 | |
| 1973 | 32 | 18 | |
| 1974 | 36 | 13 | 1 |
| 1976 | 37 | 12 | 1 |
| 1978 | 32 | 18 | |
| 1979 | 31 | 19 | |
| 1980 | 27 | 23 | |
| 1982 | 34 | 16 | |
| 1983 | 35 | 15 | |
| 1984 | 34 | 16 | |
| 1986 | 26 | 24 | |
| 1988 | 28 | 22 | |
| 1989 | 29 | 21 | |
| 1990 | 28 | 20 | 2 |
| 1992 | 30 | 18 | 2 |
| 1993 | 29 | 19 | 2 |
| 1994 | 19 | 30 | 1 |
| 1995 | 18 | 31 | 1 |
| 1996 | 17 | 32 | 1 |
| 1998 | 17 | 31 | 2 |
| 1999 | 18 | 30 | 2 |
| 2000 | 19 | 29 | 2 |
| 2001 | 21 | 27 | 2 |
| 2002 | 24 | 26 | |
| 2004 | 22 | 28 | |
| 2006 | 28 | 22 | |
| 2008 | 29 | 21 | |
| 2009 | 26 | 24 | |
| 2010 | 26 | 23 | 1 |
| 2011 | 20 | 29 | 1 |
| 2012 | 20 | 29 | 1 |
| 2013 | 20 | 30 | |
| 2014 | 21 | 29 | |
| 2015 | 18 | 31 | 1 |
| 2016 | 18 | 31 | 1 |
| 2017 | 15 | 34 | 1 |
| 2018 | 16 | 33 | 1 |
| 2019 | 23 | 27 | |
| 2020 | 24 | 26 |
The following table describes how many state governments were fully controlled by either party or split.
| Year | Democrats | Republicans | Split |
|---|---|---|---|
| 1977 | 27 | 1 | 22 |
| 1978 | 27 | 1 | 22 |
| 1979 | 19 | 5 | 26 |
| 1980 | 18 | 5 | 27 |
| 1981 | 16 | 8 | 26 |
| 1982 | 16 | 8 | 26 |
| 1983 | 24 | 4 | 22 |
| 1984 | 24 | 4 | 22 |
| 1985 | 17 | 4 | 29 |
| 1986 | 17 | 4 | 29 |
| 1987 | 15 | 7 | 28 |
| 1988 | 14 | 6 | 30 |
| 1989 | 15 | 5 | 30 |
| 1990 | 16 | 5 | 29 |
| 1991 | 16 | 3 | 31 |
| 1992 | 15 | 3 | 32 |
| 1993 | 18 | 3 | 29 |
| 1994 | 16 | 4 | 30 |
| 1995 | 8 | 15 | 27 |
| 1996 | 6 | 14 | 30 |
| 1997 | 5 | 12 | 33 |
| 1998 | 5 | 13 | 32 |
| 1999 | 8 | 15 | 27 |
| 2000 | 9 | 16 | 25 |
| 2001 | 8 | 14 | 28 |
| 2002 | 9 | 12 | 29 |
| 2003 | 8 | 12 | 30 |
| 2004 | 8 | 12 | 30 |
| 2005 | 8 | 12 | 30 |
| 2006 | 8 | 12 | 30 |
| 2007 | 15 | 10 | 25 |
| 2008 | 14 | 10 | 26 |
| 2009 | 18 | 10 | 22 |
| 2010 | 17 | 10 | 23 |
| 2011 | 11 | 22 | 17 |
| 2012 | 11 | 24 | 15 |
| 2013 | 13 | 25 | 12 |
| 2014 | 13 | 24 | 13 |
| 2015 | 7 | 24 | 19 |
| 2016 | 7 | 23 | 20 |
| 2017 | 5 | 25 | 20 |
| 2018 | 7 | 25 | 18 |
| 2019 | 14 | 23 | 13 |
| 2020 | 15 | 22 | 13 |
See also
- Comparison of U.S. state governments
- United States state legislatures' partisan trend
- Party divisions of United States Congresses
- United States Presidents and control of Congress
- List of third party performances in United States elections
References
- "Republicans Exceed Expectations in 2010 State Legislative Elections". National Conference of State Legislatures. November 3, 2010. Retrieved 2014-12-03.
- Hansen, Karen (December 2010). "Red Tide: December 2010 – A GOP wave washed over state legislatures on Election Day". National Conference of State Legislatures. Retrieved 2014-12-03.
- "Gallup Historical Trends: Party Affiliation". GALLUP News. Gallop, Inc. Retrieved 2020-05-14.
In politics, as of today, do you consider yourself a Republican, a Democrat or an independent?
- Inc, Gallup (February 22, 2019). "Democratic States Exceed Republican States by Four in 2018". Gallup.com. Retrieved 2019-10-20.
- Coleman, Miles (December 16, 2016). "2016 State PVI Changes". Decision Desk HQ. Archived from the original on 2018-06-13.
- "Partisan Voter Index by State, 1994–2014" (PDF). The Cook Political Report. 2013. Retrieved 2014-12-23.
- For example, for earlier 2014 registration figures, see: Blumenthal, Mark; Edwards-Levy, Ariel (May 27, 2014). "HUFFPOLLSTER: A State-By-State Guide To Party Registration". Huffington Post. Retrieved 2014-12-23..
- Jones, Jeffrey M (February 22, 2019). "Democratic States Exceed Republican States by Four in 2018". Gallup.com (Press release). Gallup, Inc. Retrieved 2020-05-25.
- "Number of Registered Voters by Party Within Precinct". State of Alaska – Division of Elections. May 3, 2020. Retrieved 2020-05-25.
- "Voter Registration & Historical Election Data". Arizona Department of State – Office of the Secretary of State. April 1, 2020. Retrieved 2020-05-25.CS1 maint: date and year (link)
- "Registration by County". Report of Registration - February 18, 2020 (PDF). Sacramento, Calif.: California Secretary of State. February 18, 2020. p. 11. Retrieved 2020-05-20 – via http://www.sos.ca.gov/elections/voter-registration/voter-registration-statistics/.CS1 maint: date and year (link)
- "Total Registered Voters By Party Affiliation and Status" (PDF). Colorado Secretary of State. May 1, 2020. Retrieved 2014-12-20 – via http://www.sos.state.co.us/pubs/elections/VoterRegNumbers/VoterRegNumbers.html.
- "Registration and Party Enrollment Statistics as of October 29, 2019" (PDF). Connecticut Secretary of State. October 29, 2019. Retrieved 2020-05-25 – via https://portal.ct.gov/SOTS/Election-Services/Statistics-and-Data/Statistics-and-Data.
- "Voter Registration Totals by Political Party". State of Delaware – Office of the State Election Commissioner. May 1, 2020. Retrieved 2020-05-25 – via http://elections.delaware.gov/services/candidate/regtotals.shtml.
- "Voter Registration Statistics – By Party Affiliation". Florida Division of Elections. March 31, 2020. Retrieved 2020-05-25.
- "Voter Registration Totals - County" (PDF). Iowa Secretary of State. May 1, 2020. Retrieved 2020-05-25 – via https://sos.iowa.gov/elections/voterreg/regstat.html.
- "2018 General Election – Certified Voter Registration and Party Affiliation Numbers" (XLSX). State of Kansas – Office of the Secretary of State. October 2018. Retrieved 2020-05-25 – via https://sos.kansas.gov/elections/election-statistics/.
- "Voter Registration Statistics Report" (pdf). Commonwealth of Kentucky – State Board of Elections. May 15, 2020. Retrieved 2020-05-25 – via https://elect.ky.gov/Resources/Pages/Registration-Statistics.aspx.
- "Statewide Report of Registered Voters" (PDF). Louisiana Secretary of State. May 1, 2020. Retrieved 2020-05-25 – via http://www.sos.la.gov/ElectionsAndVoting/Pages/RegistrationStatisticsStatewide.aspx.
- "Registered and Enrolled Voters - Statewide" (PDF). State of Maine – Department of the Secretary of State – Bureau of Corporations, Elections and Commissions. December 9, 2019. Retrieved 2020-05-25 – via https://www.maine.gov/sos/cec/elec/data/index.html.
- "Maryland State Board of Elections Summary of Voter Registration Activity Report" (PDF). Maryland.gov – The State Board of Elections. April 2020. Retrieved 2020-05-25 – via https://elections.maryland.gov/voter_registration/stats.html.
- "Enrollment Breakdown as of 02/12/2020" (pdf). The Commonwealth of Massachusetts. February 12, 2020. Retrieved 2020-05-25 – via https://www.sec.state.ma.us/ele/eleregistrationstats/registrationstats.htm.
- "Directory of Representatives | House.gov". www.house.gov. Retrieved 2019-10-17.
- Amash, Justin (July 4, 2019). "Opinion | Justin Amash: Our politics is in a partisan death spiral. That's why I'm leaving the GOP". Washington Post. Retrieved 2019-10-17.
- "VR Statistics Count Report – Count of Registrants Eligible to Vote" (pdf). Nebraska Secretary of State. May 1, 2020. Retrieved 2020-05-25 – via https://sos.nebraska.gov/elections/voter-registration-statistics.
- "April 2020 Voter Registration Statistics" (PDF). Nevada Secretary of State. April 30, 2020. Retrieved 2020-05-25 – via https://www.nvsos.gov/sos/elections/voters/2020-statistics.
- "Party Registration/Names on Checklist History". State of New Hampshire – Secretary of State – Elections Division. April 1, 2020. Retrieved 2020-05-25.
- "Statewide Voter Registration Summary" (PDF). State of New Jersey – Department of State. May 1, 2020. Retrieved 2014-12-20 – via https://nj.gov/state/elections/election-information-svrs.shtml.CS1 maint: date and year (link)
- "New Mexico Voter Registration Statistics Statewide by County" (pdf). New Mexico Secretary of State. April 30, 2020. Retrieved 2020-05-25 – via https://www.sos.state.nm.us/voting-and-elections/data-and-maps/voter-registration-statistics/.
- "Enrollment by County" (XLSX). New York State – Board of Elections. February 21, 2020. Retrieved 2020-05-25 – via http://www.elections.ny.gov/EnrollmentCounty.html.
- "Voter Registration Statistics". North Carolina State Board of Elections. May 23, 2020. Retrieved 2020-05-25.
- "Current Registration Statistics by County" (pdf). Oklahoma State Election Board. January 15, 2020. Retrieved 2020-05-25 – via http://www.ok.gov/elections/Voter_Info/Voter_Registration_Statistics/index.html.
- "Voter Registration Statistics" (PDF). Oregon Secretary of State. May 4, 2020. Retrieved 2020-05-25 – via http://sos.oregon.gov/elections/Pages/electionsstatistics.aspx.
- "Voter registration statistics by county" (XLSX). Pennsylvania Department of State. May 18, 2020. Retrieved 2020-05-25 – via https://www.dos.pa.gov/VotingElections/OtherServicesEvents/VotingElectionStatistics/Pages/VotingElectionStatistics.aspx.
- "Registration Status of Voters in Rhode Island". Rhode Island Department of State. May 2020. Retrieved 2020-05-25.
- "Voter Registration Tracking". South Dakota Secretary of State. May 1, 2020. Retrieved 2020-05-25.
- "Voter Registration Totals" (PDF). West Virginia Secretary of State. April 30, 2020. Retrieved 2020-05-25 – via https://sos.wv.gov/elections/Pages/VoteRegTotals.aspx.
- "Wyoming Voter Registration" (pdf). Wyoming Secretary of State. May 1, 2020. Retrieved 2020-05-25 – via https://sos.wyo.gov/elections/vrstats.aspx.
- Inc, Gallup. "2017 U.S. Party Affiliation by State". Gallup.com. Retrieved 2019-05-24.
- "U.S. Census Bureau, The 2012 Statistical Abstract, The National Data Book, Elections: Gubernatorial and State Legislatures (see: Tables 416 and 418)" (PDF). U.S. Census Bureau. August 2011. pp. 260–261. Archived (PDF) from the original on 2017-03-22. Retrieved 2020-05-14 – via https://www.census.gov/library/publications/2011/compendia/statab/131ed/elections.html.