Lincoln County, Montana
Lincoln County is a county located in the U.S. state of Montana. As of the 2010 United States Census, the population was 19,687.[2] Its county seat is Libby.[3] The county was founded in 1909 and named for President Abraham Lincoln. The county lies on Montana's north border and thus shares the US-Canadian border with the Canadian province of British Columbia.
Lincoln County | |
|---|---|
 Libby Amtrak Train Station | |
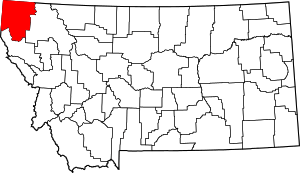 Location within the U.S. state of Montana | |
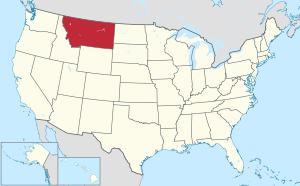 Montana's location within the U.S. | |
| Coordinates: 48°32′N 115°25′W | |
| Country | |
| State | |
| Founded | March 9, 1909[1] |
| Named for | Abraham Lincoln |
| Seat | Libby |
| Largest city | Libby |
| Area | |
| • Total | 3,675 sq mi (9,520 km2) |
| • Land | 3,613 sq mi (9,360 km2) |
| • Water | 62 sq mi (160 km2) 1.7% |
| Population (2010) | |
| • Total | 19,687 |
| • Estimate (2018) | 19,794 |
| • Density | 5.4/sq mi (2.1/km2) |
| Time zone | UTC−7 (Mountain) |
| • Summer (DST) | UTC−6 (MDT) |
| Congressional district | At-large |
| Website | www |
| |
This heavily wooded and mountainous county once was part of Flathead County until residents of Libby and Eureka petitioned the state legislature for separation. Libby won an election over Eureka to host the county seat.[4]
Geography
According to the US Census Bureau, the county has a total area of 3,675 square miles (9,520 km2), of which 3,615 square miles (9,360 km2) is land and 62 square miles (160 km2) (1.7%) is water.[5] The county borders the Canadian province of British Columbia to the north. The lowest point in the state of Montana is located on the Kootenai River in Lincoln County, where it flows out of Montana and into Idaho. Upstream, Libby Dam backs up huge Lake Koocanusa (combination name of Kootenai, Canada, USA) into Canada's British Columbia.
Adjacent counties and county-equivalents
- Regional District of Central Kootenay, British Columbia – northwest
- Regional District of East Kootenay, British Columbia – north
- Flathead County – east
- Sanders County – south
- Bonner County, Idaho – southwest/Pacific Time Border
- Boundary County, Idaho – northwest/Pacific Time Border
National protected areas
- Pacific Northwest National Scenic Trail (part)
- Flathead National Forest (part)
- Kaniksu National Forest (part)
- Kootenai National Forest (part)
Demographics
| Historical population | |||
|---|---|---|---|
| Census | Pop. | %± | |
| 1910 | 3,638 | — | |
| 1920 | 7,797 | 114.3% | |
| 1930 | 7,089 | −9.1% | |
| 1940 | 7,882 | 11.2% | |
| 1950 | 8,693 | 10.3% | |
| 1960 | 12,537 | 44.2% | |
| 1970 | 18,063 | 44.1% | |
| 1980 | 17,752 | −1.7% | |
| 1990 | 17,481 | −1.5% | |
| 2000 | 18,837 | 7.8% | |
| 2010 | 19,687 | 4.5% | |
| Est. 2018 | 19,794 | [6] | 0.5% |
| US Decennial Census[7] 1790–1960[8] 1900–1990[9] 1990–2000[10] 2010–2018[2] | |||
2000 census
As of the 2000 United States Census,[11] there were 18,837 people, 7,764 households, and 5,333 families living in the county. The population density was 5 people per square mile (2/km²). There were 9,319 housing units at an average density of 3 per square mile (1/km²). The racial makeup of the county was 96.09% White, 0.11% Black or African American, 1.20% Native American, 0.31% Asian, 0.04% Pacific Islander, 0.39% from other races, and 1.86% from two or more races. 1.44% of the population were Hispanic or Latino of any race. 23.6% were of German, 12.0% English, 10.2% American, 9.8% Norwegian and 9.4% Irish ancestry. 96.5% spoke English, 1.7% German and 1.3% Spanish as their first language.
There were 7,764 households out of which 29.10% had children under the age of 18 living with them, 57.10% were married couples living together, 7.80% had a female householder with no husband present, and 31.30% were non-families. 26.70% of all households were made up of individuals and 10.00% had someone living alone who was 65 years of age or older. The average household size was 2.40 and the average family size was 2.90.
The county population contained 25.30% under the age of 18, 5.50% from 18 to 24, 24.20% from 25 to 44, 29.70% from 45 to 64, and 15.20% who were 65 years of age or older. The median age was 42 years. For every 100 females there were 102.70 males. For every 100 females age 18 and over, there were 100.50 males.
The median income for a household in the county was $26,754, and the median income for a family was $31,784. Males had a median income of $30,299 versus $20,600 for females. The per capita income for the county was $13,923. About 14.20% of families and 19.20% of the population were below the poverty line, including 26.40% of those under age 18 and 10.80% of those age 65 or over.
2010 census
As of the 2010 United States Census, there were 19,687 people, 8,843 households, and 5,608 families living in the county.[12] The population density was 5.4 inhabitants per square mile (2.1/km2). There were 11,413 housing units at an average density of 3.2 per square mile (1.2/km2).[13] The racial makeup of the county was 95.9% white, 0.9% American Indian, 0.3% Asian, 0.1% black or African American, 0.4% from other races, and 2.3% from two or more races. Those of Hispanic or Latino origin made up 2.3% of the population.[12] In terms of ancestry, 31.5% were German, 15.7% were Irish, 15.3% were English, 10.2% were Norwegian, and 3.3% were American.[14]
Of the 8,843 households, 23.2% had children under the age of 18 living with them, 52.0% were married couples living together, 7.4% had a female householder with no husband present, 36.6% were non-families, and 30.6% of all households were made up of individuals. The average household size was 2.20 and the average family size was 2.72. The median age was 48.9 years.[12]
The median income for a household in the county was $30,823 and the median income for a family was $39,600. Males had a median income of $40,944 versus $24,965 for females. The per capita income for the county was $19,626. About 13.7% of families and 18.6% of the population were below the poverty line, including 28.2% of those under age 18 and 12.1% of those age 65 or over.[15]
Politics
For its first eighty years, Lincoln County was a Democratic-leaning area that would vote Republican only during large GOP landslides. Only four Republicans were to win the county in the seventeen Presidential elections between its inaugural election in 1912 and 1976. However, like many timber-dependent counties, it has become overwhelmingly Republican since that time. The last Democrat to carry Lincoln County was Michael Dukakis during the drought-influenced 1988 election. Since then, no Democrat has reached 35 percent of the county’s vote.
| Year | Republican | Democratic | Third parties |
|---|---|---|---|
| 2016 | 72.1% 6,729 | 21.9% 2,041 | 6.0% 560 |
| 2012 | 68.1% 6,057 | 28.7% 2,552 | 3.2% 281 |
| 2008 | 61.8% 5,704 | 32.8% 3,025 | 5.4% 498 |
| 2004 | 69.7% 5,889 | 27.5% 2,320 | 2.8% 240 |
| 2000 | 71.1% 5,578 | 20.8% 1,629 | 8.1% 639 |
| 1996 | 45.2% 3,552 | 34.4% 2,705 | 20.5% 1,609 |
| 1992 | 33.4% 2,799 | 33.0% 2,765 | 33.6% 2,814[lower-alpha 1] |
| 1988 | 48.0% 3,500 | 49.4% 3,601 | 2.7% 193 |
| 1984 | 56.8% 4,080 | 41.2% 2,959 | 2.0% 145 |
| 1980 | 57.2% 4,202 | 33.0% 2,422 | 9.9% 724 |
| 1976 | 48.0% 3,017 | 50.1% 3,146 | 1.9% 120 |
| 1972 | 52.8% 3,276 | 38.7% 2,402 | 8.5% 530 |
| 1968 | 40.6% 2,355 | 46.1% 2,677 | 13.3% 775 |
| 1964 | 33.0% 1,554 | 66.7% 3,140 | 0.3% 15 |
| 1960 | 41.8% 1,902 | 57.7% 2,623 | 0.5% 21 |
| 1956 | 50.4% 2,321 | 49.6% 2,286 | |
| 1952 | 49.2% 1,881 | 49.9% 1,907 | 0.9% 33 |
| 1948 | 37.3% 1,079 | 58.4% 1,689 | 4.3% 125 |
| 1944 | 42.8% 1,109 | 55.8% 1,445 | 1.4% 35 |
| 1940 | 36.3% 1,250 | 62.4% 2,150 | 1.4% 48 |
| 1936 | 24.4% 745 | 69.4% 2,117 | 6.2% 188 |
| 1932 | 28.7% 833 | 64.3% 1,867 | 7.1% 206 |
| 1928 | 52.3% 1,217 | 45.9% 1,067 | 1.9% 43 |
| 1924 | 40.9% 976 | 15.7% 374 | 43.4% 1,037 |
| 1920 | 57.5% 1,187 | 33.1% 683 | 9.4% 193 |
| 1916 | 35.4% 807 | 52.0% 1,186 | 12.7% 290 |
| 1912 | 21.7% 218 | 34.4% 346 | 43.9% 441[lower-alpha 2] |
See also
- List of cemeteries in Lincoln County, Montana
- List of lakes in Lincoln County, Montana
- List of mountains in Lincoln County, Montana (A-L)
- List of mountains in Lincoln County, Montana (M-Z)
- National Register of Historic Places listings in Lincoln County MT
Notes
- The leading “other” candidate, Independent Ross Perot, received 2,637 votes, while Independent James Bo Gritz received 149 votes and Libertarian Andre Marrou received 28 votes.
- The leading “other” candidate, Progressive Theodore Roosevelt, received 22,456 votes, while Socialist candidate Eugene Debs received 10,885 votes and Write-in candidate Eugene Chafin received 32 votes.
References
- "Montana County Formation Table". genealogytrails.com. Retrieved April 3, 2018.
- "State & County QuickFacts". US Census Bureau. Archived from the original on July 13, 2011. Retrieved September 15, 2013.
- "Find a County". National Association of Counties. Retrieved June 7, 2011.
- Montana Place Names – Montana History Wiki
- "2010 Census Gazetteer Files". US Census Bureau. August 22, 2012. Archived from the original on December 5, 2014. Retrieved November 28, 2014.
- "Population and Housing Unit Estimates". Retrieved July 29, 2019.
- "US Decennial Census". US Census Bureau. Retrieved November 28, 2014.
- "Historical Census Browser". University of Virginia Library. Retrieved November 28, 2014.
- "Population of Counties by Decennial Census: 1900 to 1990". US Census Bureau. Retrieved November 28, 2014.
- "Census 2000 PHC-T-4. Ranking Tables for Counties: 1990 and 2000" (PDF). US Census Bureau. Retrieved November 28, 2014.
- "U.S. Census website". US Census Bureau. Retrieved January 31, 2008.
- "Profile of General Population and Housing Characteristics: 2010 Demographic Profile Data". US Census Bureau. Archived from the original on February 13, 2020. Retrieved January 10, 2016.
- "Population, Housing Units, Area, and Density: 2010 – County". US Census Bureau. Archived from the original on February 13, 2020. Retrieved January 10, 2016.
- "Selected Social Characteristics in the US – 2006–2010 American Community Survey 5-Year Estimates". US Census Bureau. Archived from the original on February 13, 2020. Retrieved January 10, 2016.
- "Selected Economic Characteristics – 2006–2010 American Community Survey 5-Year Estimates". US Census Bureau. Archived from the original on February 13, 2020. Retrieved January 10, 2016.
- Dodge Summit MT Google Maps (accessed 3 January 2019)
- Jennings MT Google Maps (accessed 3 January 2019)
- Kootenai Falls MT Google Maps (accessed 3 January 2019)
- Tobacco MT Google Maps (accessed 3 January 2019)
- Yarnell MT Google Maps (accessed 3 January 2019)
- Leip, David. "Atlas of US Presidential Elections". uselectionatlas.org. Retrieved April 3, 2018.
External links
Places adjacent to Lincoln County, Montana | |
|---|---|
Municipalities and communities of Lincoln County, Montana, United States | ||
|---|---|---|
| Cities | Lincoln County map | |
| Towns | ||
| CDPs | ||
| Other unincorporated communities | ||
| Authority control |
|
|---|