Mineral County, Montana
Mineral County is a county located in the U.S. state of Montana. As of the 2010 United States Census, the population was 4,223.[1] Its county seat is Superior.[2]
Mineral County | |
|---|---|
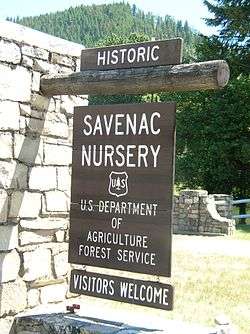 Welcome Sign at Historic Savenac Tree Nursery | |
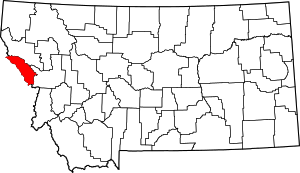 Location within the U.S. state of Montana | |
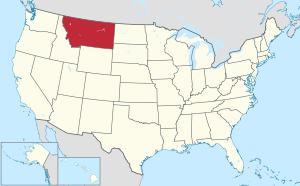 Montana's location within the U.S. | |
| Coordinates: 47°09′N 114°59′W | |
| Country | |
| State | |
| Founded | 1914 |
| Seat | Superior |
| Largest town | Superior |
| Area | |
| • Total | 1,223 sq mi (3,170 km2) |
| • Land | 1,219 sq mi (3,160 km2) |
| • Water | 3.8 sq mi (10 km2) 0.3% |
| Population (2010) | |
| • Total | 4,223 |
| • Estimate (2018) | 4,316 |
| • Density | 3.5/sq mi (1.3/km2) |
| Time zone | UTC−7 (Mountain) |
| • Summer (DST) | UTC−6 (MDT) |
| Congressional district | At-large |
| Website | www |
| |
Geography
According to the U.S. Census Bureau, the county has a total area of 1,223 square miles (3,170 km2), of which 1,219 square miles (3,160 km2) is land and 3.8 square miles (9.8 km2) (0.3%) is water.[3]
Major highways


Adjacent counties
- Sanders County - north
- Missoula County - east
- Clearwater County, Idaho - southwest/Pacific Time Border
- Shoshone County, Idaho - northwest/Pacific Time Border
National protected area
- Lolo National Forest (part)
Politics
Mineral County has voted for the Republican Party candidate in all national elections since 2000. Before that, its voting was more balanced.
| Year | Republican | Democratic | Third parties |
|---|---|---|---|
| 2016 | 66.1% 1,330 | 25.8% 519 | 8.1% 163 |
| 2012 | 60.2% 1,216 | 34.6% 700 | 5.2% 105 |
| 2008 | 52.7% 1,053 | 42.3% 845 | 5.0% 99 |
| 2004 | 67.6% 1,242 | 29.5% 542 | 2.9% 53 |
| 2000 | 65.8% 1,078 | 23.3% 382 | 10.9% 179 |
| 1996 | 34.0% 549 | 40.7% 658 | 25.3% 408 |
| 1992 | 24.7% 403 | 40.6% 664 | 34.7% 568 |
| 1988 | 43.1% 616 | 55.3% 789 | 1.6% 23 |
| 1984 | 55.3% 943 | 42.1% 718 | 2.5% 43 |
| 1980 | 48.3% 800 | 39.8% 660 | 11.9% 197 |
| 1976 | 44.9% 679 | 54.1% 819 | 1.1% 16 |
| 1972 | 49.8% 706 | 46.4% 659 | 3.8% 54 |
| 1968 | 41.3% 483 | 49.3% 576 | 9.4% 110 |
| 1964 | 28.9% 368 | 70.7% 901 | 0.4% 5 |
| 1960 | 44.3% 549 | 55.3% 686 | 0.4% 5 |
| 1956 | 52.3% 606 | 47.7% 552 | 0.0% 0 |
| 1952 | 52.5% 553 | 46.6% 491 | 1.0% 10 |
| 1948 | 39.3% 338 | 55.2% 475 | 5.5% 47 |
| 1944 | 48.0% 380 | 50.6% 401 | 1.4% 11 |
| 1940 | 37.6% 402 | 60.4% 645 | 2.0% 21 |
| 1936 | 22.4% 215 | 68.4% 657 | 9.2% 88 |
| 1932 | 27.2% 260 | 60.5% 578 | 12.3% 117 |
| 1928 | 53.3% 443 | 44.5% 370 | 2.3% 19 |
| 1924 | 21.6% 223 | 11.9% 123 | 66.5% 686 |
| 1920 | 39.0% 347 | 40.7% 362 | 20.3% 180 |
| 1916 | 20.5% 251 | 63.7% 781 | 15.8% 194 |
Demographics
| Historical population | |||
|---|---|---|---|
| Census | Pop. | %± | |
| 1920 | 2,327 | — | |
| 1930 | 1,626 | −30.1% | |
| 1940 | 2,135 | 31.3% | |
| 1950 | 2,081 | −2.5% | |
| 1960 | 3,037 | 45.9% | |
| 1970 | 2,958 | −2.6% | |
| 1980 | 3,675 | 24.2% | |
| 1990 | 3,315 | −9.8% | |
| 2000 | 3,884 | 17.2% | |
| 2010 | 4,223 | 8.7% | |
| Est. 2018 | 4,316 | [5] | 2.2% |
| US Decennial Census[6] 1790-1960[7] 1900-1990[8] 1990-2000[9] 2010-2018[1] | |||
2000 census
As of the 2000 United States Census,[10] there were 3,884 people, 1,584 households, and 1,067 families in the county. The population density was 3 people per square mile (1/km²). There were 1,961 housing units at an average density of 2 per square mile (1/km²). The racial makeup of the county was 94.57% White, 0.21% Black or African American, 1.93% Native American, 0.51% Asian, 0.03% Pacific Islander, 0.26% from other races, and 2.50% from two or more races. 1.57% of the population were Hispanic or Latino of any race. 22.5% were of German, 14.6% Irish, 9.9% English, 8.1% American and 8.0% Norwegian ancestry. Irish is the 5th most common language spoken at home.
There were 1,584 households out of which 27.70% had children under the age of 18 living with them, 57.70% were married couples living together, 6.00% had a female householder with no husband present, and 32.60% were non-families. 26.60% of all households were made up of individuals and 8.20% had someone living alone who was 65 years of age or older. The average household size was 2.41 and the average family size was 2.90.
The county population contained 24.30% under the age of 18, 6.40% from 18 to 24, 25.30% from 25 to 44, 29.80% from 45 to 64, and 14.20% who were 65 years of age or older. The median age was 41 years. For every 100 females there were 106.20 males. For every 100 females age 18 and over, there were 105.60 males.
The median income for a household in the county was $27,143, and the median income for a family was $32,096. Males had a median income of $26,782 versus $18,258 for females. The per capita income for the county was $15,166. About 12.80% of families and 15.80% of the population were below the poverty line, including 18.70% of those under age 18 and 8.50% of those age 65 or over.
2010 census
As of the 2010 United States Census, there were 4,223 people, 1,911 households, and 1,229 families in the county.[11] The population density was 3.5 inhabitants per square mile (1.4/km2). There were 2,446 housing units at an average density of 2.0 per square mile (0.77/km2).[12] The racial makeup of the county was 94.9% white, 1.5% American Indian, 0.7% Asian, 0.3% black or African American, 0.2% from other races, and 2.4% from two or more races. Those of Hispanic or Latino origin made up 1.9% of the population.[11] In terms of ancestry, 30.9% were German, 16.9% were Irish, 15.4% were English, and 3.0% were American.[13]
Of the 1,911 households, 21.9% had children under the age of 18 living with them, 52.4% were married couples living together, 7.3% had a female householder with no husband present, 35.7% were non-families, and 29.7% of all households were made up of individuals. The average household size was 2.20 and the average family size was 2.69. The median age was 49.8 years.[11]
The median income for a household in the county was $37,256 and the median income for a family was $44,271. Males had a median income of $35,536 versus $20,370 for females. The per capita income for the county was $19,209. About 12.7% of families and 19.0% of the population were below the poverty line, including 36.0% of those under age 18 and 4.3% of those age 65 or over.[14]
Communities
Unincorporated communities
Former communities
See also
- List of cemeteries in Mineral County, Montana
- List of lakes in Mineral County, Montana
- List of mountains in Mineral County, Montana
- National Register of Historic Places listings in Mineral County, Montana
References
- "State & County QuickFacts". US Census Bureau. Archived from the original on June 6, 2011. Retrieved September 15, 2013.
- "Find a County". National Association of Counties. Retrieved June 7, 2011.
- "2010 Census Gazetteer Files". US Census Bureau. August 22, 2012. Archived from the original on December 5, 2014. Retrieved November 29, 2014.
- Leip, David. "Atlas of US Presidential Elections". uselectionatlas.org. Retrieved April 3, 2018.
- "Population and Housing Unit Estimates". Retrieved August 6, 2019.
- "US Decennial Census". US Census Bureau. Retrieved November 29, 2014.
- "Historical Census Browser". University of Virginia Library. Retrieved November 29, 2014.
- "Population of Counties by Decennial Census: 1900 to 1990". US Census Bureau. Retrieved November 29, 2014.
- "Census 2000 PHC-T-4. Ranking Tables for Counties: 1990 and 2000" (PDF). US Census Bureau. Retrieved November 29, 2014.
- "U.S. Census website". US Census Bureau. Retrieved January 31, 2008.
- "Profile of General Population and Housing Characteristics: 2010 Demographic Profile Data". US Census Bureau]]. Archived from the original on February 13, 2020. Retrieved January 10, 2016.
- "Population, Housing Units, Area, and Density: 2010 - County". US Census Bureau. Archived from the original on February 13, 2020. Retrieved January 10, 2016.
- "Selected Social Characteristics in the US – 2006-2010 American Community Survey 5-Year Estimates". US Census Bureau. Archived from the original on February 13, 2020. Retrieved January 10, 2016.
- "Selected Economic Characteristics – 2006-2010 American Community Survey 5-Year Estimates". US Census Bureau. Archived from the original on February 13, 2020. Retrieved January 10, 2016.
- Boxax, Saltese MT Google Maps (accessed January 3, 2019)
- Bryson MT Google Maps (accessed January 3, 2019)
- Cabin City MT Google Maps (accessed January 3, 2019)
- Cyr MT Google Maps (accessed January 3, 2019)
- Drexel MT Google Maps (accessed January 3, 2019)
- East Portal MT Google Maps (accessed January 3, 2019)
- Foraker MT Google Maps (accessed January 3, 2019)
- Henderson MT Google Maps (accessed January 3, 2019)
- Keystone MT Google Maps (accessed January 3, 2019)
- Lozeau MT Google Maps (accessed January 3, 2019)
- Quartz MT Google Maps (accessed January 3, 2019)
- Sonon MT Google Maps (accessed January 3, 2019)
- Spring Gulch MT Google Maps (accessed January 3, 2019)
- Tammany MT Google Maps (accessed January 3, 2019)
- Tarkio MT Google Maps (accessed January 3, 2019)
- Westfall MD Google Maps (accessed January 3, 2019)
Places adjacent to Mineral County, Montana | ||||||||||
|---|---|---|---|---|---|---|---|---|---|---|
| ||||||||||
Municipalities and communities of Mineral County, Montana, United States | ||
|---|---|---|
| Towns | Mineral County map | |
| CDPs | ||
| Unincorporated communities | ||
| Authority control |
|
|---|