La Palma, California
La Palma is a city in Orange County, California, United States. The population was 15,568 at the 2010 Census,[7] up from 15,408 at the 2000 census.[8]
La Palma, California | |
|---|---|
City | |
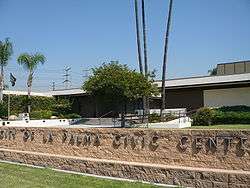 La Palma Civic Center | |
 Seal | |
| Motto(s): "Where Tradition and Vision Come Together"[1] | |
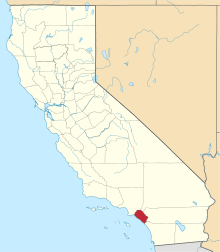
 Location of La Palma in Orange County, California. | |
 La Palma, California Location in the United States | |
| Coordinates: 33°50′58″N 118°2′38″W | |
| Country | |
| State | |
| County | Orange |
| Incorporated | October 26, 1955[2] |
| Government | |
| • City Council[3] | Marshall Goodman (Mayor) Peter Kim (Mayor Pro Tem) Gerard Goedhart Nitesh Patel Michele Steggell |
| • City Manager | Laurie A. Murray[4] |
| Area | |
| • Total | 1.81 sq mi (4.68 km2) |
| • Land | 1.78 sq mi (4.62 km2) |
| • Water | 0.02 sq mi (0.06 km2) 1.32% |
| Elevation | 46 ft (14 m) |
| Population (2010) | |
| • Total | 15,568 |
| • Estimate (2019)[6] | 15,428 |
| • Density | 8,846.89/sq mi (3,414.96/km2) |
| Time zone | UTC-8 (PST) |
| • Summer (DST) | UTC-7 (PDT) |
| ZIP code | 90623 |
| Area code(s) | 562/714/657 |
| FIPS code | 06-40256 |
| GNIS feature ID | 1652737 |
| Website | cityoflapalma.org |
In 2013, La Palma was ranked 31st in the "Best places to live" among small cities (50,000 or less) in the United States by CNN's Money magazine.[9] In 2007, it was ranked 16th best place to live in the US.[10] The rankings are based on the small-and-friendly neighborhood vibe, high-ranking schools, low crime-rate and the lowest police response time in Orange County.
History
.jpg)
La Palma was incorporated on October 26, 1955. It was originally incorporated as Dairyland, and was one of three dairy cities in the region (the other two being Dairy Valley in Cerritos and Dairy City in Cypress) but when the dairies moved east in 1965, the name of the community was changed to La Palma, after the region's Spanish heritage and its main thoroughfare, La Palma Avenue.[11]
Geography
La Palma is located at 33°50′58″N 118°2′38″W (33.849327, -118.043951).[12]
It is bordered by Cerritos on the north and west, Cypress on the south and west, and Buena Park on the east.
According to the United States Census Bureau, the city has a total area of 1.83 square miles (4.7 km2). 1.8 square miles (4.7 km2) of it is land and 0.02 square miles (0.052 km2) of it (1.32%) is water. This makes it the smallest city in Orange County in terms of area.
Demographics
| Historical population | |||
|---|---|---|---|
| Census | Pop. | %± | |
| 1960 | 622 | — | |
| 1970 | 9,687 | 1,457.4% | |
| 1980 | 15,399 | 59.0% | |
| 1990 | 15,392 | 0.0% | |
| 2000 | 15,408 | 0.1% | |
| 2010 | 15,568 | 1.0% | |
| Est. 2019 | 15,428 | [6] | −0.9% |
| U.S. Decennial Census[13] | |||
2010
The 2010 US Census[7] reported that La Palma had a population of 15,568. The population density was 8,499.1 people per square mile (3,281.5/km²). The racial makeup of La Palma was 5,762 (37.0%) White (27.8% Non-Hispanic White),[14] 802 (5.2%) African American, 56 (0.4%) Native American, 7,483 (48.1%) Asian, 41 (0.3%) Pacific Islander, 760 (4.9%) from other races, and 664 (4.3%) from two or more races. Hispanic or Latino of any race were 2,487 persons (16.0%).
The census reported that 15,548 people (99.9% of the population) lived in households, 14 (0.1%) lived in non-institutionalized group quarters, and 6 (0%) were institutionalized.
There were 5,080 households, 1,949 (38.4%) had children under the age of 18 living in them, 3,331 (65.6%) were opposite-sex married couples living together, 641 (12.6%) had a female householder with no husband present, 240 (4.7%) had a male householder with no wife present. There were 134 (2.6%) unmarried opposite-sex partnerships, and 26 (0.5%) same-sex married couples or partnerships. 716 households (14.1%) were one person and 389 (7.7%) had someone living alone who was 65 or older. The average household size was 3.06. There were 4,212 families (82.9% of households); the average family size was 3.37.
The age distribution was 3,423 people (22.0%) under the age of 18, 1,418 people (9.1%) aged 18 to 24, 3,805 people (24.4%) aged 25 to 44, 4,445 people (28.6%) aged 45 to 64, and 2,477 people (15.9%) who were 65 or older. The median age was 41.2 years. For every 100 females, there were 93.5 males. For every 100 females age 18 and over, there were 90.7 males.
There were 5,224 housing units at an average density of 2,852.0 per square mile, of the occupied units 3,648 (71.8%) were owner-occupied and 1,432 (28.2%) were rented.The homeowner vacancy rate was 0.3%; the rental vacancy rate was 6.0%. 11,315 people (72.7% of the population) lived in owner-occupied housing units and 4,233 people (27.2%) lived in rental housing units.
According to the 2010 United States Census, La Palma had a median household income of $87,289, with 7.2% of the population living below the federal poverty line.[14]
2000
At the 2000 census there were 15,408 people in 4,979 households, including 4,227 families, in the city. The population density was 8,499.3 inhabitants per square mile (3,286.8/km²). There were 5,066 housing units at an average density of 2,794.5 per square mile (1,080.7/km²). The racial makeup of the city was 44.6% Asian, 36.3% White, 10.3% Hispanic, 4.5% Black, .3% Pacific Islander, .2% Native American, .2% from other races, and 3.5% from two or more races.[15] Of the 4,979 households 37.3% had children under the age of 18 living with them, 69.5% were married couples living together, 10.8% had a female householder with no husband present, and 15.1% were non-families. 11.6% of households were one person and 3.6% were one person aged 65 or older. The average household size was 3.09 and the average family size was 3.35.
The age distribution was 23.8% under the age of 18, 8.7% from 18 to 24, 29.0% from 25 to 44, 28.3% from 45 to 64, and 10.2% 65 or older. The median age was 38 years. For every 100 females, there were 95.5 males. For every 100 females age 18 and over, there were 93.3 males.
The median household income was $68,438 and the median family income was $74,524. Males had a median income of $50,988 versus $36,242 for females. The per capita income for the city was $26,598. About 4.0% of families and 4.9% of the population were below the poverty line, including 6.0% of those under age 18 and 2.8% of those age 65 or over.
Economy
Top employers
According to La Palma's 2010 Comprehensive Annual Financial Report,[16] the top employers in the city were:
| # | Employer | # of Employees |
|---|---|---|
| 1 | ADP | 600 |
| 2 | La Palma Intercommunity Hospital | 480 |
| 3 | BP West Coast Products | 300 |
| 4 | Unisource Worldwide | 300 |
| 5 | Anaheim Union High School District | 205 |
| 6 | Performance Machine | 205 |
| 7 | Kellogg's | 200 |
| 8 | Arcadia | 150 |
| 9 | Honeywell | 100 |
| 10 | C & D Zodiac | 80 |
Government and politics
According to the California Secretary of State, as of February 10, 2019, La Palma has 8,358 registered voters. Of those, 2,998 (35.87%) are registered Democrats, 2,637 (31.55%) are registered Republicans, and 2,446 (29.27%) have declined to state a political party/are independents.[17]
| Year | Democratic | Republican | Third Parties |
|---|---|---|---|
| 2016[18] | 53.51% 3,441 | 40.52% 2,606 | 5.97% 384 |
| 2012[19] | 49.32% 3,135 | 48.82% 3,103 | 1.86% 118 |
| 2008[20] | 48.49% 3,207 | 49.67% 3,285 | 1.84% 122 |
| 2004[21] | 41.98% 2,607 | 57.07% 3,544 | 0.95% 59 |
| 2000[22] | 43.20% 2,468 | 54.10% 3,091 | 2.70% 154 |
| 1996[23] | 41.77% 2,292 | 48.19% 2,644 | 10.04% 551 |
| 1992[24] | 31.55% 2,030 | 45.15% 2,905 | 23.30% 1,499 |
| 1988[25] | 29.38% 1,814 | 69.68% 4,303 | 0.94% 58 |
| 1984[26] | 22.60% 1,399 | 76.63% 4,744 | 0.78% 48 |
| 1980[27] | 24.04% 1,393 | 67.94% 3,937 | 8.02% 465 |
In the California State Legislature, La Palma is in the 29th Senate District, represented by Republican Ling Ling Chang, and in the 65th Assembly District, represented by Democrat Sharon Quirk-Silva.[28]
In the United States House of Representatives, La Palma is in California's 38th congressional district, represented by Democrat Linda Sánchez.[29]
Education
Infrastructure
Emergency services
Fire protection in La Palma is provided by the Orange County Fire Authority with ambulance transport by Care Ambulance Service. The La Palma Police Department provides law enforcement services under the command of Police Chief Terry Kim.
References
- "City of La Palma, California Website". City of La Palma, California Website. Retrieved September 14, 2012.
- "California Cities by Incorporation Date". California Association of Local Agency Formation Commissions. Archived from the original (Word) on November 3, 2014. Retrieved August 25, 2014.
- "City Council". La Palma, CA. Retrieved November 9, 2014.
- "Administration". La Palma, CA. Retrieved June 9, 2016.
- "2016 U.S. Gazetteer Files". United States Census Bureau. Retrieved July 19, 2017.
- "Population and Housing Unit Estimates". Retrieved May 21, 2020.
- "2010 Census Interactive Population Search: CA - La Palma city". U.S. Census Bureau. Archived from the original on July 15, 2014. Retrieved July 12, 2014.
- "U.S. Census website". United States Census Bureau. Retrieved October 23, 2014.
- "La Palma, CA - Best Places to Live 2013 - Money Magazine". Money.cnn.com. July 29, 2013. Retrieved May 31, 2020.
- "MONEY Magazine: Best places to live 2007: La Palma, CA snapshot". Money.cnn.com. Retrieved May 31, 2020.
- "Profile for La Palma, California, CA". Moma. Retrieved September 12, 2012.
- "US Gazetteer files: 2010, 2000, and 1990". United States Census Bureau. February 12, 2011. Retrieved April 23, 2011.
- "Census of Population and Housing". Census.gov. Retrieved June 4, 2015.
- "Archived copy". Archived from the original on January 13, 2014. Retrieved December 18, 2013.CS1 maint: archived copy as title (link)
- "U.S. Census website". United States Census Bureau. Retrieved January 31, 2008.
- City of La Palma CAFR
- "CA Secretary of State – Report of Registration – February 10, 2019" (PDF). ca.gov. Retrieved June 26, 2019.
- "SOV.xls" (PDF). www.ocvote.com. 2016. Retrieved May 31, 2020.
- "SOV.xls" (PDF). www.ocvote.com. 2012. Retrieved May 31, 2020.
- "SOV.xls" (PDF). www.ocvote.com. 2008. Retrieved May 31, 2020.
- "SOV.xls" (PDF). www.ocvote.com. 2013. Retrieved May 31, 2020.
- "SOV.xls" (PDF). Retrieved May 31, 2020.
- California. Secretary of State (March 30, 1968). "Statement of vote". Sacramento, Calif. : The Secretary – via Internet Archive.
- California. Secretary of State (March 30, 1968). "Statement of vote". Sacramento, Calif. : The Secretary – via Internet Archive.
- Statement of the Vote. Sacramento, Calif. : The Secretary. 1968.
- Statement of the Vote. Sacramento, Calif. : The Secretary. 1968.
- Statement of the Vote. Sacramento, Calif. : The Secretary. 1968.
- "Statewide Database". Regents of the University of California. Archived from the original on February 1, 2015. Retrieved March 25, 2015.
- "California's 38th Congressional District - Representatives & District Map". Civic Impulse, LLC.
External links
| Wikimedia Commons has media related to La Palma, California. |
- City of La Palma, California Website Portal style website, Government, Business, Library, Recreation and more
- Money Magazine Top 100 Places to Live
- City-Data.com Comprehensive Statistical Data and more about La Palma
Destinations from La Palma | |
|---|---|
Municipalities and communities of Orange County, California, United States | ||
|---|---|---|
| Cities |
|  Orange County map |
| CDPs | ||
| Unincorporated communities | ||
| Ghost towns | ||

| Authority control |
|
|---|