Immigration to Canada
Immigration to Canada is the process by which people migrate to Canada for the purpose of residing there—and where a majority go on to become Canadian citizens. Following 1947, Canadian domestic immigration law and policy went through significant changes, most notably with the Immigration Act, 1976, and the current Immigration and Refugee Protection Act (IRPA) from 2002.
| Canadian citizenship |
|---|
.svg.png) |
| This article is part of a series |
| Immigration |
| Canadian nationality law |
|
| Agencies |
| Immigration, Refugees and Citizenship Canada |
| Citizenship classes |
| Issues |
|
| Demographics of Canada |
|
In Canadian law, immigrants are distinguished by four categories:[1]
- Family: persons closely related to one or more Canadian residents who live in Canada.[lower-roman 1]
- Economic: skilled workers, caregivers, or business persons.
- Protected person or Refugee: persons who are escaping persecution, torture, and/or cruel and unusual punishment.[lower-roman 2]
- Humanitarian or other: persons accepted as immigrants for humanitarian or compassionate reasons.
In 2016, Canada admitted 296,346 permanent residents, compared to 271,845 the previous year—the highest admissions levels since 2010.[1] Among those admitted, 53% were economic immigrants and their accompanying immediate families; 26% were family class; 20% were either resettled refugees or protected persons; and 1% were in the humanitarian and other category.[1] By 2019, permanent residents admitted to Canada grew to 341,180. [2]
Canadian immigration policies are continuing to evolve. In 2008, Citizenship and Immigration Canada (now IRCC) made significant changes in order to streamline the steady flow of immigrants, such as by reducing professional categories for skilled immigration and eliminating caps for immigrants in various categories.[3] Likewise, in 2015, Canada introduced the 'Express Entry' system, providing a streamlined application process for many economic immigrants.[4] Additional changes were made in April and May 2017.[1]
According to 2016 Census data via Statistics Canada, over one in five Canadians were born abroad, while 22.3% of the Canadian population belonged to visible minorities, of whom 3 in 10 were born in Canada.[5] Moreover, 21.9% of the Canadian population reported themselves as being or having been a landed immigrant or permanent resident in Canada—close to the 1921 Census record of 22.3%, the highest level Canada has seen since Confederation in 1867.[5]
From 2013–2014, most of the Canadian public, as well as the country's major political parties, supported either sustaining or increasing the current level of immigration.[6][7] A sociological study conducted in 2014 concluded that "Australia and Canada are the most receptive to immigration among western nations."[8] In 2017, an Angus Reid poll indicated that a majority of respondents believed that Canada should accept fewer immigrants and refugees.[9]
History of immigration

Following initial British and French colonization, what is now Canada has seen four major waves (or peaks) of immigration and settlement of non-Aboriginal Peoples take place over a span of nearly two centuries. Canada is currently undergoing its fifth wave.
Periods of low immigration in Canada have also occurred: international movement was very difficult during the world wars, and there was a lack of jobs "pulling" workers to Canada during the Great Depression in Canada. Statistics Canada has tabulated the effect of immigration on population growth in Canada from 1851 to 2001.[10]
First wave
The first significant wave of non-Aboriginal immigration to Canada occurred over almost two centuries with slow, but progressive, French settlement in Quebec and Acadia, along with smaller numbers of American and European entrepreneurs in addition to British military personnel. This wave culminated with the influx of 46–50,000 British Loyalists fleeing the American Revolution, chiefly from the Mid-Atlantic States, mostly into what are now Southern Ontario, the Eastern Townships of Quebec, New Brunswick, and Nova Scotia. 36,000 of these migrants went to the Maritimes, and some would later make their way to Ontario. Another wave of 30,000 Americans settled in Ontario and the Eastern Townships between the late 1780s and 1812 with promises of land. From forcibly having cleared land in Scotland, several thousands of Gaelic-speaking Scottish Highlanders migrated to Cape Breton, Nova Scotia and parts of Eastern Ontario during this period, marking a new age for Canada and its people.
Second wave (The Great Migration)
The second wave of immigrants, known as the Great Migration of Canada, mainly consisted of British and Irish people. The Great Migration encouraged immigrants to settle in Canada after the War of 1812, including British army regulars who had served in that war. In 1815, 80% of the 250,000 English-speaking people in Canada were either American colonists or their descendants. By 1851, the percentage of Americans had dropped to 30%. Worried about another American attempt at invasion—and to counter the French-speaking influence of Quebec—colonial governors of Canada rushed to promote settlement in backcountry areas along newly constructed plank roads within organized land tracts, mostly in Upper Canada (present-day Ontario). Much of the settlements were organized by large companies to promote clearing, and thus farming of land lots.
With this wave, Irish immigration to Canada had increased in small numbers to organize land settlements and, mostly, to work on canals, timber, railroads. Irish immigration would peak from 1846 to 1849 due to the Great Famine of Ireland, which resulted in hundreds of thousands more Irish migrants arriving on Canada's shores, with a portion migrating to the United States, either in the short-term or over the subsequent decades.
During the Great Migration, at least 800,000 people arrived between 1815 and 1850, 60% of whom were British (English and Scottish), while the remainder mostly Irish. This movement of people boosted Canada's population from approximately 500,000 in 1812 to 2.5 million by 1851. The Francophones would make up roughly 300,000 of the population in 1812, increasing to approx. 700,000 by the 1851 census, however, demographically Canada had swung to a majority Anglophone country. Canada's 1851 population by region would look as follows:
- Upper Canada (Ontario): 952,000;
- Lower Canada (Quebec): 890,000—about a quarter of whom spoke English as a first language;
- The Maritimes: 550,000.
Canada-US
The Dominion Lands Act of 1872 copied the American system by offering ownership of 160 acres of land free (with a small registration fee) to any man over the age of 18, or any woman heading a household. They did not need to be citizens, but had to live on the plot and improve it.
Also during this period, Canada became a port of entry for many Europeans seeking to gain entry into the United States. Canadian transportation companies advertised Canadian ports as a hassle-free way to enter the US, especially as the States began barring entry to certain ethnicities. Both the US and Canada mitigated this situation in 1894 with the Canadian Agreement which allowed for U.S. immigration officials to inspect ships landing at Canadian ports for immigrants excluded from the US. If found, the transporting companies were responsible for shipping the persons back.[11]
Clifford Sifton, Ottawa's Minister of the Interior (1896–1905), argued that the free western lands were ideal for growing wheat and would attract large numbers of hard-working farmers. He removed obstacles that included control of the lands by companies or organizations that did little to encourage settlement. Land companies, the Hudson's Bay Company, and school lands all accounted for large tracts of excellent property. The railways kept closed even larger tracts because they were reluctant to take legal title to the even-numbered lands they were due, thus blocking sale of odd-numbered tracts. With the goal of maximizing immigration from Britain, eastern Canada and the US, Sifton broke the legal log jam, and set up aggressive advertising campaigns in the U.S. and Europe, with a host of agents promoting the Canadian West. He would also broker deals with ethnic groups who wanted large tracts for homogeneous settlement.[12]
Third wave (1890–1920)
Canada's third wave of immigration came mostly from continental Europe, and peaked prior to World War I between 1911 to 1913, with over 400,000 migrants in 1912—many of whom were from Eastern or Southern Europe.

Fourth wave (1940s–1960s)
The fourth wave came from Europe following the Second World War, and peaked at 282,000 in 1957. With many of these migrants coming from Italy and Portugal, Pier 21 in Halifax, Nova Scotia proved to be an influential port for European immigration. From 1928 until ceasing operations in 1971, the Pier would receive 471,940 Italians, becoming the third largest ethnic group to immigrate to Canada during that time period.[13] From then on, Canada would start to become a more multi-ethnic country with substantial non-British or non-French European elements. Ukrainian Canadians, for instance, accounted for the largest Ukrainian population outside Ukraine and Russia.
Immigrants from Britain, however, were still given highest priority,[14] and 'Canadianization' would become of great importance for new arrivals who lacked a British cultural background.[15] There would be no such effort to attract Francophone immigrants. In regard to economic opportunity, Canada was most attractive to farmers headed to the Prairies, who typically came from Eastern and Central Europe, as immigrants from Britain preferred urban life.[16] As such, the Church of England took up the role of introducing British values to farmers newly arrived in the Prairie provinces, although, in practice, they clung to their traditional religious affiliations.[17]
Chinese immigration
Prior to 1885, restrictions on immigration were imposed mostly in response to large waves of migrants rather than planned policy decisions. Such restrictions, at least as official policy, would not explicitly target any specific group or ethnicity of people until 1885, with the passing of the first Chinese Head Tax legislation in response to a growing number of Chinese migrants working on the Canadian Pacific Railway.
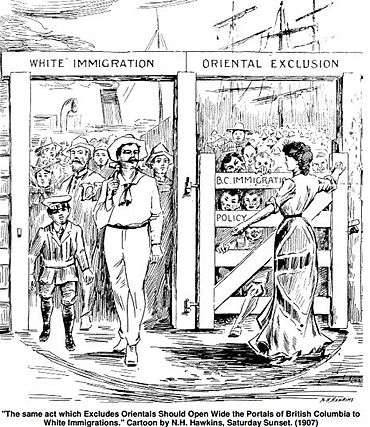
Subsequent increases in the head tax in 1900 and 1903 limited Chinese entrants to Canada, followed in 1907 by major riots against 'Oriental' people (i.e. Asians) taking place in Vancouver, BC. In 1923, the government passed the Chinese Immigration Act which excluded Chinese people from entering Canada altogether between 1923 and 1947. In recognizing Canada's historical discrimination against Chinese immigrants, an official government apology and compensations were announced on 22 June 2006.
Modern immigration (1970s–present)

Immigration in Canada since the 1970s, i.e. the 'fifth wave,' has overwhelmingly been of visible minorities from the developing world. This was largely influenced in 1976 when the Immigration Act was revised and was maintained as official government policy. On February 20, 1978, Canada and Quebec sign an immigration agreement allowing Quebec decision-making power in independently choosing its immigrants, who would then still have to be approved by Ottawa.[18]
During the Mulroney administration, immigration levels were increased. From the late 1980s, the 'fifth wave' of immigration has since maintained, with slight fluctuations (225,000–275,000 annually). Today, political parties remain cautious in criticizing high levels of immigration, because in the early 1990s, as noted by The Globe and Mail, Canada's Reform Party "was branded 'racist' for suggesting that immigration levels be lowered from 250,000 to 150,000."[19][20] However, the Coalition Avenir Quebec who were elected in the 2018 Quebec election advocated for a reduction to the number of immigrants, to 40,000.[21]
In 2008, Stephen Harper gave then-parliamentary secretary and Minister of Multiculturalism and Citizenship Jason Kenney, established a mandate to integrate immigrants, while improving relationship between the government to communities to gain votes.[22] In November 2017, Immigration Minister Ahmed Hussen announced that Canada would admit nearly 1 million permanent residents over the following three years, rising from 0.7% to 1% of its population by 2020.[23] This increase was motivated by the economic needs of the country caused by an aging population.[23]
Immigration rate
In 2001, 250,640 people immigrated to Canada, relative to a total population of 30,007,094 people per the 2001 Census. Since 2001, immigration has ranged between 221,352 and 262,236 immigrants per annum.[24] In 2017, the Liberal government announced Canada will welcome nearly one million immigrants over the next three years. The number of migrants would climb to 310,000 in 2018, up from 300,000 in 2017. That number was projected to rise to 330,000 in 2019, then 340,000 in 2020.[25][26][27]
The three main official reasons given for the level of immigration were:

100,000+ |
50,000–99,999 |
20,000–49,999 |
10,000–19,999 |
- The social component – Canada facilitates family reunification.
- The humanitarian component – Relating to refugees.
- The economic component – Attracting immigrants who will contribute economically and fill labour market needs.
Canada's level of immigration peaked in 1993 in the last year of the Progressive Conservative government and was maintained by the Liberal Party of Canada. Ambitious targets of an annual 1% per capita immigration rate were hampered by financial constraints. The Liberals committed to raising actual immigration levels further in 2005.
As Canadian political parties have been cautious about criticizing high levels of immigration, immigration levels to Canada (approx. 0.7% per year) are considerably higher per capita than to the United States (approx. 0.3% per year).
Furthermore, much of the immigration to the US is from Latin America and relatively less from Asia, though admitting about twice as many immigrants from Asian countries (e.g. China, India, the Philippines, and Pakistan) as Canada. As such, the Hispanic/Latin American population makes up the largest minority group in the United States, whereas such is true for the Asian population in Canada.
Immigrant population growth is concentrated in or around large cities (particularly Vancouver, Toronto, and Montreal). These cities have experienced increased service demands that accompany strong population growth, causing concern about the capability of infrastructure to handle influxes in such places. For example, as noted in a Toronto Star article from 14 July 2006, 43% of Canada's immigrants move to the Greater Toronto Area and that, "unless Canada cuts immigrant numbers, our major cities will not be able to maintain their social and physical infrastructures."[28] Most of the provinces that do not have one of those destination cities have implemented strategies to try to boost their share of immigration. While cities are a popular destination for new immigrants, some small towns have seen an influx of immigration due to economic reasons and local schools districts are working to adjust to the change.[29]
According to Immigration, Refugees and Citizenship Canada, under the Canada–Quebec Accord of 1991, Quebec has sole responsibility for selecting most immigrants destined to the province. Of course, once immigrants are granted permanent residency or citizenship they are free to move between and reside in any provinces under Section 6 of the Canadian Charter of Rights and Freedoms.
Irregular Migration
Estimates of illegal immigrants in Canada range between 35,000 and 120,000.[30] James Bissett, a former head of the Canadian Immigration Service, has suggested that the lack of any credible refugee screening process, combined with a high likelihood of ignoring any deportation orders, has resulted in tens of thousands of outstanding warrants for the arrest of rejected refugee claimants, with little attempt at enforcement.[31] A 2008 report by the Auditor General Sheila Fraser stated that Canada has lost track of as many as 41,000 illegal immigrants.[32][33]
In August 2017 the border between Quebec and New York State saw an influx of up to 500 illegal crossings each day by people seeking asylum in Canada.[34] As result, Canada increased border patrol and immigration staffing in the area, reiterating that crossing the border illegally (referred to as 'irregular migration') had no effect on one's asylum status.[35][36] It is reported that over 38,000 'irregular migrants' arrived in Canada since early 2017.
For the same reason, both Ontario and Quebec have requested the central government to provide CA$200 million or more to cover their cost of burden to house and provide services to asylum seekers. Related to asylum seekers, Canada joined 164 countries in signing the UN Global Compact for Migration in 2018. The 2017 government claims it is for following careful measures and to meet international obligations in accommodating irregular migrants.[37]
Settlement workers
Settlement workers help immigrants into Canada understand their rights and responsibilities and find them programs and services they need to integrate with the new culture and the prospects of a livelihood. They motivate organizations to hire immigrants and support immigration through recruiting new members/ employees. They work with government agencies, school boards, libraries and other community organizations with networks of resources.[38] These working relationships also help to provide families with the tools necessary to manage the changing identities of new immigrant families to Canada.[29]
Attitudes towards immigration
2016
In October 2016, the Angus Reid Institute partnered with the Canadian Broadcasting Corporation (CBC) to conduct a study of 'Canadian values.'[39] Survey results would indicate that about 68% of those polled said that they wanted minorities to do more to fit into the mainstream. However, the same number also said that they were nonetheless happy with how immigrants have integrated themselves into the community. Moreover, 79% of Canadians believe immigration policy should be based on the country's economic and labour needs, rather than on the needs of foreigners to escape crises in their home countries.
In an analysis of the survey, Angus Reid, himself, wrote that Canadians' commitment to multiculturalism is not increasing and that Canadian attitudes have been affected by the wake of North American and European nationalist movements, due to which certain provinces have even begun to develop colorist preferences. Reid also expressed his discomfort in the effect that an increase in illiterate refugees may have on Canadian society. Nonetheless, he found that the majority of newcomers and refugees feel that they are treated fairly and welcomed as a "Canadian."[40]
2017-2018
According to a 2017 poll, 32% of Canadians—up from 30% in 2016—believed that too many refugees were coming to Canada. The poll also asked respondents about their comfortability with surface-level diversity (e.g. around people of a different race), to which 89% said they were comfortable—a number that dropped from 94% in 2005–06.[41]
In 2018, an Angus Reid poll found that two-thirds (67%) of Canadians agreed that the situation of illegal immigration to Canada constitutes a "crisis" and that Canada's "ability to handle the situation is at a limit." Among respondents who voted in the 2015 election, 56% of those who voted Liberal and 55% of those who voted NDP agreed that the matter had reached a crisis level—agreed upon with 87% of respondents who voted Conservative in the 2015 election. Six out of ten respondents also told the pollster that Canada is "too generous" towards would-be refugees, a spike of five percentage points since the question was asked the previous year.[42][43]
2019
EKOS Research Associates, in a 2019 poll, found that about 40% of Canadians feel that there are too many non-white immigrants coming to the country.[44] EKOS expressed this number as demonstrating an increase from those who opposed immigration in previous years.[45]
In a 2019 poll by Léger Marketing, 63% of respondents wanted limits to be set on immigration, while 37% said immigration should be expanded. The results would show a split along party lines, as Green and Conservative Party supporters favoured a reduction, while Liberal and NDP supporters favoured the opposite. Minister of Immigration, Refugees and Citizenship Ahmed Hussen felt that the poll results may be indicative of the concerns of some Canadians about housing shortages and the ability of communities to absorb more people.[46]
History of citizenship and emigration
Citizenship
The word 'Canadian' as a term of nationalism or citizenship was first used under the Immigration Act, 1910, to designate those British subjects who were domiciled in Canada, whereas all other British subjects required permission to land. A separate status of "Canadian national" was created under the Canadian Nationals Act, 1921, which would broaden the definition of 'Canadian' to include such citizen's wife and children (fathered by the citizen) who had not yet landed in Canada. After the passage of the Statute of Westminster in 1931, the monarchy ceased to be an exclusively British institution. Thus, Canadians—as well as all others living among what is known today as the Commonwealth realms—were regarded as subjects of the Crown. However, in legal documents, the term 'British subject' continued to be used, hence 'Canadians' were still, officially, British subjects born or regularly domiciled in Canada.
In 1946, Canada would be the first nation in the then-British Commonwealth to establish its own nationality law, with the enactment of the Canadian Citizenship Act, 1946, taking effect on 1 January 1947. In order to be deemed a Canadian citizen, one generally had to be a British subject on the date that the Act took effect, or had been admitted to Canada as landed immigrants before that date. First Nations people were later included by amendment in 1956. The phrase 'British subject' referred generally to anyone from the United Kingdom, its colonies at the time, or a Commonwealth country. Acquisition and loss of British-subject status before 1947 was determined by British law.
Many of the provisions to acquire or lose Canadian citizenship that existed under the 1946 legislation were repealed, whereby Canadian citizens generally would no longer be subject to involuntary loss of citizenship, barring revocation on the grounds of immigration fraud. On 15 February 1977, Canada removed restrictions on dual citizenship.
Present
Canada offers Canadian citizenship through naturalization. In 2006, the Canadian government reduced the landing fee per immigrant by 50%.[47] In June 2017, the implementation of the first of a series of important reforms to the Citizenship Act took effect. These reforms restored many of the previous requirements that were in place for over 3 decades in Canada before they were removed and replaced with more stringent criteria by the former Conservative government in 2015. The most important of these changes include:[48][49]
- The requirement of permanent residence for 3 out of 5 years during the period immediately prior to filing the application.
- Removal of a physical presence rule.
- Persons aged 14 to 54 years must pass a Canadian knowledge test and demonstrate a basic ability in either of English or French, Canada's official languages.
- Revocation of citizenship must follow a more formal and balanced process.
Emigration
While emigration from Canada to the United States has historically exceeded immigration, there have been short periods in which the reverse was true, such as:
- during the American Revolution, with the migration of Loyalist refugees;
- during the various gold rushes of British Columbia, and the later Klondike Gold Rush, which saw many American prospectors inhabiting B.C. and the Yukon;
- in the early 20th century, when land settlers moved from the Northern Plains to the Prairies
Canada would also see mass emigration during periods of political turmoil or war, such as the Vietnam War. There are over 1 million Americans living in Canada, and over 1 million Canadians living in the US, with many millions more who are descendants of Canadian immigrants to the US—New England alone is 20–25% of Canadian descent.
Immigration has always been offset by emigration: at times this was of great concerns of governments intent on filling up the country, particularly the western provinces. The United States was overall the primary destination followed by reverse migration. As a result, the population of Canada at Confederation (1867) was 3.75 million, or 10% of the US population, an average that maintained from about 1830 to 1870. This number would drop to 6% by 1900 due to large emigration to the US, despite large-scale immigration to Canada. Emigration to the US was only 370,000 in the 1870s; averaged a million a decade from 1880 to 1910; almost 750,000 from 1911 to 1920 and 1.25 million from 1921 to 1930. They consisted of both native-born Canadians and recent immigrants from various, mostly European nations. Between 1945 and 1965, emigration to the US averaged 40–45,000 annually. It was not until 1960 that the population of Canada reached the 10% mark again, or 18 million.
As of 2017, with over 35 million people, Canada has 10.8% the population of its southern neighbour. In times of economic difficulty, Canadian governments frequently resorted to deportation and coerced "voluntary" deportation to thin out ranks of unemployed workers. However, by the time of the administration of Mackenzie King, it was realized that this was an improvident short-term solution that would result in future labor shortages (that immigration was initially intended to overcome).[50]
Immigration categories
In Canadian law, (legal) immigrants are categorized by Immigration, Refugees and Citizenship Canada (IRCC) as either of the following:[1]
- Family: persons closely related to one or more Canadian residents who live in Canada.
- Economic: skilled workers, caregivers, or business persons.
- Protected person or Refugee: persons who are escaping persecution, torture, and/or cruel and unusual punishment.
- Humanitarian or other: persons accepted as immigrants for humanitarian or compassionate reasons.
In 2010, Canada accepted 280,681 immigrants (permanent and temporary) of which 186,913 (67%) were Economic immigrants; 60,220 (22%) were Family class; 24,696 (9%) were Refugees; and 8,845 (2%) were others through working holidays, internships, and studies.[51][52]
Economic immigrants
IRCC uses seven sub-categories of economic immigrants, including skilled workers, under the following classes:[1]
- Quebec skilled worker;[53]
- Federal skilled trades;
- Federal skilled worker;
- Provincial nominee class; and
- the Canadian experience class: the process is done by submitting an online profile to the Express Entry pool, under one of 3 federal Canada immigration programs or a provincial immigration program. The highest ranked candidates are then invited to apply for permanent residence.[54]
The business immigration programs that offer permanent admission to Canada include:
- Quebec Immigrant Investor Program (QIIP)[24]
- Quebec Entrepreneur Program;
- Quebec Self Employed;
- Federal Start-UP Visa program.
Individuals with a certain net worth can also apply for permanent residence via certain programs.[55] For business owners and investor immigrants who do not fit into the Start-Up business class or Quebec Provincial programs, there is a Federal Owner Operator LMIA pathway that if executed correctly can lead to permanent admission to Canada.[56]
The high-profile Skilled worker principal applicants group comprised 19.8% of all immigration in 2005. Canada has also created a VIP Business Immigration Program which allows immigrants with sufficient business experience or management experience to receive the Permanent Residency in a shorter period than other types of immigration.
As of May 1, 2014, the Federal Skilled Worker Class opened once again accepting 25,000 applicants with intake caps at 1,000 per category. A New Economic Action Plan 2015 took effect in January 2015 in which the skilled worker program will be more of an employer based program. The current list of accepted occupations for 2014 includes many occupations such as senior managers, accountants, physicians and medical professionals, professionals in marketing and advertising, real estate professionals and many more.[57] The changes in 2015 moved permanent residency in Canada away from the "first come, first served" model, and towards a new structure that took on permanent residents based on Canada's economic need. The new system is called "Express Entry".[58] Alberta's Immigrant Nominee Program (AINP),[59] in particular, allows skilled workers, along with their families, to make application for permanent residency, and several large Alberta employers with operations in rural areas actively recruit employees from abroad and support them and their families in seeking permanent residency.[29]
Effective August 2, 2016, all home buyers who are not Canadian citizens nor have landed immigrant status are obliged to pay a 15% Property Transfer Tax when purchasing residential property in the Greater Vancouver Regional District.[60]
Family class
Under a government program, both citizens and permanent residents can sponsor family members to immigrate to Canada.
Refugees
Under Canadian nationality law an immigrant can apply for citizenship after living in Canada for 1095 days (3 years) in any 5-year period provided that they lived in Canada as a permanent resident for at least two of those years.[61] The opposition parties have been advocating providing one-year free residency visa for refugees as a chance to increase their living standards until they're ready to migrate back to their home countries, rather than uprooting them from their heritage and culture in forms of relief.[62][63]
Claiming asylum in Canada

A person who is seeking asylum in Canada must be first considered eligible by the Immigration and Refugee Board of Canada(IRB).[64] The IRB classifies eligible refugees into two separate categories:[64]
- Convention Refugees: Someone who is outside and unable to return to their home country due to a fear of persecution based on several factors including race, religion, and political opinion.
- A person in need of protection: Claims for asylum under this category are usually made at a point of entry into Canada. Those claiming to be a person in need of protection must be unable to return to their home country safely because they would be subjected to a danger of torture, risk for their life or risk of cruel and unusual treatment.
After entry and eligibility interview the asylum seeker is either allowed or declined admission. Those who are admitted submits in writing their reasons of admissibility. The refugee board hears their case after 60 days and in favorable terms the claimants are accepted as refugees.[65] If the claims are not deemed appropriate by the interviewer, the asylum seeker may be deported.
There are many instances in which claims have been deemed ineligible for referral to the IRB, notably those by migrants who seek entry into Canada through the U.S., where the Safe Third Country Agreement (STCA) is applied.[64] The STCA is responsible for limiting refugee eligibility to enter Canada and the rejection of several hundred claims a year since its implementation.[66] The Canadian Border Services Agency (CBSA) reported a drop in the number of claims from 6,000–14,000 before the STCA's implementation to an average of 4,000 claims per year after its implementation.[67]
Asylum claimants have been subjected to "indirect refoulment," a consequence of a persons claim in Canada being refused under the STCA, subjecting them to deportation to the destination in which the person was originally seeking asylum from, due to more conservative immigration and refugee policies in the U.S.[68]
Refugees in detention
As part of the passing of Bill C-31 in December 2012, asylum seekers arriving at a point of entry on the Canadian border have been subject to incarceration and detention.[69] Claimants are subject to detention for failing to provide sufficient identification documents, which is in violation with the United Nations Refugee Convention, to which Canada is a signatory.[69] In 2010–2011, Canada detained 8,838 people, of which 4,151 of them were asylum seekers or rejected refugee claimants.[70] There is a requirement to the maximum time limit spent in detention upon being released, a situation which has been subject to criticism held in contrast to areas in Europe: Ireland (30 days), France (32 days), Spain (40 days), and Italy (60 days).[70]
Private Sponsorship of Refugees Program
The Private Sponsorship of Refugees Program is a Canadian initiative established in 1978 under Operation Lifeline,[71] whereby refugees can resettle in Canada with support and funding from private or joint government-private sponsorship.[72] The program was established in 1978, and it has since resettled and provided support for over 200,000 refugees[73] under various initiatives and with fluctuating annual intakes.[74]
Sources of immigration
Canada receives its immigrant population from almost 200 countries. Statistics Canada projects that, by 2031, almost one-half of the population could have at least one foreign-born parent.[75] The number of visible ethno-cultural composition of population will double and make up the minority of the population of cities in Canada.[76]
2019
| Rank | Country | Number | Percentage |
|---|---|---|---|
| 1 | 85,585 | 25.1 | |
| 2 | 30,260 | 8.9 | |
| 3 | 27,815 | 8.2 | |
| 4 | 12,595 | 3.7 | |
| 5 | 10,800 | 3.2 | |
| 6 | 10,790 | 3.2 | |
| 7 | 10,120 | 3.0 | |
| 8 | 7,025 | 2.1 | |
| 9 | 6,110 | 1.8 | |
| 10 | 6,055 | 1.8 | |
| Top 10 Total | 207,155 | 60.7 | |
| Other | 134,025 | 39.3 | |
| Total | 341,180 | 100 |
2017
| Rank | Country | Number | Percentage |
|---|---|---|---|
| 1 | 51,651 | 18 | |
| 2 | 40,857 | 14.3 | |
| 3 | 30,279 | 10.6 | |
| 4 | 12,044 | 4.2 | |
| 5 | 9,100 | 3.2 | |
| 6 | 7,656 | 2.7 | |
| 7 | 6,600 | 2.3 | |
| 8 | 5,459 | 1.9 | |
| 9 | 5,293 | 1.8 | |
| 10 | 4,740 | 1.7 | |
| Top 10 Total | 173,679 | 60.6 | |
| Other | 112,800 | 39.4 | |
| Total | 286,479 | 100 |
2016
| Rank | Country | Number | Percentage |
|---|---|---|---|
| 1 | 41,791 | 14.1 | |
| 2 | 39,789 | 13.4 | |
| 3 | 34,925 | 11.7 | |
| 4 | 26,852 | 9.1 | |
| 5 | 11,337 | 3.8 | |
| 6 | 8,409 | 2.8 | |
| 7 | 6,483 | 2.2 | |
| 8 | 6,348 | 2.1 | |
| 9 | 5,812 | 2.0 | |
| 10 | 4,629 | 1.6 | |
| Top 10 Total | 186,375 | 62.9 | |
| Other | 109,971 | 37.1 | |
| Total | 296,346 | 100 |
Total immigrant population by country of birth
Immigrant refers to all those who hold or have ever held permanent resident status in Canada, including naturalized citizens.[80]
| Rank | Country of birth | Population | Portion of immigrants in Canada | Portion of Canadian population | Notes |
|---|---|---|---|---|---|
| N/A | 27,610,898 | N/A | 78.55% | ||
| 1 | 668,565 | 8.87% | 1.9% | ||
| 2 | 649,260 | 8.61% | 1.85% | Officially the People's Republic of China.
Excludes Hong Kong and Macau (included in this table below). | |
| 3 | 588,305 | 7.8% | 1.67% | ||
| 4 | 499,120 | 6.62% | 1.42% | Officially the United Kingdom of Great Britain and Northern Ireland.
Includes Scotland, Wales, England and Northern Ireland. Excludes Isle of Man, the Channel Islands, and British Overseas Territories. | |
| 5 | 253,715 | 3.36% | 0.72% | Officially the United States of America. | |
| 6 | 236,635 | 3.14% | 0.67% | ||
| 7 | 208,935 | 2.77% | 0.59% | Officially the Hong Kong Special Administrative Region of China. | |
| 8 | 202,255 | 2.68% | 0.58% | ||
| 9 | 169,250 | 2.24% | 0.48% | Many from the former Republic of Vietnam | |
| 10 | 154,420 | 2.05% | 0.44% | Officially the Islamic Republic of Iran. | |
| 11 | 146,470 | 1.94% | 0.42% | ||
| 12 | 145,840 | 1.93% | 0.41% | ||
| 13 | 139,450 | 1.85% | 0.4% | ||
| 14 | 138,345 | 1.83% | 0.39% | ||
| 15 | 131,995 | 1.75% | 0.38% | ||
| 16 | 123,305 | 1.64% | 0.35% | Officially the Republic of Korea. | |
| 17 | 105,570 | 1.4% | 0.3% | ||
| 18 | 93,485 | 1.24% | 0.27% | ||
| 19 | 90,310 | 1.2% | 0.26% | ||
| 20 | 88,740 | 1.18% | 0.25% | ||
| 21 | 88,475 | 1.17% | 0.25% | ||
| 22 | 87,680 | 1.16% | 0.25% | ||
| 23 | 80,590 | 1.07% | 0.23% | ||
| 24 | 78,685 | 1.04% | 0.22% | ||
| 25 | 73,030 | 0.97% | 0.21% | ||
| 26 | 70,040 | 0.93% | 0.2% | ||
| 27 | 69,655 | 0.92% | 0.2% | ||
| 28 | 68,490 | 0.91% | 0.19% | ||
| 29 | 65,035 | 0.86% | 0.19% | ||
| 30 | 64,625 | 0.86% | 0.18% | ||
| 31 | 64,620 | 0.86% | 0.18% | ||
| 32 | 63,770 | 0.85% | 0.18% | ||
| 33 | 62,715 | 0.83% | 0.18% | ||
| 34 | 58,735 | 0.78% | 0.17% | ||
| 35 | 52,955 | 0.7% | 0.15% | Officially the Syrian Arab Republic. | |
| 36 | 51,960 | 0.69% | 0.15% | ||
| 37 | 48,075 | 0.64% | 0.14% | ||
| 38 | 44,660 | 0.59% | 0.13% | ||
| 39 | 42,430 | 0.56% | 0.12% | ||
| 40 | 40,040 | 0.53% | 0.11% | ||
| 41 | 36,825 | 0.49% | 0.1% | ||
| 42 | 36,135 | 0.48% | 0.1% | ||
| 43 | 33,320 | 0.44% | 0.09% | Excludes Kosovo. | |
| 44 | 32,790 | 0.43% | 0.09% | ||
| 45 | 29,615 | 0.39% | 0.08% | ||
| 46 | 29,315 | 0.39% | 0.08% | ||
| 47 | 28,320 | 0.38% | 0.08% | Also known as the Republic of Ireland | |
| 48 | 27,245 | 0.36% | 0.08% | ||
| 49 | 27,230 | 0.36% | 0.08% | ||
| 50 | 27,150 | 0.36% | 0.08% | ||
| 51 | 26,735 | 0.35% | 0.08% | ||
| 52 | 26,710 | 0.35% | 0.08% | ||
| 53 | 26,705 | 0.35% | 0.08% | ||
| 54 | 25,655 | 0.34% | 0.07% | ||
| 55 | 24,660 | 0.33% | 0.07% | ||
| 56 | 23,785 | 0.32% | 0.07% | ||
| 57 | 23,320 | 0.31% | 0.07% | ||
| 58 | 22,910 | 0.3% | 0.07% | ||
| 59 | 21,115 | 0.28% | 0.06% | Includes Norfolk Island. | |
| 60 | 21,065 | 0.28% | 0.06% | ||
| 61 | 20,990 | 0.28% | 0.06% | ||
| 62 | 20,775 | 0.28% | 0.06% | Officially the Bolivarian Republic of Venezuela. | |
| 63 | 20,600 | 0.27% | 0.06% | Officially the United Republic of Tanzania. | |
| 64 | 20,080 | 0.27% | 0.06% | ||
| 65 | 19,430 | 0.26% | 0.06% | ||
| 66 | 19,040 | 0.25% | 0.05% | ||
| 67 | 18,935 | 0.25% | 0.05% | ||
| 68 | 18,635 | 0.25% | 0.05% | ||
| 69 | 18,570 | 0.25% | 0.05% | ||
| 70 | 17,850 | 0.24% | 0.05% | ||
| 71 | 17,605 | 0.23% | 0.05% | Officially the Republic of Moldova. | |
| 72 | 17,435 | 0.23% | 0.05% | ||
| 73 | 17,275 | 0.23% | 0.05% | ||
| 74 | 15,900 | 0.21% | 0.05% | ||
| 75 | 15,845 | 0.21% | 0.05% | ||
| 76 | 15,365 | 0.2% | 0.04% | ||
| 77 | 15,235 | 0.2% | 0.04% | ||
| 78 | 15,075 | 0.2% | 0.04% | ||
| 79 | 15,010 | 0.2% | 0.04% | ||
| 80 | 14,965 | 0.2% | 0.04% | ||
| 81 | 14,475 | 0.19% | 0.04% | Officially the Lao People's Democratic Republic. | |
| 82 | 14,410 | 0.19% | 0.04% | ||
| 83 | 14,390 | 0.19% | 0.04% | ||
| 84 | 14,280 | 0.19% | 0.04% | ||
| 85 | 14,095 | 0.19% | 0.04% | ||
| 86 | 13,295 | 0.18% | 0.04% | ||
| 87 | 13,210 | 0.18% | 0.04% | ||
| 88 | 12,945 | 0.17% | 0.04% | ||
| 89 | 12,515 | 0.17% | 0.04% | ||
| 90 | 12,450 | 0.17% | 0.04% | ||
| 91 | 11,820 | 0.16% | 0.03% | ||
| 92 | 11,325 | 0.15% | 0.03% | Also known as Côte d'Ivoire. | |
| 93 | 11,190 | 0.15% | 0.03% | ||
| 94 | 10,820 | 0.14% | 0.03% | Officially the Republic of the Sudan. | |
| 95 | 10,700 | 0.14% | 0.03% | ||
| 96 | 10,605 | 0.14% | 0.03% | ||
| 97 | 10,495 | 0.14% | 0.03% | ||
| 98 | 10,300 | 0.14% | 0.03% | Officially the Republic of Macedonia.
Also known as the former Yugoslav Republic of Macedonia by the United Nations and other international bodies. | |
| 99 | 10,265 | 0.14% | 0.03% | ||
| 100 | 9,880 | 0.13% | 0.03% | Includes Niue and Tokelau. | |
| 101 | 9,865 | 0.13% | 0.03% | ||
| 102 | 9,525 | 0.13% | 0.03% | ||
| 103 | 8,470 | 0.11% | 0.02% | ||
| 104 | 8,215 | 0.11% | 0.02% | Also known as Burma. | |
| 105 | 8,210 | 0.11% | 0.02% | ||
| 106 | 8,210 | 0.11% | 0.02% | Recorded as "West Bank and Gaza Strip (Palestine)," since "Palestine" refers to pre-1948 British mandate Palestine.
West Bank and Gaza Strip are the territories referred to in the Oslo I Accord, signed by Israel and the PLO in 1993. | |
| 107 | 7,790 | 0.1% | 0.02% | ||
| 108 | 7,610 | 0.1% | 0.02% | Officially the Republic of Kosovo. | |
| 109 | 7,515 | 0.1% | 0.02% | ||
| 110 | 7,465 | 0.1% | 0.02% | ||
| 111 | 7,305 | 0.1% | 0.02% | ||
| 112 | 6,630 | 0.09% | 0.02% | ||
| 113 | 6,535 | 0.09% | 0.02% | ||
| 114 | 6,385 | 0.08% | 0.02% | ||
| 115 | 6,300 | 0.08% | 0.02% | ||
| 116 | 6,105 | 0.08% | 0.02% | ||
| 117 | 6,100 | 0.08% | 0.02% | ||
| 118 | 5,875 | 0.08% | 0.02% | ||
| 119 | 5,750 | 0.08% | 0.02% | Officially the Macao Special Administrative Region of China. | |
| 120 | 5,540 | 0.07% | 0.02% | ||
| 121 | 5,190 | 0.07% | 0.01% | ||
| 122 | 4,980 | 0.07% | 0.01% | ||
| 123 | 4,485 | 0.06% | 0.01% | ||
| 124 | 4,400 | 0.06% | 0.01% | Officially the Plurinational State of Bolivia. | |
| 125 | 4,250 | 0.06% | 0.01% | ||
| 126 | 4,165 | 0.06% | 0.01% | ||
| 127 | 4,020 | 0.05% | 0.01% | ||
| 128 | 3,950 | 0.05% | 0.01% | ||
| 129 | 3,885 | 0.05% | 0.01% | ||
| 130 | 3,845 | 0.05% | 0.01% | ||
| 131 | 3,715 | 0.05% | 0.01% | ||
| 132 | 3,555 | 0.05% | 0.01% | ||
| 133 | 3,350 | 0.04% | 0.01% | ||
| 134 | 3,200 | 0.04% | 0.01% | ||
| 135 | 3,120 | 0.04% | 0.01% | ||
| 136 | 3,040 | 0.04% | 0.01% | ||
| 137 | 2,980 | 0.04% | 0.01% | ||
| 138 | 2,960 | 0.04% | 0.01% | ||
| 139 | 2,775 | 0.04% | 0.01% | ||
| 140 | 2,760 | 0.04% | 0.01% | ||
| 141 | 2,620 | 0.03% | 0.01% | ||
| 142 | 2,570 | 0.03% | 0.01% | ||
| 143 | 2,485 | 0.03% | 0.01% | ||
| 144 | 2,480 | 0.03% | 0.01% | ||
| 145 | 2,460 | 0.03% | 0.01% | ||
| 146 | 2,390 | 0.03% | 0.01% | ||
| 147 | 2,310 | 0.03% | 0.01% | ||
| 148 | 2,235 | 0.03% | 0.01% | ||
| 149 | 2,105 | 0.03% | 0.01% | ||
| 150 | 2,095 | 0.03% | 0.01% | ||
| 151 | 1,995 | 0.03% | 0.01% | ||
| 152 | 1,980 | 0.03% | 0.01% | ||
| 153 | 1,865 | 0.02% | 0.01% | ||
| 154 | 1,845 | 0.02% | 0.01% | ||
| 155 | 1,635 | 0.02% | 0% | ||
| 156 | 1,595 | 0.02% | 0% | ||
| 157 | 1,540 | 0.02% | 0% | ||
| 158 | 1,420 | 0.02% | 0% | ||
| 159 | 1,310 | 0.02% | 0% | ||
| 160 | 1,255 | 0.02% | 0% | ||
| 161 | 1,080 | 0.01% | 0% | ||
| 162 | 1,055 | 0.01% | 0% | ||
| 163 | 1,050 | 0.01% | 0% | ||
| 164 | 1,035 | 0.01% | 0% | ||
| 164 | Others | 1,035 | 0.01% | 0% | Includes a small number of immigrants who were born in Canada, as well as other places of birth not included elsewhere (e.g. 'born at sea'). |
| 164 | 1,035 | 0.01% | 0% | ||
| 167 | 1,030 | 0.01% | 0% | ||
| 168 | 905 | 0.01% | 0% | ||
| 169 | 850 | 0.01% | 0% | ||
| 170 | 780 | 0.01% | 0% | Officially the Democratic People's Republic of Korea. | |
| 171 | 675 | 0.01% | 0% | ||
| 172 | 670 | 0.01% | 0% | ||
| 173 | 665 | 0.01% | 0% | ||
| 174 | 640 | 0.01% | 0% | ||
| 175 | 610 | 0.01% | 0% | ||
| 176 | 590 | 0.01% | 0% | ||
| 177 | 580 | 0.01% | 0% | ||
| 178 | 515 | 0.01% | 0% | ||
| 179 | 505 | 0.01% | 0% | ||
| 180 | 500 | 0.01% | 0% | ||
| 181 | 470 | 0.01% | 0% | ||
| 182 | 415 | 0.01% | 0% | ||
| 183 | 400 | 0.01% | 0% | ||
| 184 | 360 | 0% | 0% | ||
| 185 | 295 | 0% | 0% | ||
| 186 | 290 | 0% | 0% | ||
| 187 | 280 | 0% | 0% | ||
| 188 | 270 | 0% | 0% | ||
| 189 | 235 | 0% | 0% | ||
| 190 | 220 | 0% | 0% | ||
| 191 | 195 | 0% | 0% | ||
| 192 | 185 | 0% | 0% | ||
| 192 | 185 | 0% | 0% | Part of the Kingdom of the Netherlands. | |
| 194 | 170 | 0% | 0% | ||
| 195 | 160 | 0% | 0% | ||
| 196 | 155 | 0% | 0% | ||
| 197 | 140 | 0% | 0% | ||
| 197 | 140 | 0% | 0% | ||
| 199 | 120 | 0% | 0% | ||
| 200 | 110 | 0% | 0% | ||
| 200 | 110 | 0% | 0% | ||
| 202 | 105 | 0% | 0% | ||
| 203 | 90 | 0% | 0% | ||
| 204 | 85 | 0% | 0% | ||
| 205 | 65 | 0% | 0% | ||
| 206 | 60 | 0% | 0% | ||
| 206 | 60 | 0% | 0% | ||
| 206 | 60 | 0% | 0% | ||
| 209 | 55 | 0% | 0% | ||
| 210 | 50 | 0% | 0% | ||
| 211 | 40 | 0% | 0% | ||
| 212 | 35 | 0% | 0% | ||
| 213 | 30 | 0% | 0% | ||
| 213 | 30 | 0% | 0% | ||
| 213 | 30 | 0% | 0% | ||
| 216 | 25 | 0% | 0% | ||
| 216 | 25 | 0% | 0% | ||
| 216 | 25 | 0% | 0% | ||
| 216 | 25 | 0% | 0% | Also known as Timor-Leste. | |
| 220 | 20 | 0% | 0% | ||
| 220 | 20 | 0% | 0% | ||
| 220 | 20 | 0% | 0% | ||
| 223 | 10 | 0% | 0% | ||
| 223 | 10 | 0% | 0% | ||
| 223 | 10 | 0% | 0% | ||
| 223 | 10 | 0% | 0% | Officially Saint Helena, Ascension and Tristan da Cunha. | |
| 223 | 10 | 0% | 0% | ||
| 223 | 10 | 0% | 0% | ||
| Total immigrants | 7,540,830 | 100% | 21.45% |
2015
| Rank | Country | Number | Percentage |
|---|---|---|---|
| 1 | 50,846 | 18.7 | |
| 2 | 39,530 | 14.5 | |
| 3 | 19,532 | 7.2 | |
| 4 | 11,669 | 4.3 | |
| 5 | 11,329 | 4.2 | |
| 6 | 9,853 | 3.6 | |
| 7 | 7,522 | 3.0 | |
| 8 | 5,807 | 2.0 | |
| 9 | 5,451 | 2.0 | |
| 10 | 4,133 | 2.0 | |
| Top 10 Total | 165,672 | 61.5 | |
| Other | 106,173 | 38.5 | |
| Total | 271,845 | 100 |
2011
| Rank | Country | Number of immigrants admitted | Proportion of total | Notes |
|---|---|---|---|---|
| 1 | 34,991 | 14.1% | ||
| 2 | 28,696 | 11.5% | Excludes Hong Kong, Macau, and Taiwan (listed separately). | |
| 3 | 24,965 | 10% | ||
| 4 | 8,829 | 3.5% | ||
| 5 | 6,840 | 2.7% | ||
| 6 | 6,550 | 2.6% | ||
| 7 | 6,208 | 2.5% | ||
| 8 | 6,073 | 2.4% | ||
| 9 | 5,867 | 2.4% | ||
| 10 | 5,223 | 2.1% | ||
| 11 | 4,698 | 1.9% | ||
| 12 | 4,573 | 1.8% | ||
| 13 | 4,317 | 1.7% | ||
| 14 | 4,155 | 1.7% | ||
| 15 | 3,800 | 1.5% | ||
| 16 | 3,642 | 1.5% | ||
| 17 | 3,403 | 1.4% | ||
| 18 | 3,104 | 1.2% | ||
| 19 | 2,768 | 1.1% | ||
| 20 | 2,455 | 1% | ||
| 21 | 2,449 | 1% | ||
| 22 | 2,335 | 0.9% | ||
| 23 | 2,299 | 0.9% | ||
| 24 | 2,254 | 0.9% | ||
| 25 | 2,038 | 0.8% | ||
| 26 | 2,021 | 0.8% | ||
| 27 | 1,977 | 0.8% | ||
| 28 | 1,967 | 0.8% | Excludes the Gaza Strip, Golan Heights, and West Bank. | |
| 29 | 1,894 | 0.8% | ||
| 30 | 1,887 | 0.8% | ||
| 31 | 1,723 | 0.7% | ||
| 32 | 1,682 | 0.7% | ||
| 33 | 1,519 | 0.6% | ||
| 34 | 1,475 | 0.6% | ||
| 35 | 1,446 | 0.6% | ||
| 36 | 1,368 | 0.5% | ||
| 37 | 1,349 | 0.5% | ||
| 38 | 1,339 | 0.5% | ||
| 39 | 1,256 | 0.5% | ||
| 40 | 1,249 | 0.5% | ||
| 41 | 1,181 | 0.5% | ||
| 42 | 1,179 | 0.5% | ||
| 43 | 1,166 | 0.5% | ||
| 44 | 1,120 | 0.5% | ||
| 45 | 1,058 | 0.4% | ||
| 46 | 1,036 | 0.4% | ||
| 47 | 1,025 | 0.4% | ||
| 48 | 979 | 0.4% | ||
| 49 | 938 | 0.4% | ||
| 50 | 876 | 0.4% | ||
| 51 | 874 | 0.4% | ||
| 52 | 820 | 0.3% | Officially Hong Kong Special Administrative Region of the People's Republic of China. | |
| 53 | 761 | 0.3% | ||
| 54 | 759 | 0.3% | ||
| 55 | 750 | 0.3% | ||
| 56 | 662 | 0.3% | ||
| 57 | 658 | 0.3% | ||
| 58 | 657 | 0.3% | ||
| 59 | 633 | 0.3% | ||
| 60 | 629 | 0.3% | ||
| 61 | 615 | 0.2% | ||
| 61 | 615 | 0.2% | ||
| 62 | 572 | 0.2% | ||
| 63 | 544 | 0.2% | ||
| 64 | 542 | 0.2% | ||
| 65 | 523 | 0.2% | ||
| 66 | 518 | 0.2% | ||
| 67 | 511 | 0.2% | ||
| 68 | 506 | 0.2% | ||
| 69 | 503 | 0.2% | ||
| 70 | 488 | 0.2% | Now divided into the Republic of the Sudan and of South Sudan. | |
| 71 | 485 | 0.2% | ||
| 72 | 471 | 0.2% | ||
| 73 | 458 | 0.2% | ||
| 74 | 455 | 0.2% | ||
| 75 | 448 | 0.2% | ||
| 76 | 447 | 0.2% | ||
| 77 | 437 | 0.2% | ||
| 78 | 436 | 0.2% | ||
| 79 | 410 | 0.2% | ||
| 80 | 388 | 0.2% | ||
| 81 | 368 | 0.1% | ||
| 82 | 367 | 0.1% | ||
| 83 | 356 | 0.1% | ||
| 84 | 355 | 0.1% | ||
| 85 | 311 | 0.1% | ||
| 85 | 311 | 0.1% | ||
| 86 | 298 | 0.1% | ||
| 87 | 288 | 0.1% | ||
| 88 | 285 | 0.1% | ||
| 89 | 281 | 0.1% | ||
| 90 | 276 | 0.2% | ||
| 91 | 262 | 0.1% | ||
| 92 | 261 | 0.1% | Includes the Gaza Strip and West Bank. | |
| 93 | 252 | 0.1% | ||
| 94 | 248 | 0.1% | ||
| 95 | 244 | 0.1% | ||
| 96 | 233 | 0.1% | ||
| 97 | 229 | 0.1% | ||
| 98 | 227 | 0.1% | ||
| 99 | 209 | 0.1% | ||
| 100 | 196 | 0.1% | ||
| 101 | 188 | 0.1% | ||
| 102 | 183 | 0.1% | ||
| 103 | 178 | 0.1% | ||
| 104 | 173 | 0.1% | ||
| 105 | 169 | 0.1% | ||
| 106 | 163 | 0.1% | ||
| 107 | 154 | 0.1% | ||
| 108 | 152 | 0.1% | ||
| 109 | 146 | 0.1% | ||
| 110 | 141 | 0.1% | ||
| 111 | 138 | 0.1% | ||
| 112 | 129 | 0.1% | ||
| 113 | 128 | 0.1% | ||
| 113 | 128 | 0.1% | ||
| 114 | 127 | 0.1% | ||
| 115 | 125 | 0.1% | ||
| 115 | 125 | 0.1% | ||
| 116 | 124 | 0% | ||
| 117 | 123 | 0% | ||
| 118 | 120 | 0% | ||
| 118 | 120 | 0% | ||
| 119 | 117 | 0% | ||
| 120 | 110 | 0% | ||
| 121 | 104 | 0% | ||
| 121 | 104 | 0% | ||
| 122 | 97 | 0% | ||
| 123 | 96 | 0% | ||
| 124 | 95 | 0% | ||
| 125 | 93 | 0% | ||
| 126 | 91 | 0% | ||
| 127 | 90 | 0% | ||
| 128 | 82 | 0% | ||
| 129 | 79 | 0% | ||
| 130 | 77 | 0% | ||
| 131 | 75 | 0% | ||
| 132 | 71 | 0% | ||
| 133 | 65 | 0% | ||
| 134 | 59 | 0% | ||
| 134 | 59 | 0% | ||
| 135 | 56 | 0% | ||
| 136 | 54 | 0% | ||
| 137 | 53 | 0% | ||
| 138 | 49 | 0% | ||
| 139 | 45 | 0% | ||
| 140 | 43 | 0% | ||
| 141 | 42 | 0% | ||
| 141 | 42 | 0% | ||
| 142 | 41 | 0% | ||
| 143 | 40 | 0% | ||
| 144 | 38 | 0% | ||
| 145 | 34 | 0% | ||
| 146 | 31 | 0% | ||
| 147 | 29 | 0% | Officially the Macao Special Administrative Region of the People's Republic of China. | |
| 148 | 28 | 0% | ||
| 149 | 27 | 0% | ||
| 150 | 25 | 0% | Now divided into the Republic of Serbia and Montenegro. | |
| 151 | 24 | 0% | ||
| 151 | 24 | 0% | ||
| 152 | 23 | 0% | ||
| 152 | 23 | 0% | ||
| 153 | 19 | 0% | ||
| 154 | 16 | 0% | ||
| 154 | 16 | 0% | ||
| 155 | 14 | 0% | ||
| 155 | 14 | 0% | ||
| 155 | 14 | 0% | ||
| 156 | 12 | 0% | ||
| 156 | 12 | 0% | ||
| 157 | 10 | 0% | ||
| 158 | 6 | 0% | ||
| Other countries | 2,326 | 0.9% | ||
| Country not stated | 58 | 0% | ||
| Total | 248,748 | 100% |
Accommodations
Disabilities
In 2011 and 2012, several families were denied immigration to Canada because members of their family have an autism spectrum diagnosis and Citizenship and Immigration Canada (now IRCC) felt the potential cost of care for those family members would place an excessive demand on health or social services.[83][84] People with autism disorders can be accepted if they are able to depend on themselves.[84]
Job market and education
The federal government was asked by businesses to expand programs for professional immigrants to get Canadian qualifications in their fields. In response, the Multiculturalism Act of 1988 was passed, and Canadian Council on Learning was created by the federal government to promote best practices in workplace learning. Additionally, the credentials of immigrant workers are assessed through Canadian agencies by the IRCC for immigration.[85] Ideally, this credential equalization assessment reduces the gap between education and suitable jobs. However, strains of discrimination (i.e. statistical discrimination) lead to a systemic process of rejecting and discouraging immigrants, which is an antithesis for an anti-oppressive culture.[86][87][88][89]
Across Canada, businesses have proposed to allow unpaid or basic-pay internships as part of a rewards system, which were considered illegal (both in government and private) in many provinces at the time, posing as a major obstacle to integrate immigrants into the job market. The lack of policy leadership in this sector has resulted in a "catch-22” situation in which employers want job experience, but potential employees cannot get Canadian experience without first working Canadian jobs/internships.
Quebec
In 2017, the Province of Quebec stated that they will prohibit offering or receiving public services for individuals who cover their face, such as those who wear chadors, niqabs or burqas. The reasoning behind the bill was to ensure protection of Quebecois, but the discriminatory strain of the political ideology was reported to be aimed at articles of certain religious faiths. The bill would come under question of in regards to Canadian policy on religious tolerance and accommodation.[90][91][92] A qualitative study found that taste-based discrimination is more prevalent in cities than semi-urban areas, as major factors that contribute to less hostility seem to be regional differences in industrial composition and attendant labour demand.[93][94] There have been demands for the province to charge additional fees from immigrants before landing in Quebec. Quebecois have also urged the province to impose French language training in order for newcomers to become better integrated with the language and culture of their communities. As a result the government initiated a subsidized linguistic integration program in 2019.[95]
Recently, the province saw a 20% gap in earnings between immigrants and Canadian-born individuals in Quebec, largely due to the discrepancy between their respective literacy rates. In 2008, the Canadian Council on Learning reported that almost half of Canadian adults fall below the internationally-accepted literacy standard for coping in a modern society.[96]
See also
- Visa policy of Canada
- Canada (Citizenship and Immigration) v. Khosa
- History of Chinese immigration to Canada
- National Advancement Party of Canada
- Ministry of Immigration, Diversity and Inclusion — government of Quebec's immigration department
- Top 25 Canadian Immigrants Award
- Immigrant benefits urban legend — a hoax regarding benefits comparison
References
Notes
- The "family" category can be subdivided into (a) spouse, partner, and children; (b) parents and grandparents; and (c) other (includes "orphaned – brother, sister, nephew, niece and grandchild, and other relatives"). (Hussen 2017).
- The "Protected Persons and Refugees" category can be subdivided into: (a) Protected Persons in Canada and Dependants Abroad; (b) Government-Assisted Refugees (GARs); (c) Blended Visa Office-Referred Refugees; and (d) Privately Sponsored Refugees. (Hussen 2017).
Citations
- Hussen, Ahmed D. (1 November 2017). "2017 Annual Report to Parliament on Immigration". Immigration, Refugees and Citizenship Canada. Government of Canada. Retrieved 23 June 2018.
- Anderson, Stuart (2020). "Immigrants Flock To Canada, While U.S. Declines". Forbes. Retrieved April 16, 2020.
- Grant, Tavia (28 September 2016). "320,000 newcomers came to Canada in past year, highest number since 1971". The Globe and Mail. Retrieved 13 October 2016.
- IRCC (3 March 2016). "Express Entry Year-End Report 2015 – Canada.ca". Immigration, Refugees and Citizenship Canada. Government of Canada. Retrieved 2018-10-10.
- Statistics Canada (1 November 2017). "Immigration and ethnocultural diversity: Key results from the 2016 Census". The Daily, StatCan. Government of Canada. Retrieved 23 June 2018.
- Hollifield, James; Philip Martin; Pia Orrenius (2014). Controlling Immigration: A Global Perspective, Third Edition. Stanford University Press. p. 11. ISBN 978-0-8047-8627-0.
- Freeman, Gary P.; Randall Hansen; David L. Leal (2013). Immigration and Public Opinion in Liberal Democracies. Routledge. p. 8. ISBN 978-1-136-21161-4.
- Markus, Andrew. 2014. "Attitudes to immigration and cultural diversity in Australia." Journal of Sociology 50(1):10–22.
- Holliday, Ian (research associate). "Spirituality in a changing world: Half say faith is 'important' to how they consider society's problems" (PDF). Angus Reid Institute (public opinion poll). p. 15. Retrieved 4 May 2020.
- Statistics Canada Archived 2008-01-08 at the Wayback Machine – immigration from 1851 to 2001
- Smith, Marina L. 2000. "The Immigration and Naturalization Service (INS) at the U.S.–Canadian Border, 1893–1993: An Overview of Issues and Topics." Michigan Historical Review 26(2):127–47.
- Hall, "Clifford Sifton: Immigration and Settlement Policy, 1896–1905."
- Smith, Carrie-Ann. "Italian Immigration at Pier 21" (PDF). Canadian Museum of Immigration at Pier 21. Archived from the original (PDF) on 2017-08-16. Retrieved 2018-04-17.
- Janice Cavell, "The Imperial Race and the Immigration Sieve: The Canadian Debate on Assisted British Migration and Empire Settlement, 1900–30", Journal of Imperial and Commonwealth History 34#3 (2006): pp. 345–67.
- Fedorowich, Kent. 2016. "Restocking the British World: Empire Migration and Anglo-Canadian Relations, 1919–30." Britain and the World 9(2):236–69. doi:10.3366/brw.2016.0239 (open access).
- Korneski, Kurt. 2007. "Britishness, Canadianness, Class, and Race: Winnipeg and the British World, 1880s–1910s." Journal of Canadian Studies 41(2):161–84.
- Smith, David. 1981. "Instilling British Values in the Prairie Provinces." Prairie Forum 6(2):129–41.
- ICI.Radio-Canada.ca, Zone Politique -. "Il y a 50 ans, le Québec se dotait d'un ministère de l'Immigration". Radio-Canada.ca (in French). Retrieved 2018-11-04.
- Cameron, Elspeth (2004). Multiculturalism and Immigration in Canada: An Introductory Reader. Canadian Scholars’ Press. p. 118. ISBN 978-1-55130-249-2.
- "Is the current model of immigration the best one for Canada?", The Globe and Mail, Canada, December 12, 2005, retrieved August 16, 2006
- Shingler, Benjamin (October 1, 2018). "Here are the priorities of Quebec's new CAQ government". CBC News. Retrieved November 25, 2019.
- "The inside story of Jason Kenney's campaign to win over ethnic votes". Maclean's. Retrieved 2019-11-16.
- Bascaramurty, Dakshana (1 November 2017). "Canada aims for immigration boost to buttress economy as population ages". The Globe and Mail. Retrieved 23 June 2018.
- IRCC. 2019. "Statistics and Open Data." Immigration, Refugees and Citizenship Canada. Ottawa: Government of Canada. Archived 2010-09-04 at the Wayback Machine. Retrieved 5 May 2020.
- "Canada to admit nearly 1 million immigrants over next 3 years". CBC News. Retrieved 27 May 2018.
- "Canada to take 1 million immigrants by 2020". Sbs.com.au. Retrieved 27 May 2018.
- "Canada to Admit Almost a Million Immigrants Over Next Three Years". Bloomberg.com. 2 November 2017. Retrieved 27 May 2018.
- When immigration goes awry Archived 2013-01-16 at the Wayback Machine, Toronto Star, 14 July 2006. Retrieved 5 August 2006.
- Tweedie, Gregory; Dressler, Anja; Schmidt, Cora-Leah (2018-11-12). "Supporting Reconnecting Immigrant Families with English Language Learners in Rural Schools: An Exploratory Study of Filipino Arrivals to Alberta". Retrieved 17 November 2018.
- "Canadians want illegal immigrants deported: poll". Ottawa Citizen. Postmedia. 20 October 2007. Archived from the original on 20 October 2010. Retrieved 2010-10-18 – via Canada.com.
- "James Bissett: Stop bogus refugees before they get in". National Post. Postmedia. 27 September 2007. Archived from the original on 24 September 2015. Retrieved 2015-09-04.
- CTV News Staff (2008-05-06). "Canada has lost track of 41,000 illegals: Fraser". CTV News. Bell Media. Retrieved 2018-01-31.
- "Detention and Removal of Individuals—Canada Border Services Agency". 2008 May Report of the Auditor General of Canada. Office of the Auditor General of Canada. May 2008. Retrieved 2018-05-02.
- "Number Of Asylum Seekers At Quebec Border Nearly Quadrupled In July: Officials". HuffPost Canada. 2017-08-17. Retrieved 2018-03-16.
- Woods, Allan (2017-08-23). "Canada is not a safe haven for asylum seekers, Trudeau warns". The Toronto Star. ISSN 0319-0781. Retrieved 2017-10-16.
- "Trudeau says steps to tackle spike in asylum-seekers yielding 'positive results'". CBC News. Retrieved 2017-10-16.
- https://www.cbc.ca/news/politics/trudeay-lashes-out-conservatives-immigration-1.4948419
- "Settlement Worker – Alternative Jobs". settlement.org.
- Kurl, Shachi (exec. director) (3 October 2016). "What makes us Canadian? A study of values, beliefs, priorities and identity". Angus Reid (public opinion poll). The Angus Reid Institute and Canadian Broadcasting Corporation. Retrieved 2016-11-09.
- Reid, Angus (4 October 2016). "Canadians aren't as accepting as we think — and we can't ignore it, writes Angus Reid". CBC News. Canadian Broadcasting Corporation.
- The Canadian Press (7 November 2017). "Canadian attitudes towards immigration hardening, poll suggests". Toronto Star. Retrieved 5 May 2020.
- Maloney, Ryan (3 August 2018). "Most Canadians Say Irregular Border Crossings Are A 'Crisis,' Poll Suggests". HuffPost Canada. Retrieved 2019-10-23.
- Grenier, Éric. 3 August 2018. "Justin Trudeau is losing the argument on border crossings, poll suggests." CBC News. Toronto: Canadian Broadcasting Corporation.
- EKOS Politics (15 October 2019). "Increased Polarization on Attitudes to Immigration Reshaping the Political Landscape in Canada". EKOS Politics. Ottawa: EKOS Research Associates. Retrieved 2019-12-18.
- Maloney, Ryan (16 April 2019). "Survey Shows 'Clear' Racial Discrimination On Immigration Issue: Pollster". HuffPost Canada. Retrieved 2019-10-23.
- Wright, Thersea (16 Jun 2019). "Poll suggests majority of Canadians favour limiting immigration levels". CBC News. Canadian Broadcasting Corporation.
- Promoting opportunity for new Canadians – Prime Minister of Canada Archived 2006-09-14 at the Wayback Machine. Pm.gc.ca (2006-05-12). Retrieved on 2013-07-12.
- Colin Singer (June 15, 2015). "Canada: Canada Citizenship Reform: A Comparative Analysis". CCIRC (Canadian Citizenship & Immigration Resource Center). Retrieved December 26, 2015.
- "Canadian Citizenship: Second Wave Of Changes Take Effect October 11, 2017 (Includes Audio) – Immigration – Canada". Mondaq.com. Retrieved 2018-02-14.
- Cook, Tim. "Mackenzie King and the War Effort". The Canadian Encyclopedia. Retrieved 2018-02-14.
- CIC. "Facts and figures 2010 – Immigration overview: Permanent and temporary residents." Citizenship & Immigration Canada. Ottawa: Government of Canada. Archived from the "original" 2011-11-22. Retrieved 17 November 2011.
- Moving2Canada Working Holiday Visa in Canada guide retrieved March 24, 2016
- Canada, IRCC (31 March 2007). "Immigrate as a Quebec-selected skilled worker – Canada.ca". Immigration, Refugees and Citizenship Canada. [Government of Canada. Retrieved 2018-03-19.
- IRCC (17 September 2008). "Who can apply – Canadian Experience Class (Express Entry)". Immigration, Refugees and Citizenship Canada. Government of Canada. Retrieved 2018-03-19.
- IRCC (December 2017). "Immigrant Investor Venture Capital Pilot Program". Immigration, Refugees and Citizenship Canada. Government of Canada. Retrieved 2018-03-19.
- McKinsley, Sean. "OWNER OPERATOR INVESTMENT LMIA STREAM: OPPORTUNITIES FOR BUSINESSES & ENTREPRENEURS". Canada Immigration & Visa Services. Retrieved 17 May 2019.
- Offering "Express Entry" to Qualified Economic Immigrants – Actively Recruiting Talented Newcomers For the Benefit of Canada's Economy. (Archived) Government of Canada, April 8, 2014.
- "2canada.com/immigration-to-canada/express-entry-canada/ Moving2Canada Express Entry guide January 30, 2016
- "Alberta Immigrant Nominee Program (AINP)".
- Chisholm, McMillan LLP-Damon; Kuehn, Scott. "BC Government Targets Foreign Buyers with Massive Tax Hike – Lexology". Lexology.com. Retrieved 19 August 2017.
- CIC (2010). "Residence Calculator". Citizenship and Immigration Canada. Archived from the original on 2012-01-03. Retrieved 2011-11-19.
- Markusoff, Jason (Jan 10, 2018). "Canada's failing refugee system is leaving thousands in limbo". Maclean's. Retrieved 24 July 2018.
- Harris, Kathleen (21 January 2018). "Less than half the people deported from Canada in 2017 paid their own way home". CBC News. CBC/Radio-Canada. Retrieved 24 July 2018.
- IRCC. "Find out if you're eligible – Refugee status from inside Canada". Immigration, Refugees and Citizenship Canada. Government of Canada. Retrieved 2018-04-04.
- Bellemare, Andrea (25 August 2017). "How asylum seekers make refugee claims, and why they take so long". CBC News.
- Arbel, Efrat (2013-03-01). "Shifting Borders and the Boundaries of Rights: Examining the Safe Third Country Agreement between Canada and the United States". International Journal of Refugee Law. 25 (1): 65–86. doi:10.1093/ijrl/eet002. ISSN 0953-8186.
- Marwah, Sonal; Ball, Michelle (Autumn 2017). "Is the Safe Third Country Agreement putting refugee claimants at risk?". Ploughshares Monitor. 38 (3): 5–9.
- Foster, Michelle (Fall 2008). "Responsibility Sharing or Shifting? "Safe" Third Countries and International Law". Refuge. 25 (2): 64–78.
- Dawson, Carrie (2014). "Refugee Hotels: The Discourse of Hospitality and the Rise of Immigration Detention in Canada". University of Toronto Quarterly. 83 (4): 826–846. doi:10.3138/utq.83.4.826.
- Silverman, Stephanie J.; Molnar, Petra (2016-03-01). "Everyday Injustices: Barriers to Access to Justice for Immigration Detainees in Canada". Refugee Survey Quarterly. 35 (1): 109–127. doi:10.1093/rsq/hdv016. ISSN 1020-4067.
- Zifi, J. (2016). "Syrian refugee resettlement in Canada: an auto-ethnographic account of sponsorship." Canadian Association for Refugee and Forced Migration Studies. University of Toronto. Retrieved 29 March 2018.
- IRCC (November 2003). "Guide to the Private Sponsorship of Refugees Program". Immigration, Refugees and Citizenship Canada. Government of Canada. Retrieved 2018-03-30.
- "About refugees and Canada's response". Canadian Council for Refugees. Retrieved 2018-03-30.
- Labman, Shauna (2016). "Private Sponsorship: Complementary or Conflicting Interests?". Refuge. 32 (2): 67–80.
- "Projections of the Diversity of the Canadian Population". Statistics Canada. March 9, 2010. Retrieved 2010-03-15.
- "Parties prepare to battle for Immigrant votes". CTV News. Bell Media. 14 March 2010. Archived from the original on 2010-03-16. Retrieved 2010-03-15.
- Anderson, Stuart (2020). "Immigrants Flock To Canada, While U.S. Declines". Forbes. Retrieved April 16, 2020.
- IRCC (2018). "2017 Annual Report to Parliament on Immigration". Immigration, Refugee and Citizenship Canada. Government of Canada. Retrieved Dec 22, 2018.CS1 maint: date and year (link)
- IRCC (2017). "2017 Annual Report to Parliament on Immigration". Immigration, Refugees and Citizenship Canada. Government of Canada. "Table 3: Permanent Residents Admitted in 2016, by Top 10 Source Countries". Retrieved Jul 21, 2018.
- Statistics Canada (25 October 2017). "Immigrant population by place of birth, period of immigration, 2016 counts, both sexes, age (total), Canada, 2016 Census – 25% Sample data | Immigration and Ethnocultural Diversity Highlight Tables". Statistics Canada. Government of Canada. Retrieved 27 May 2018.
- IRCC (2016). "Annual Report to Parliament on Immigration, 2016". Immigration, Refugees and Citizenship Canada. Government of Canada. Retrieved 5 May 2020.
- CIC. "Facts and figures 2011 – Immigration overview: Permanent and temporary residents". Citizenship and Immigration Canada. Government of Canada. Archived from the original on 2012-12-30. Retrieved 2013-01-10.
- Merti, Steve (31 March 2012). "American UVic prof forced to leave Canada after immigration rules son's autism too big a taxpayer burden". Daily Brew – via Yahoo News.
- Wallace, Kenyon (9 June 2011). "Family faces deportation over son's autism". Toronto Star.
- CIC (30 January 2020) [2012]. "Where can I get an Educational Credential Assessment (ECA)?". Citizenship and Immigration Canada. Government of Canada.
- Hendry, Leah. 25 September 2018. "'I didn't come here to live this kind of life': Skilled immigrants on desperate hunt for jobs in Quebec" CBC News. Montreal: Canadian Broadcasting Corporation.
- Reitz, Jeffrey G. 2007. "Immigrant Employment Success in Canada, Part I: Individual and Contextual Causes." Journal of International Migration and Integration 8:11–36. doi:10.1007/s12134-007-0001-4
- Raza, Muhammad, Roderic Beaujot, and Gebremariam Woldemicael 2012. "Social Capital and Economic Integration of Visible Minority Immigrants in Canada." Journal of International Migration and Integration 14. doi:10.1007/s12134-012-0239-3.
- Collie, Meghan (25 June 2019). "Canada has a discrimination problem when it comes to hiring — here's why". Global News. Corus Entertainment. Retrieved 2019-10-23.
- Bergeron, Patrice. 24 October 2017. "Quebec to prohibit government employees from wearing Muslim chador, niqab and burka." The Canadian Press via CTV News.
- Peritz, Ingrid. 18 October 2017. "Quebec bans face covering in public services, raising worries among Muslims". The Globe and Mail. Montreal.
- CBC News staff. 16 August 2017. "No niqabs on public buses? Confusion reigns after surprise amendments to Quebec bill." CBC News. Montreal: Canadian Broadcasting Corporation.
- Magesan, Arvind. 25 October 2015. "New figures show just how big Canada's immigrant wage gap is." Maclean's.
- StatCan. 25 October 2017. "Census in Brief: Linguistic integration of immigrants and official language populations in Canada" (2016 Census Program Census in Brief). Statistics Canada. Government of Canada.
- https://www.immigration-quebec.gouv.qc.ca/en/french-language/full-time/
- CCIL. 2008. "Reading the Future: Planning to Meet Canada’s Future Literacy Needs." Ottawa, ON: Canadian Council on Learning.
Further reading
History
- Adelman, Howard; Borowski, Allan; Burstein, Meyer; and Foster, Lois, eds. Immigration and Refugee Policy: Australia and Canada Compared (1996)
- Avery, Donald H. Reluctant Host: Canada's Response to Immigrant Workers, 1896–1994 (1996)
- Carment, David; Bercuson, David Jay (2008), The World in Canada: Diaspora, Demography, and Domestic Politics, McGill-Queen's Univ. Press, ISBN 9780773532960
- Dirks, Gerald E (May 1, 1977), Canada's Refugee Policy: Indifference or Opportunism?, McGill-Queen's University Press, ISBN 978-0-7735-0296-3
- Hall, D.J. (1977), Howard Palmer (ed.), "Clifford Sifton: Immigration and Settlement Policy, 1896–1905", The Settlement of the West, pp. 60–85
- Hawkins, Freda (1990), Critical Years in Immigration: Canada and Australia Compared, McGill-Queen's Press, ISBN 9780773508521
- Kelley, Ninette; Trebilcock, Michael J. (2010), The Making of the Mosaic: A History of Canadian Immigration Policy (2nd ed.), University of Toronto Press, ISBN 978-0-8020-9536-7
- Knowles, Valerie (2008), Strangers at Our Gates: Canadian Immigration and Immigration Policy, 1540–2006 a standard scholarly history
- Lacroix, Patrick (2016). "From Strangers to 'Humanity First': Canadian Social Democracy and Immigration Policy, 1932–1961". Canadian Journal of History. 51 (1): 58–82. doi:10.3138/cjh.ach.51.1.003.
- McLean, Lorna "'To Become Part of Us': Ethnicity, Race, Literacy and the Canadian Immigration Act of 1919", Canadian Ethnic Studies, 36#2 (2004): pp. 1–28.
- Magocsi, Paul R (1999), Encyclopedia of Canada's peoples
- Powell, John (2005), Encyclopedia of North American Immigration, Facts On File, ISBN 978-0-8160-4658-4
- Timlin, Mabel F (November 1960). "Canada's Immigration Policy, 1896-1910". Canadian Journal of Economics and Political Science. 26 (4): 517–532. doi:10.2307/138931. JSTOR 138931.
- Walker, Barrington (2008), The History of Immigration and Racism in Canada: Essential Readings, Canadian Scholars' Press, ISBN 978-1-55130-340-6
Guides
- Adu-Febiri, Francis (2009), Succeeding from the margins of Canadian society: a strategic resource for new immigrants, refugees and international students, CCB Pub, ISBN 978-1-926585-27-7
- Kranc, Benjamin A; Constantin, Elena (2004), Getting into Canada: How to Make a Successful Application for Permanent Residence, How To Books, ISBN 978-1-85703-929-0
- DeRocco, John F. Chabot (2008), From Sea to Sea to Sea: A Newcomer's Guide to Canada, Full Blast Productions, ISBN 978-0-9784738-4-6
- Driedger, Leo; Halli, Shivalingappa S. (1999), Immigrant Canada: Demographic, Economic, and Social Shallenges, University of Toronto Press, ISBN 978-0-8020-4276-7
- Moens, Alexander; Collacott, Martin (2008), Immigration Policy and the Terrorist Threat in Canada and the United States, Fraser Institute, ISBN 978-0-88975-235-1
- Noorani, Nick; Noorani, Sabrina (2008), Arrival Survival Canada: A Handbook for New Immigrants, Oxford University Press, ISBN 978-0-19-542891-9
External links
- History of Canadian immigration at Marianopolis College
- Moving Here, Staying Here: The Canadian Immigrant Experience at Library and Archives Canada
- Immigration from Canada to Belgium
- Going to Canada – Immigration Portal: A source of free and useful information for newcomers and prospective immigrants to Canada.
- Be Aware! Canadian import laws