Demographics of Metro Vancouver
The demographics of Metro Vancouver indicate a multicultural and multiracial region. Metro Vancouver is a metropolitan area, with its major urban centre being Vancouver, British Columbia, Canada. The Vancouver census metropolitan area, as defined by Statistics Canada, encompasses roughly the same territory as the Metro Vancouver Regional District, a regional district in British Columbia. The regional district includes 23 local authorities. Figures provided here are for the Vancouver census metropolitan area and not for the City of Vancouver.
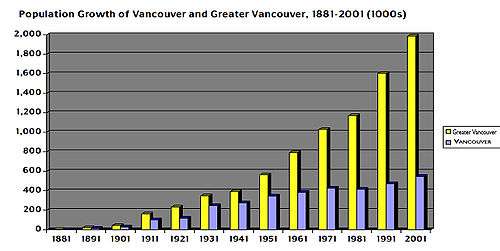
Population growth
The following table shows the development of the number of inhabitants according to census data of Statistics Canada. The former municipalities of Point Grey and South Vancouver are not included in the data prior to 1931.[1][lower-alpha 1]
| Vancouver | ||
|---|---|---|
| Year | Pop. | ±% |
| 1891 | 13,709 | — |
| 1901 | 26,133 | +90.6% |
| 1911 | 100,401 | +284.2% |
| 1921 | 117,217 | +16.7% |
| 1931 | 246,593 | +110.4% |
| 1941 | 275,353 | +11.7% |
| 1951 | 344,833 | +25.2% |
| 1956 | 365,844 | +6.1% |
| 1961 | 384,522 | +5.1% |
| 1966 | 410,375 | +6.7% |
| 1971 | 426,256 | +3.9% |
| 1976 | 410,188 | −3.8% |
| 1981 | 414,281 | +1.0% |
| 1986 | 431,147 | +4.1% |
| 1991 | 471,644 | +9.4% |
| 1996 | 514,008 | +9.0% |
| 2001 | 545,671 | +6.2% |
| 2006 | 578,041 | +5.9% |
| 2011 | 603,502 | +4.4% |
| 2016 | 631,486 | +4.6% |
| Metro Vancouver | ||
|---|---|---|
| Year | Pop. | ±% |
| 1891 | 21,887 | — |
| 1901 | 42,926 | +96.1% |
| 1911 | 164,020 | +282.1% |
| 1921 | 232,597 | +41.8% |
| 1931 | 347,709 | +49.5% |
| 1941 | 393,898 | +13.3% |
| 1951 | 562,462 | +42.8% |
| 1961 | 790,741 | +40.6% |
| 1971 | 1,028,334 | +30.0% |
| 1981 | 1,169,831 | +13.8% |
| 1991 | 1,602,590 | +37.0% |
| 1996 | 1,831,665 | +14.3% |
| 2001 | 1,986,965 | +8.5% |
| 2006 | 2,116,581 | +6.5% |
| 2011 | 2,313,328 | +9.3% |
| 2016 | 2,463,431 | +6.5% |
Ethnic origin
The demographics of Metro Vancouver reveal a multi-ethnic society. There remains a small population, less than 2%, of Aboriginal peoples, who according to archeological and historical records, have inhabited this region for more than 3,000 years.
From the time of the region's first non-indigenous settlement in the second half of the 19th century, people from Britain and Ireland were the largest group of immigrants and, collectively, remain the largest ethnic grouping in Vancouver to this day. The largest non British or Irish ethnic groups situated in Vancouver include Chinese, Indians and Germans.
The metropolitan area has one of the most diverse Chinese-speaking communities with several varieties of Chinese being represented. Metro Vancouver contains the second-largest Chinatown in North America (after San Francisco's), and many multicultural neighbourhoods such as the Punjabi Market, Greektown, and Japantown. Commercial Drive, the core of the historic Little Italy, which is also the main Portuguese area, has become an alternative-culture focus, though traditional Italian and Portuguese and other establishments and residents remain in the area. Bilingual street signs can be seen in Chinatown and the Punjabi Market, and commercial signs in a wide array of languages can be seen all over the metropolitan area.
|
|
|
Aboriginal peoples
As of around 2009, 3% of residents of Vancouver state that they have at least some ancestry from the First Nations, and of that 3%, over half state that they also have non-First Nations ancestry. A person with some First Nations ancestry may not necessarily identify as someone who is First Nations.[5]
There is a small community of aboriginal people in Vancouver as well as in the surrounding metropolitan region, with the result that Vancouver constitutes the largest native community in the province, albeit an unincorporated one (i.e. not as a band government). There is an equally large or larger Métis contingent.
British and other European origins
Much of the white population consists of persons whose origins go back to Britain or Ireland and, until recently, British Columbians with British or Irish ancestry most likely came directly from those islands, rather than via Ontario or the Maritime Provinces. Until the 1960s, it was easier to purchase the Times of London and The Guardian in Vancouver than it was to find the Toronto Globe and Mail or Montreal Gazette.
Other large and historically important European ethnic groups consist of Germans, Dutch, French (of both European and Canadian origin), Ukrainians, Scandinavians, Finns, Italians, Croats, Hungarians, Greeks, and lately numerous Romanians, Russians, Portuguese, Serbs and Poles. Non-visible minorities such as newly arrived Eastern Europeans and the new wave of Latin Americans are also a feature of the city's ethnic landscape. Prior to the Hong Kong influx of the 1980s, the largest non-British Isles ethnic group in the city was German, followed by Ukrainian and the Scandinavian ethnicities. Most of these earlier East European immigrant are fully assimilated or intermarried with other groups, although a new generation of East Europeans form a distinct linguistic and social community.
Chinese origins
The first Chinese immigrants to British Columbia were men who came to "the British Colonies of Canada," as they called British Columbia, for the Fraser Canyon Gold Rush of 1858 and a decade later to work on building the Canadian Pacific Railway.
South Asian origins
Indian immigrants first arrived in Vancouver during the late 19th century.[6] Most ethnic South Asians in the Lower Mainland are Punjabi Sikhs. Surrey has the largest ethnic South Asian population in Metro Vancouver, at 32.4%. The Newton neighbourhood in Surrey contains the highest percentage of ethnic Indians in a neighbourhood in Metro Vancouver.[7]
Korean origins
As of 2014 there are about 70,000 ethnic Koreans in the Vancouver area.[8]
An H-Mart and several Korean restaurants are located on Robson Street.[9] As of 2008 there are many Korean national students at the university and primary/secondary levels studying English.[10] Other areas with Korean businesses include Kingsway in Vancouver, Burnaby, and New Westminster; other areas in Vancouver; North Road in Burnaby and Coquitlam, and areas of Port Coquitlam.[11] As of 2011 Coquitlam is a popular area of settlement for Koreans.[12]
Rimhak Ree (Yi Yimhak) came to Vancouver to study mathematics at the University of British Columbia in 1953, making him the first known ethnic Korean to live in the city.[13] There were about 50 ethnic Koreans in Vancouver in the mid-1960s. The first Korean United Church congregation in the city opened in 1965. Numbers of Korean immigration to Canada increased due to more permissive immigration laws established in the 1960s as well as the home country's political conflict and poverty. There were 1,670 ethnic Koreans in Vancouver by 1975, making up 16% of all ethnic Koreans in Canada and a 3000% increase from the mid-1960s population.[14] Korean immigration to Canada decreased after a more restrictive immigration law was enacted in 1978.[15]
Christianity is a popular religion among ethnic Koreans. About 200 Korean churches are in the Vancouver area.[8]
In 1986 Greater Vancouver had fewer than 5,000 ethnic Koreans. In 1991 the number had increased to 8,330. The number of ethnic Koreans in the Vancouver area increased by 69% in the period 1996 through 2001.[16] The number of university students from Korea choosing to study in Vancouver had become most of the Korean students studying in Canada by the late 1990s.[10] The first Korean grocery store in the North Road area opened in 2000.[11] In 2001 28,850 ethnic Koreans live in Greater Vancouver, and this increased to 44,825 according to the 2006 census.[16]
Canwest Global does a co-venture with the Canada Express, a Korean publication, to serve ethnic Koreans. It previously published a Korean edition of the Vancouver Sun but later stopped. Daniel Ahadi and Catherine A. Murray, authors of "Urban Mediascapes and Multicultural Flows: Assessing Vancouver’s Communication Infrastructure," wrote that the Korean edition of the Vancouver Sun was "error-fraught".[17]
Other Asian ethnicities
Other significant Asian ethnic groups in Vancouver are Vietnamese, Filipino, Cambodian and Japanese. In Vancouver the term 'Asian' is normally used to refer only to East Asian and Southeast Asian peoples, while South Asians are usually referred to as Indo-Canadian or East Indians. Technically, though, the term 'Asian' may refer to either group, and also to the large Persian and other Middle Eastern populations as well as elements from Central Asia.
Tables of ethnicities (Vancouver CMA)
| Ethnic origin | Population (2016)[18] | Percent of 2,426,235 | Population (2006)[19] | Percent of 2,097,960 |
|---|---|---|---|---|
| Cornish | 245 | 0% | 225 | 0.02% |
| English | 470,340 | 19.4% | 500,340 | 24.09% |
| Irish | 275,355 | 11.3% | 251,695 | 12.00% |
| Manx | 770 | 0% | 640 | 0.03% |
| Scottish | 341,075 | 14.1% | 337,230 | 16.07% |
| Welsh | 44,935 | 1.9% | 41,805 | 1.99% |
| British, n.i.e.** | 55,695 | 2.3% | 35,505 | 1.69% |
| Acadians | 1,520 | 0.1% | 1,280 | 0.06% |
| French | 147,835 | 6.1% | 137,270 | 6.54% |
| Inuit | 600 | 0% | 580 | 0.03% |
| Métis | 24,505 | 1% | 17,110 | 0.82% |
| North American Indian | 52,305 | 2.2% | 43,190 | 2.06% |
| American | 32,115 | 1.3% | 27,000 | 1.29% |
| Canadian | 331,205 | 13.7% | 278,350 | 13.27% |
| Newfoundlander | 660 | 0% | 390 | 0.02% |
| Nova Scotian | 75 | 0% | 120 | 0.01% |
| Ontarian | 35 | 0% | 20 | less than 0.01% |
| Québécois | 750 | 0% | 350 | 0.02% |
| Other North American provincial or regional groups | 170 | 0% | 150 | 0.01% |
| Antiguan | 130 | 0% | 105 | 0.01% |
| Bahamian | 160 | 0% | 50 | less than 0.01% |
| Barbadian | 1,310 | 0.1% | 925 | 0.04% |
| Bermudan | 155 | 0% | 100 | less than 0.01% |
| Carib | 60 | 0% | 85 | less than 0.01% |
| Cuban | 870 | 0% | 640 | 0.03% |
| Dominican, n.o.s.*** | 535 | 0% | 295 | 0.01% |
| Grenadian | 280 | 0% | 175 | 0.01% |
| Guyanese | 1,240 | 0.1% | 825 | 0.04% |
| Haitian | 635 | 0% | 405 | 0.02% |
| Jamaican | 6,455 | 0.3% | 4,645 | 0.22% |
| Kittitian/Nevisian | 95 | 0% | 15 | less than 0.01% |
| Martinican | 20 | 0% | 40 | less than 0.01% |
| Montserratan | 15 | 0% | 20 | less than 0.01% |
| Puerto Rican | 280 | 0% | 260 | 0.01% |
| St. Lucian | 115 | 0% | 80 | less than 0.01% |
| Trinidadian/Tobagonian | 3,120 | 0.1% | 2,185 | 0.10% |
| Vincentian/Grenadinian | 325 | 0% | 120 | 0.01% |
| West Indian | 1,440 | 0.1% | 1,245 | 0.06% |
| Caribbean, n.i.e.** | 1,485 | 0.1% | 620 | 0.03% |
| Aboriginal from Central/South America | 1,790 | 0.1% | 830 | 0.04% |
| Argentines | 1,360 | 0.1% | 790 | 0.04% |
| Belizean | 35 | 0% | 160 | less than 0.01% |
| Bolivian | 185 | 0% | 190 | less than 0.01% |
| Brazilian | 4,065 | 0.2% | 1,115 | 0.05% |
| Chilean | 3,840 | 0.2% | 2,935 | 0.14% |
| Colombian | 4,600 | 0.2% | 2,125 | 0.10% |
| Costa Rican | 460 | 0% | 355 | 0.02% |
| Ecuadorian | 740 | 0% | 225 | 0.01% |
| Guatemalan | 1,985 | 0.1% | 1,405 | 0.07% |
| Hispanic | 1,200 | 0% | 555 | 0.03% |
| Honduran | 1,120 | 0% | 745 | 0.04% |
| Maya | 620 | 0% | 575 | 0.03% |
| Mexican | 15,115 | 0.6% | 7,680 | 0.37% |
| Nicaragua | 1,060 | 0% | 860 | 0.04% |
| Panamanian | 195 | 0% | 145 | 0.01% |
| Paraguayan | 285 | 0% | 170 | 0.01% |
| Peruvian | 3,100 | 0.1% | 1,910 | 0.09% |
| Salvadoran | 5,310 | 0.2% | 5,760 | 0.27% |
| Uruguayan | 285 | 0% | 60 | less than 0.01% |
| Venezuelan | 1,555 | 0.1% | 535 | 0.03% |
| Latin, Central or South American, n.i.e.** | 2,450 | 0.1% | 1,225 | 0.06% |
| Austrian | 21,260 | 0.9% | 21,500 | 1.02% |
| Belgian | 8,205 | 0.3% | 6,555 | 0.31% |
| Dutch (Netherlands) | 77,635 | 3.2% | 71,710 | 3.42% |
| Flemish | 955 | 0% | 815 | 0.04% |
| Frisian | 195 | 0% | 155 | 0.01% |
| German | 222,025 | 9.2% | 203,715 | 9.71% |
| Luxembourger | 330 | 0% | 235 | 0.01% |
| Swiss | 11,340 | 0.5% | 10,130 | 0.48% |
| Finnish | 14,085 | 0.6% | 12,745 | 0.61% |
| Danish | 23,025 | 0.9% | 22,800 | 1.09% |
| Icelandic | 11,055 | 0.5% | 9,630 | 0.46% |
| Norwegian | 49,335 | 2% | 46,260 | 2.20% |
| Swedish | 40,690 | 1.7% | 39,920 | 1.90% |
| Northern European, n.i.e.** | 5,320 | 0.2% | 3,830 | 0.18% |
| Estonian | 2,540 | 0.1% | 2,590 | 0.12% |
| Latvian | 2,455 | 0.1% | 2,160 | 0.10% |
| Lithuanian | 4,155 | 0.2% | 3,100 | 0.15% |
| Belarusian | 1,825 | 0.1% | 820 | 0.04% |
| Czech | 11,710 | 0.5% | 10,385 | 0.50% |
| Czechoslovak | 2,560 | 0.1% | 2,810 | 0.13% |
| Slovak | 6,345 | 0.3% | 5,700 | 0.27% |
| Hungarian (Magyar) | 25,860 | 1.1% | 23,365 | 1.11% |
| Polish | 70,590 | 2.9% | 60,715 | 2.89% |
| Romanian | 17,490 | 0.7% | 14,055 | 0.67% |
| Russian | 58,535 | 2.4% | 47,935 | 2.28% |
| Ukrainian | 94,400 | 3.9% | 81,725 | 3.90% |
| Albanian | 1,330 | 0.1% | 650 | 0.03% |
| Bosnian | 2,675 | 0.1% | 2,535 | 0.12% |
| Bulgaria | 2,940 | 0.1% | 1,960 | 0.09% |
| Croatian | 15,670 | 0.6% | 12,475 | 0.59% |
| Cypriot | 345 | 0% | 270 | 0.01% |
| Greek | 16,085 | 0.7% | 15,025 | 0.72% |
| Italian | 87,875 | 3.6% | 76,345 | 3.64% |
| Kosovar | 170 | 0% | 85 | less than 0.01% |
| Macedonian | 865 | 0% | 600 | 0.03% |
| Maltese | 1,185 | 0% | 990 | 0.05% |
| Montenegrin | 600 | 0% | 370 | 0.02% |
| Portuguese | 24,575 | 1% | 20,335 | 0.97% |
| Serbian | 10,160 | 0.4% | 7,690 | 0.37% |
| Sicilian | 210 | 0% | 180 | 0.01% |
| Slovenian | 3,050 | 0.1% | 2,475 | 0.12% |
| Spanish | 43,990 | 1.8% | 36,000 | 1.72% |
| Yugoslavs | 3,275 | 0.1% | 5,525 | 0.26% |
| Basque | 475 | 0% | 405 | 0.02% |
| Gypsy (Roma) | 325 | 0% | 250 | 0.01% |
| Jewish | 11,230 | 0.5% | 21,465 | 1.02% |
| misc. Slav (European) | 505 | 0% | 760 | 0.04% |
| Other European, n.i.e.** | 6,470 | 0.3% | 3,975 | 0.19% |
| Afrikaner | 365 | 0% | 290 | 0.01% |
| Akan | 30 | 0% | 25 | less than 0.01% |
| Amhara | 115 | 0% | 65 | less than 0.01% |
| Angolan | 55 | 0% | 70 | less than 0.01% |
| Ashanti | 65 | 0% | 65 | less than 0.01% |
| Bantu | 235 | 0% | 170 | 0.01% |
| Black | 1,460 | 0.1% | 3,005 | 0.14% |
| Burundian | 195 | 0% | 90 | less than 0.01% |
| Congolese (Zairian) people | 675 | 0% | 75 | less than 0.01% |
| Congolese, n.o.s.*** | 400 | 0% | 85 | less than 0.01% |
| Dinka | 15 | 0% | 25 | less than 0.01% |
| East African people | 1,390 | 0.1% | 610 | 0.03% |
| Eritrean | 950 | 0% | 335 | 0.02% |
| Ethiopian | 2,020 | 0.1% | 1,625 | 0.08% |
| Gabonese | 10 | 0% | 10 | less than 0.01% |
| Gambian | 20 | 0% | 15 | less than 0.01% |
| Ghanaian | 1,270 | 0.1% | 1,100 | less than 0.01% |
| Guinean, n.o.s.*** | 125 | 0% | 95 | less than 0.01% |
| Ibo | 200 | 0% | 15 | less than 0.01% |
| Ivoirian | 45 | 0% | 15 | less than 0.01% |
| Kenyan | 1,170 | 0% | 765 | 0.04% |
| Malagasay | 80 | 0% | 35 | less than 0.01% |
| Mauritian | 760 | 0% | 325 | 0.02% |
| Nigerian | 1,680 | 0.1% | 880 | 0.04% |
| Oromo | 120 | 0% | 145 | 0.01% |
| Rwandan | 305 | 0% | 225 | 0.01% |
| Senegalese | 45 | 0% | 20 | less than 0.01% |
| Seychellois | 15 | 0% | 20 | less than 0.01% |
| Sierra Leonean | 90 | 0% | 115 | 0.01% |
| Somali | 2,105 | 0.1% | 1,320 | 0.06% |
| South African | 6,485 | 0.3% | 4,120 | 0.20% |
| Sudanese | 940 | 0% | 705 | less than 0.01% |
| Tanzanian | 425 | 0% | 135 | 0.01% |
| Tigrian | 180 | 0% | 50 | less than 0.01% |
| Togolese | 80 | 0% | 15 | less than 0.01% |
| Ugandan | 595 | 0% | 360 | 0.02% |
| Yoruba | 130 | 0% | 80 | less than 0.01% |
| Zambian | 120 | 0% | 40 | less than 0.01% |
| Zimbabwean | 565 | 0% | 230 | 0.01% |
| Zulu | 65 | 0% | 70 | less than 0.01% |
| African, n.i.e.** | 10,325 | 0.4% | 6,490 | 0.31% |
| Egyptian | 3,405 | 0.1% | 2,120 | 0.10% |
| Iraqi | 5,205 | 0.2% | 1,805 | 0.09% |
| Jordanian | 585 | 0% | 300 | 0.01% |
| Kuwaiti | 100 | 0% | 75 | less than 0.01% |
| Lebanese | 5,320 | 0.2% | 6,175 | 0.29% |
| Libyan | 210 | 0% | 25 | less than 0.01% |
| Algerian | 615 | 0% | 390 | 0.02% |
| Berber | 185 | 0% | 150 | 0.01% |
| Moroccan | 1,480 | 0.1% | 635 | 0.03% |
| Tunisian | 380 | 0% | 70 | less than 0.01% |
| Maghrebi origins, n.i.e.** | 170 | 0% | 160 | 0.01% |
| Palestinian | 2,245 | 0.1% | 1,050 | 0.05% |
| Saudi Arabian | 550 | 0% | 255 | 0.01% |
| Syrian | 2,780 | 0.1% | 925 | 0.04% |
| Yemeni | 255 | 0% | 75 | less than 0.01% |
| Arab, n.i.e.** | 4,655 | 0.2% | 3,075 | 0.15% |
| Afghan | 7,500 | 0.3% | 4,620 | 0.22% |
| Armenian | 2,845 | 0.1% | 2,700 | 0.15% |
| Assyrian | 450 | 0% | 355 | 0.02% |
| Azeribaijani | 890 | 0% | 405 | 0.02% |
| Georgian | 550 | 0% | 240 | 0.01% |
| Iranian | 44,355 | 1.8% | 27,155 | 1.29% |
| Israeli | 2,075 | 0.1% | 765 | 0.04% |
| Kurd | 1,980 | 0.1% | 1,145 | 0.05% |
| Pashtun | 325 | 0% | 170 | 0.01% |
| Tatar | 650 | 0% | 235 | 0.01% |
| Turk | 5,185 | 0.2% | 3,380 | 0.16% |
| West Asian, n.i.e.** | 2,135 | 0.1% | 1,350 | 0.06% |
| Bangladeshi | 1,510 | 0.1% | 785 | 0.04% |
| Bengali | 755 | 0% | 415 | 0.02% |
| Indian | 243,135 | 10% | 181,895 | 8.67% |
| Goan | 320 | 0% | 280 | 0.01% |
| Gujarati | 615 | 0% | 515 | 0.02% |
| Kashmiri | 145 | 0% | 70 | less than 0.01% |
| Nepali | 1,155 | 0% | 460 | 0.02% |
| Pakistani | 10,825 | 0.4% | 6,875 | 0.33% |
| Punjabi | 30,670 | 1.3% | 13,735 | 0.65% |
| Sinhalese | 530 | 0% | 415 | 0.02% |
| Sri Lankan | 5,065 | 0.2% | 3,740 | 0.18% |
| Tamil | 1,060 | 0% | 740 | 0.04% |
| South Asian, n.i.e.** | 7,200 | 0.3% | 6,495 | 0.31% |
| Burmese | 1,970 | 0.1% | 865 | 0.04% |
| Cambodian | 2,510 | 0.1% | 1,525 | 0.07% |
| Chinese | 499,175 | 20.6% | 402,000 | 19.16% |
| Filipino | 133,925 | 5.5% | 83,760 | 3.99% |
| Hmong | 115 | 0% | 75 | less than 0.01% |
| Indonesian | 4,935 | 0.2% | 3,140 | 0.15% |
| Japanese | 37,630 | 1.6% | 30,230 | 1.44% |
| Khmer | 0 | 0% | 135 | 0.01% |
| Korean | 55,505 | 2.3% | 46,040 | 2.19% |
| Laotian | 1,775 | 0.1% | 1,065 | 0.05% |
| Malaysian | 4,230 | 0.2% | 3,365 | 0.16% |
| Mongolian | 1,000 | 0% | 680 | 0.03% |
| Singaporean | 895 | 0% | 515 | 0.02% |
| Taiwanese | 20,345 | 0.8% | 9,810 | 0.47% |
| Thai | 3,330 | 0.1% | 1,565 | 0.07% |
| Tibetan | 445 | 0% | 100 | Less than 0.01% |
| Vietnamese | 34,915 | 1.4% | 26,115 | 1.24% |
| East or Southeast Asian, n.i.e.** | 630 | 0% | 1,170 | 0.06% |
| Asian, n.o.s.*** | 1,805 | 0.1% | 80 | less than 0.01% |
| Australian | 8,360 | 0.3% | 5,525 | 0.26% |
| New Zealander | 3,340 | 0.1% | 2,390 | 0.11% |
| Fijian | 13,085 | 0.5% | 8,920 | 0.43% |
| Hawaiian | 865 | 0% | 660 | 0.03% |
| Māori | 565 | 0% | 375 | 0.02% |
| Polynesia | 345 | 0% | 265 | 0.01% |
| Samoan | 245 | 0% | 160 | 0.01% |
| Pacific Islander, n.i.e.** | 680 | 210 | 0.01% | |
| *Percentages total more than 100% due to multiple responses, e.g. German-East Indian, Norwegian-Irish-Polish | ||||
| **'not included elsewhere.' | ||||
| ***'not otherwise specified.' |
By city
| City | Population | Ethnic group #1 | % | Ethnic group #2 | % | Ethnic group #3 | % | Ethnic group #4 | % | Ethnic group #5 | % |
|---|---|---|---|---|---|---|---|---|---|---|---|
| Vancouver[20] | 631,486 | European | 48.2 | Chinese | 27 | South Asian | 6 | Filipino | 5.9 | Southeast Asian | 2.8 |
| Surrey[21] | 517,887 | European | 38.7 | South Asian | 32.4 | Chinese | 7.7 | Filipino | 6.2 | Aboriginal | 2.6 |
| Burnaby[22] | 232,755 | European | 34.6 | Chinese | 33.9 | South Asian | 8.1 | Filipino | 5.7 | Korean | 3.4 |
| Richmond[23] | 198,309 | Chinese | 53 | European | 23.7 | South Asian | 7.3 | Filipino | 6.9 | Japanese | 2 |
| Coquitlam[24] | 139,284 | European | 47.6 | Chinese | 21 | Korean | 7.2 | West Asian | 5.6 | South Asian | 4.5 |
| Langley Township[25] | 117,285 | European | 77.6 | South Asian | 4.4 | Chinese | 4.2 | Aboriginal | 3.7 | Korean | 3.1 |
| Delta[26] | 102,238 | European | 60.4 | South Asian | 20.3 | Chinese | 7.6 | Aboriginal | 3.4 | Filipino | 2.6 |
| North Vancouver (District)[27] | 85,395 | European | 70.9 | Chinese | 6.9 | West Asian | 6.5 | South Asian | 3.6 | Aboriginal | 2.5 |
| Maple Ridge[28] | 82,256 | European | 75.8 | Aboriginal | 4.6 | South Asian | 3 | Chinese | 2.8 | Filipino | 2.2 |
| New Westminster[29] | 70,996 | European | 60.3 | Chinese | 10 | South Asian | 8.3 | Filipino | 8.2 | Aboriginal | 4.2 |
| Port Coquitlam[30] | 58,612 | European | 63.7 | Chinese | 11.1 | South Asian | 4.8 | Aboriginal | 4.4 | Filipino | 4.3 |
| North Vancouver (City)[31] | 52,898 | European | 65.2 | West Asian | 8.4 | Filipino | 6.6 | Chinese | 4.4 | South Asian | 3.5 |
| West Vancouver[32] | 42,473 | European | 76.8 | Chinese | 18.4 | West Asian | 8.9 | South Asian | 2.3 | Korean | 2.2 |
| Port Moody[33] | 33,551 | European | 68.0 | Chinese | 10.3 | Korean | 5.3 | West Asian | 3.8 | Aboriginal | 3.2 |
| Langley City[34] | 25,888 | European | 79.1 | Aboriginal | 7.1 | Southeast Asian | 2.6 | South Asian | 2.3 | Filipino | 2.0 |
| White Rock[35] | 19,952 | European | 77.9 | Chinese | 6.2 | South Asian | 5.0 | Aboriginal | 3.4 | Filipino | 1.0 |
| Pitt Meadows[36] | 18,573 | European | 75.1 | South Asian | 4.5 | Aboriginal | 4.0 | Filipino | 3.7 | Chinese | 3.1 |
| Electoral District A[37] | 16,133 | Chinese | 42.0 | European | 33.3 | Korean | 8.1 | South Asian | 4.1 | West Asian | 2.6 |
| Bowen Island[38] | 3,680 | European | 90.5 | Aboriginal | 3.5 | South Asian | 1.5 | Japanese | 1.0 | Korean | 0.8 |
| Anmore[39] | 2,210 | European | 76.0 | Chinese | 11.3 | Aboriginal | 2.5 | West Asian | 2.5 | Japanese | 1.4 |
| Lions Bay[40] | 1,334 | European | 86.6 | Latin American | 2.5 | Chinese | 2.5 | West Asian | 1.8 | Filipino | 1.1 |
| Tsawwassen[41] | 816 | European | 64.7 | Aboriginal | 30.7 | Chinese | 4.0 | South Asian | 1.3 | Filipino | 1.3 |
| Belcarra[42] | 643 | European | 84.0 | Chinese | 7.6 | South Asian | 1.7 | Filipino | 0.0 | Aboriginal | 0.0 |
By riding
| Riding | Population | Ethnic group #1 | % | Ethnic group #2 | % | Ethnic group #3 | % | Ethnic group #4 | % | Ethnic group #5 | % |
|---|---|---|---|---|---|---|---|---|---|---|---|
| Burnaby North-Seymour[43] | 102,486 | European | 54.6 | Chinese | 24.4 | South Asian | 4.3 | Aboriginal | 3 | Filipino | 2.9 |
| Burnaby South[44] | 111,973 | Chinese | 38.7 | European | 32.2 | South Asian | 8.4 | Filipino | 6.2 | Korean | 3.5 |
| Cloverdale-Langley City[45] | 117,640 | European | 64.3 | South Asian | 14.1 | Aboriginal | 4.7 | Filipino | 4.2 | Chinese | 3.4 |
| Coquitlam-Port Coquitlam[46] | 123,576 | European | 51.7 | Chinese | 19.6 | West Asian | 5.6 | Korean | 5.1 | South Asian | 4.2 |
| Delta[47] | 103,064 | European | 60.4 | South Asian | 20.2 | Chinese | 7.6 | Aboriginal | 3.6 | Filipino | 2.6 |
| Fleetwood-Port Kells[48] | 116,958 | European | 30.3 | South Asian | 30.1 | Chinese | 13.0 | Filipino | 9.1 | Southeast Asian | 4.9 |
| Langley-Aldergrove[49] | 117,017 | European | 73.7 | South Asian | 5.8 | Aboriginal | 4.9 | Chinese | 3.8 | Korean | 2.8 |
| New Westminster-Burnaby[50] | 115,340 | European | 49 | Chinese | 16.7 | South Asian | 10.3 | Filipino | 8.5 | Aboriginal | 3.5 |
| North Vancouver[51] | 115,344 | European | 67.2 | West Asian | 8.1 | Chinese | 5.7 | Filipino | 4.1 | South Asian | 3.6 |
| Pitt Meadows-Maple Ridge[52] | 101,101 | European | 76.5 | Aboriginal | 5.3 | South Asian | 3.3 | Chinese | 2.9 | Filipino | 2.5 |
| Port Moody-Coquitlam[53] | 110,817 | European | 59.7 | Chinese | 13.7 | Korean | 6.2 | South Asian | 4.3 | Filipino | 3.7 |
| Richmond Centre[54] | 98,396 | Chinese | 59 | European | 24 | Filipino | 6.1 | South Asian | 4.3 | Japanese | 1.7 |
| South Surrey-White Rock[55] | 104,051 | European | 68.3 | Chinese | 12.8 | South Asian | 8.5 | Aboriginal | 2.9 | Korean | 1.5 |
| Steveston-Richmond East[56] | 99,913 | Chinese | 47 | European | 26.7 | South Asian | 10.3 | Filipino | 7.7 | Japanese | 2.3 |
| Surrey Centre[57] | 120,172 | South Asian | 35.1 | European | 31.2 | Filipino | 9 | Chinese | 5.7 | Aboriginal | 3.9 |
| Surrey Newton[58] | 114,605 | South Asian | 60.7 | European | 22.5 | Filipino | 4.8 | Chinese | 2.9 | Aboriginal | 2.6 |
| Vancouver Centre[59] | 116,443 | European | 63.2 | Chinese | 11.4 | West Asian | 4.6 | South Asian | 3.6 | Korean | 3.2 |
| Vancouver East[60] | 115,724 | European | 56.2 | Chinese | 22.1 | Aboriginal | 6 | Filipino | 4.7 | Southeast Asian | 3.5 |
| Vancouver Granville[61] | 103,456 | European | 52.1 | Chinese | 31.4 | Filipino | 3.7 | South Asian | 3.3 | Aboriginal | 2.1 |
| Vancouver Kingsway[62] | 104,870 | Chinese | 36.0 | European | 31.7 | Filipino | 12.5 | South Asian | 6.8 | Southeast Asian | 6.3 |
| Vancouver South[63] | 102,927 | Chinese | 37.9 | European | 21.8 | South Asian | 17.2 | Filipino | 11.3 | Southeast Asian | 3.6 |
| Vancouver Quadra[64] | 105,608 | European | 58.9 | Chinese | 26.9 | South Asian | 2.7 | Aboriginal | 2.5 | Korean | 2.3 |
Visible minorities
Pie chart of the ethnic breakdown of Metro Vancouver from the 2016 census
In the city of Vancouver and four adjacent municipalities (Surrey, Burnaby, Richmond, and Coquitlam), there is no visible majority. Hence, the term visible minority is used here in contrast to the overall Canadian population which remains predominantly of European descent. In Metro Vancouver, at the 2016 census, 48.9% of the population were members of non-European ethnic groups and 48.6% were members of European ethnic groups. 2.5% of the population identified as First Nations.
Greater Vancouver has more interracial couples than Canada's two largest cities, Toronto and Montreal. In 2011, 9.6% of married and common-law couples in Greater Vancouver are interracial; double the Canadian average of 4.6%,[65] and higher than in the Toronto CMA (8.2%) and the Greater Montreal (5.2%). Vancouver has less residential segregation of its ethnic minorities compared to Canadian cities like Montreal.[66] However, residential segregation in Greater Vancouver continues to persist in certain parts of the metropolitan area.
| Population group | 2016 | 1981 | |||
|---|---|---|---|---|---|
| Number | % of total | Number | % of total | ||
| Visible minority group | Chinese | 474,655 | 19.6% | 63,845 | 5.1% |
| South Asian | 291,005 | 12% | 34,820 | 2.8% | |
| Filipino | 123,170 | 5.1% | 12,830 | 1% | |
| Korean | 52,980 | 2.2% | 3,335 | 0.3% | |
| West Asian | 46,010 | 1.9% | 2,220 | 0.2% | |
| Southeast Asian | 44,905 | 1.9% | 4,440 | 0.4% | |
| Latin American | 34,805 | 1.4% | 3,025 | 0.2% | |
| Japanese | 30,110 | 1.2% | 11,715 | 0.9% | |
| Black | 29,830 | 1.2% | 2,570 | 0.2% | |
| Arab | 16,430 | 0.7% | 2,305 | 0.2% | |
| Visible minority, n.i.e. | 6,490 | 0.3% | N/A | N/A | |
| Multiple visible minorities | 35,295 | 1.5% | N/A | N/A | |
| Total visible minority population | 1,185,680 | 48.9% | 141,105 | 11.3% | |
| European | 1,179,100 | 48.6% | 1,098,655 | 87.8% | |
| Aboriginal group | 61,455 | 2.5% | 10,850 | 0.9% | |
| Total population | 2,426,235 | 100% | 1,250,610 | 100% | |
Aboriginal peoples
Aboriginal peoples, who make up less than two percent of the city's population, are not considered a visible minority group by Statistics Canada.
| Aboriginal peoples[69][70] | |||||
|---|---|---|---|---|---|
| Aboriginal group | First Nations | 7,865 | 1.3% | 7,510 | 1.3% |
| Métis | 3,595 | 0.6% | 3,235 | 0.6% | |
| Inuit | 70 | 0% | 45 | 0% | |
| Aboriginal, n.i.e. | 305 | 0.1% | 210 | 0% | |
| Multiple Aboriginal identities | 100 | 0% | 140 | 0% | |
| Total Aboriginal population | 11,945 | 2% | 11,145 | 1.9% | |
| Total population | 590,210 | 100% | 571,600 | 100% | |
Future projections
| Group | 2016 | 2036 | ||
|---|---|---|---|---|
| Number | % of 2016 population (2,426,235) | Number[72] | % of 2036 estimated population (3,301,000) | |
| European origins | 1,179,100 | 48.6% | 1,250,000 | 37.9% |
| East and Southeast Asian origins | 725,820 | 30% | 1,216,000 | 36.8% |
| South Asian and Middle Eastern origins | 353,445 | 14.6% | 626,000 | 19.0% |
| Aboriginal origins | 61,455 | 2.5% | 97,000 | 2.9% |
| Latin, Central and South American origins | 34,805 | 1.4% | 73,000 | 2.2% |
| African origins | 29,830 | 1.2% | 55,000 | 1.7% |
| Other | 41,785 | 1.8% | 81,000 | 2.5% |
| *Percentages total over 100% due to multiple responses, e.g. German-Indian, Norwegian-Irish. | ||||
Languages
The following figures come from the 2016 census profile for Vancouver, the census metropolitan area.[73]
| Language | Population | % |
|---|---|---|
| English only | 2,130,565 | 87.3 |
| French only | 1,110 | <0.1 |
| English and French | 172,140 | 7.1 |
| Neither English nor French | 136,320 | 5.6 |
| Identified languages with 10,000+ speakers | Population | % |
|---|---|---|
| English | 1,316,635 | 54.0 |
| English + non-official language | 69,885 | 2.9 |
| Cantonese | 184,370 | 7.6 |
| Mandarin | 174,920 | 7.2 |
| Panjabi (Punjabi) | 151,205 | 6.2 |
| Tagalog (Filipino) | 66,830 | 2.7 |
| Korean | 45,990 | 1.9 |
| Persian (Farsi) | 41,265 | 1.7 |
| Spanish | 36,625 | 1.5 |
| French | 25,000 | 1.0 |
| Hindi | 24,220 | 1.0 |
| German | 24,060 | 1.0 |
| Vietnamese | 22,950 | 0.9 |
| Russian | 18,170 | 0.7 |
| Japanese | 16,900 | 0.7 |
| Italian | 15,445 | 0.6 |
| Arabic | 14,320 | 0.6 |
| Polish | 12,040 | 0.5 |
| Portuguese | 11,950 | 0.5 |
| Minnan Chinese (e.g. Hokkien, Teochew) | 10,655 | 0.4 |
Notes:
- The figures for Cantonese, Mandarin and Minnan do not include 8,485 speakers of "Chinese (not otherwise specified)", some of whom may speak Cantonese, Mandarin or Minnan. The total number of speakers of all varieties of Chinese is 385,355 (15.8% of the population).
- The figure for Hindi does not include 8,880 speakers of Urdu, see Hindi–Urdu controversy.
Immigration
| Immigrants to Vancouver by place of birth (2011 to 2016)[74] | |||
|---|---|---|---|
| Rank | Country | Population # | % of immigrants |
| 1 | China | 35,890 | 25.2% |
| 2 | India | 21,380 | 15.0% |
| 3 | Philippines | 20,200 | 14.2% |
| 4 | Iran | 8,310 | 5.8% |
| 5 | South Korea | 6,635 | 4.7% |
| 6 | United States | 4,065 | 2.9% |
| 7 | United Kingdom | 3,855 | 2.7% |
| 8 | Taiwan | 2,325 | 1.6% |
| 9 | Mexico | 2,295 | 1.6% |
| 10 | Iraq | 1,850 | 1.3% |
| 11 | Japan | 1,845 | 1.3% |
| 12 | Syria | 1,785 | 1.3% |
| 13 | Hong Kong | 1,695 | 1.2% |
| 14 | Pakistan | 1,670 | 1.2% |
| 15 | Vietnam | 1,505 | 1.1% |
Homelessness
The 2011 Metro Vancouver Homeless Count revealed that there were at least 2,650 people found to be homeless in Metro Vancouver.[75] This particular homeless count is and continues to be conducted once every three years, taking place over a brief 24-hour period. The report published on these results stated, "It is important to note that all Homeless Counts are inherently undercounts and that the 2011 Metro Vancouver Count was no exception."[75] Nonetheless, these counts can be used as indicators to determine homelessness trends within Metro Vancouver. Between 2002 and 2005, "the count revealed that homelessness in the region nearly doubled from 1121 to 2174 persons".[76] From 2005 to 2008, the count revealed a much smaller increase in homelessness, from 2174 to 2660 persons. Thus, the count conducted in 2011 implies that the homeless population has remained relatively stable between 2008 and 2011.
Of the homeless people surveyed in 2011, "71% were sheltered in either an emergency shelter, safe house, transition house or temporary facility such as a hospital, jail or detoxification centre...while 29% slept in outdoor locations or at someone else's place".[75] 74 of the 2,650 homeless persons counted were children – those under the age of 19 – who accompanied a parent who was also homeless. Furthermore, of the homeless youth surveyed, 102 individuals were under the age of 19, 221 between the ages of 19–24, and 74 whose ages could not be identified, for a total of 397 homeless. Adults constituted the largest cohort of homeless in Metro Vancouver with 275 individuals between the ages of 25–34, 328 between the ages of 35–44, and 397 between the ages of 45–54, for a total of 1,000 homeless. Lastly, seniors – those above the age of 55 – constituted 268 homeless people. Of the 2,650 people identified in the count, ages for 985 people could not be provided.
Homelessness doesn't occur suddenly, rather it is a progression wherein an individual becomes part of the group of 'at risk' individuals, remains in this group for some time, and then, finally, becomes homeless due to economic hardships and social dislocation.[77] "Contemporary definitions split homelessness into two broad groups: 'absolute' homelessness, which refers to persons or households literally without physical shelter, and 'relative' homelessness, which includes a range of housing situations characterized as being at-risk of homelessness."[76] Indeed, being classified as at-risk of homelessness does not imply that an individual or household will become homeless in the future, only that various pre-conditions exist that may lead to this.[78] These pre-conditions include, but are not restricted to the following: people living in SROs (Single Room Occupancy), people living in rooming houses, and people paying more than 50% of their net income towards housing costs.[77] "Two-thirds of responses from homeless individuals enumerated in a recent homeless count in Greater Vancouver cited economic reasons for their being homeless – with lack of income and cost of housing accounting for 44% and 22% of responses respectively."[78]
Housing affordability has and continues to be the top priority housing issue Vancouverites must resolve. In 1996, a study published by BC Housing revealed that 25% of renter households in Vancouver pay 50% or more of their incomes to rent.[77] The core housing need model, developed by the CMHC, uses a threshold of households spending at least 30% of their income on shelter costs to illuminate households experiencing acute housing affordability needs. "Moving from the 30% shelter cost-to-income ratio (STIR) used in the core housing need model, to a 50% threshold, typically reduces the number of households identified by more than half."[76] In 2001, Statistics Canada published a study using both the 30% and 50% thresholds to identify renters and homeowners facing unaffordable housing costs in Metro Vancouver. This study revealed that 8.1% of homeowners and 27.8% of renters exceeded the 30% threshold, while 4.0% of homeowners and 10.8% of renters exceeded the 50% threshold. More in depth still, this study also found that 18.5% of immigrants living in Vancouver exceeded the 30% threshold and 8.0% exceed the 50% threshold. Only 11.3% and 4.8% of Canadian born households exceeded the 30% and 50% thresholds, respectively.
Heather Smith and David Ley found that in Canada's gateway cities, "the appreciable growth of the low-income population during the 1990s was almost entirely attributable to the growing poverty of recent immigrants".[79] They go on to state, "adult immigrants who had landed in the previous decade endured a poverty rate of...37 percent in Vancouver".[79] Immigrants, recent and old, therefore constitute a large proportion of households in Metro Vancouver considered to be at-risk of homelessness. Analysis conducted by Robert Fiedler revealed that, in 2001, "29.1% of persons in households...in Greater Vancouver are below more than one CMHC housing standard, indicating that...some households not only must spend an unsustainably high proportion of their income on shelter costs, but must also live in overcrowded and/or substandard conditions to access housing".[78] Although many new immigrants to Canada come from educated backgrounds, many having bachelor's degrees, they are paid less on average than Canadian born individuals and "Over the past 25 years, the incomes of recent immigrants to Canada have progressively declined relative to the native-born."[80]
Recently, the City of Vancouver released a new strategy targeting homelessness and affordable housing. The strategy will be enacted in 2012 and will run until 2021, with the goal of ending street homelessness completely by 2015, as well as increasing affordable housing choices for all Vancouverites. The City of Vancouver indicates that from 2002 to 2011, "homelessness has increased nearly three-fold" from approximately 628 homeless in 2002, to 1,605 homeless in 2011.[81] The strategy goes on to report that SRO rooms are increasingly being lost to conversions and rent increases even though SRO hotels constitute a majority of Vancouver's lowest income housing stock. As Robert Fiedler noted in 2006, "renters are disproportionately located in the City of Vancouver, which contains only 27.8% of the area's total population, but 40.2% of all renters".[78] Furthermore, low vacancy rates in Vancouver's market rental stock, a decreasing new supply of apartments in recent decades, and a widening gap of household incomes and housing prices are just a few challenges that must be overcome. By 2021, the City of Vancouver hopes to enable 5,000 additional social housing units, 11,000 new market rental-housing units, and 20,000 market ownership units.[81]
Religion
Vancouver, like the rest of British Columbia, has a low rate of church attendance compared with the rest of the continent and the majority of the population does not practice religion.[83][84] It has a significant Sikh and Buddhist population, mostly adherents from India and China.
Vancouver religious profile from 2011 Census[85] 41.7% Christian 41.5% No religious affiliation, including agnostic, atheist, Humanist, and "no religion" 6.8% Sikh 3.4% Buddhist 3.2% Muslim 1.8% Hindu 0.8% Jewish 0.8% Other religions, including Pagan, Wicca, Unity, New Thought,
Pantheist, Scientology, Rastafarian, New Age, Gnostic, Satanist0.07% Aboriginal spirituality
Notes
- Vancouver did not exist as such at the time of the 1881 and 1871 censuses.
Citations
- "Vancouver Public Library" (PDF). Archived from the original (PDF) on 2007-06-14. Retrieved 2007-02-06.
- Data taken from: "British Columbia Regional District and Municipal Census Populations" (PDF). BC Stats.; "British Columbia Municipal and Regional District 1996 Census Results". BC Stats.;"British Columbia Municipal and Regional District 2001 Census Results". BC Stats.;Davis, Chuck (1997). The Greater Vancouver Book: An Urban Encyclopedia. Surrey, BC: Linkman Press. p. 780. ISBN 978-1-896846-00-2.
- "Census Profile, 2016 Census Vancouver [Census metropolitan area], British Columbia and British Columbia [Province]".
- "Census Profile, 2016 Census Vancouver [Census metropolitan area], British Columbia and British Columbia [Province]".
- Bloemraad, Irene. "Diversity and Elected Officials in the City of Vancouver" (Chapter 2). In: Andrew, Caroline, John Biles, Myer Siemiatycki, and Erin Tolley (editors). Electing a Diverse Canada: The Representation of Immigrants, Minorities, and Women. UBC Press, July 1, 2009. ISBN 0774858583, 9780774858588. Start p. 46. CITED: p. 68.
- Walton-Roberts and Hiebert, Immigration, Entrepreneurship, and the Family Archived 2014-10-18 at the Wayback Machine, p. 124.
- "The Vancouver Sun maps the ethnic makeup of Metro Vancouver (interactive)". Vancouver Sun. October 13, 2011.
- "Metro’s 70,000 ethnic Koreans: Most turn to fervent, conservative Christianity." Vancouver Sun. March 2, 2014. Retrieved on December 24, 2014.
- Baker p. 162-163 (PDF 9-10/26).
- Baker p. 163 (PDF 10/26).
- Baker, Don and Larry DeVries. "Introduction" (Archive). In: DeVries, Larry, Don Baker, and Dan Overmyer (editors). Asian Religions in British Columbia (Asian Religions and Society Series). University of British Columbia Press, 2010. ISBN 978-0-7748-1662-5. p. 5.
- "Ethnic mapping 6: Koreans, Poles, Scots, Ukrainians and more." Vancouver Sun. October 20, 2011. Retrieved on December 24, 2014.
- Baker p. 159 (PDF 6/26).
- Baker p. 160 (PDF 7/26).
- Baker p. 160-161 (PDF 7-8/26).
- Baker p. 162 (PDF 9/26).
- Ahadi, Daniel and Catherine A. Murray (Simon Fraser University). "Urban Mediascapes and Multicultural Flows: Assessing Vancouver’s Communication Infrastructure" (Archive). Canadian Journal of Communication, Vol 34 (2009) p. 587-611. CITED: p. 596.
- "Census Profile, 2016 Census Vancouver [Census metropolitan area], British Columbia and British Columbia [Province] Ethnic Origin". Statistics Canada.
- Profile of Ethnic Origin and Visible Minorities for Census Metropolitan Areas and Census Agglomerations, 2006 Census Archived October 30, 2013, at the Wayback Machine
- "Vancouver City".
- "Surrey City".
- "Burnaby City".
- "Richmond City".
- "Coquitlam City".
- "Langley Township".
- "Delta City".
- "North Vancouver District".
- "Maple Ridge".
- "New Westminster".
- "Port Coquitlam City".
- "North Vancouver City".
- "West Vancouver City".
- "Port Moody City".
- "Langley City".
- "White Rock".
- "Pitt Meadows".
- "Electoral District A".
- "Bowen Island".
- "Anmore".
- "Lions Bay".
- "Tsawwassen".
- "Belcarra".
- "Burnaby North-Seymour".
- "Burnaby South".
- "Cloverdale-Langley City".
- "Coquitlam-Port Coquitlam".
- "Delta".
- "Fleetwood-Port Kells".
- "Langley-Aldergrove".
- "New Westminster-Burnaby".
- "North Vancouver".
- "Pitt Meadows-Maple Ridge".
- "Port Moody-Coquitlam".
- "Richmond Centre".
- "South Surrey-White Rock".
- "Steveston-Richmond East".
- "Surrey Centre".
- "Surrey-Newton".
- "Vancouver Centre".
- "Vancouver East".
- "Vancouver Granville".
- "Vancouver-Kingsway".
- "Vancouver South".
- "Vancouver Quadra".
- "Proportion of couples in mixed unions, Canada, 1991 to 2011". Statistics Canada. 13 April 2016. Retrieved 22 March 2019.
- Residential Segregation of Visible Minorities in Canada's gateway cities Residential Segregation of visible minorities in Canada's Gateway cities P207
- Census Profile, 2016 Census: Greater Vancouver, Regional district. Statistics Canada. Retrieved 2 April 2018.
- 1981 Census of Canada: British Columbia. Ethnic Origin. Statistics Canada. Retrieved 17 December 2018.
- "Statistics Canada: 2006 Community Profiles". 12.statcan.gc.ca. Retrieved 27 May 2018.
- "Statistics Canada: 2006 Aboriginal Population Profile". 12.statcan.gc.ca. Retrieved 27 May 2018.
- "Census Profile, 2016 Census: Greater Vancouver, Regional district". Retrieved 2 October 2018.
- "Population by visible minority group, place of residence and projection scenario, Canada, 2011 and 2036". Retrieved 2018-10-02.
- Vancouver (census metropolitan area) Profile, Vancouver 2016
- "Immigrant population by place of birth, period of immigration, 2016 counts, both sexes, age (total), Vancouver, 2016 Census – 25% Sample data".
- Regional Steering Committee on Homelessness (February 2012). Results of the 2011 Metro Vancouver Homeless Count (Report).
- Fiedler, Rob; Schuurman, Hyndman (8 May 2006). "Hidden homelessness: An indicator-based approach for examining the geographies of recent immigrants at-risk of homelessness in Greater Vancouver". Cities. 3. 23: 11. doi:10.1016/j.cities.2006.03.004.
- Eberle Planning and Research (April 2001). Homelessness - Causes and Effects: A Profile, Policy Review and Analysis of Homelessness in British Columbia (PDF) (Report).
- Fiedler, Robert (2006). Geographies of Immigrants at Risk for Homelessness in Greater Vancouver (M.A. thesis). Simon Fraser University. p. 108.
- Smith, Heather; Ley (25 June 2008). "Even in Canada? The Multiscalar Construction and Experience of Concentrated Immigrant Poverty in Gateway Cities". Annals of the Association of American Geographers. 3. 98: 27. doi:10.1080/00045600802104509.
- Moore, Eric; Pacey (25 June 2008). "Changing Income Inequality and Immigration in Canada, 1980-1995". Canadian Public Policy. 1. 29: 19. JSTOR 3552487.
- City of Vancouver (June 2011). Vancouver's Housing and Homeless Strategy 2012-2021: A Home for Everyone (Report).
- "Metro Vancouver Population by Religion, 2011 NHS" (PDF). Metrovancouver.org. Retrieved 26 May 2018.
- "Clark, Warren. "Patterns of Religious Attendance"" (PDF). Retrieved 27 May 2018.
- Babych, Art. "Attendance Drops in Church". Western Catholic Reporter. Archived 2007-09-02 at the Wayback Machine
- "2011 National Household Survey Profile - Census subdivision". 12.statcan.gc.ca. Retrieved 20 March 2019.
References
- Baker, Don. "Koreans in Vancouver: A Short History." Journal of the Canadian Historical Association, 2008, Vol.19(2), pp. 155–180
Further reading
- Gumpp, Ruth. "Ethnicity and Assimilation: German Postwar Immigrants in Vancouver, 1945-1970" (M.A. thesis). University of British Columbia, 1989.
- Walhouse, Freda. 1961. The Influence of Minority Ethnic Groups on the Culture Geography of Vancouver (M.A. thesis), University of British Columbia.
| Topics |
|
|---|---|
| By province | |
| By city | |
| Census in Canada |
|
| Lists | |
| Ethnic ancestry |
| ||||||||||||||||||||||||||||||||||||||||||||||||||
|---|---|---|---|---|---|---|---|---|---|---|---|---|---|---|---|---|---|---|---|---|---|---|---|---|---|---|---|---|---|---|---|---|---|---|---|---|---|---|---|---|---|---|---|---|---|---|---|---|---|---|---|
| Demographics |
| ||||||||||||||||||||||||||||||||||||||||||||||||||
| Culture and society | |||||||||||||||||||||||||||||||||||||||||||||||||||
| List of Canadians |
| ||||||||||||||||||||||||||||||||||||||||||||||||||
| |||||||||||||||||||||||||||||||||||||||||||||||||||
| Features |
| ||||
|---|---|---|---|---|---|
| History | |||||
| Geography | |||||
| Economy | |||||
| Politics | |||||
| Public services | |||||
| Education |
| ||||
| Culture | |||||
| Transportation | |||||
| |||||