1988 United States presidential election in New Mexico
The 1988 United States presidential election in New Mexico took place on November 8, 1988. All 50 states and the District of Columbia, were part of the 1988 United States presidential election. State voters chose 5 electors to the Electoral College, which selected the president and vice president.
| ||||||||||||||||||||||||||
| ||||||||||||||||||||||||||
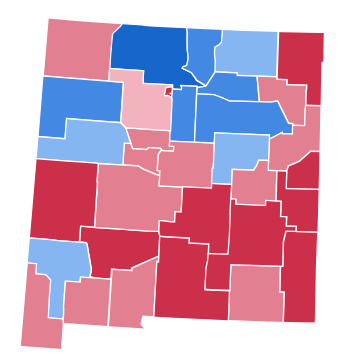 County Results
| ||||||||||||||||||||||||||
| ||||||||||||||||||||||||||

| Elections in New Mexico | |||||||||
|---|---|---|---|---|---|---|---|---|---|
 | |||||||||
|
|||||||||
New Mexico was won by incumbent United States Vice President George H. W. Bush of Texas, who was running against Massachusetts Governor Michael Dukakis. Bush ran with Indiana Senator Dan Quayle as Vice President, and Dukakis ran with Texas Senator Lloyd Bentsen.
New Mexico weighed in for this election as 4 percentage points more Democratic than the national average.
Partisan background
The presidential election of 1988 was a very partisan election for New Mexico, with 98 percent of the electorate voting for either the Democratic or Republican parties.[1] As of the 2016 presidential election, this is the last presidential election in New Mexico in which Bernalillo County, Doña Ana County, and Socorro County voted for a Republican presidential candidate.[2] The Democratic stronghold in the northern part of the state is evident during this election, and remains largely intact from this point onward to current political times.
Republican victory
Bush won the election in New Mexico with a solid 5 percentage point margin. The election results in New Mexico are reflective of a nationwide reconsolidation of base for the Republican Party, which took place through the 1980s. Through the passage of some economic programs, spearheaded by then President Ronald Reagan (called, collectively, "Reaganomics"), the mid-to-late 1980s saw a period of economic growth and stability. The hallmark for Reaganomics was, in part, the wide-scale deregulation of corporate interests, and large scale tax cuts.
Dukakis ran on a socially liberal platform, and advocated for economic reform and governmental transparency. Bush, on the other hand, ran on a campaign of continuing the social and economic policies of former President Reagan – which gained him much support with social conservatives and people living in rural areas.
Results
| 1988 United States presidential election in New Mexico | |||||
|---|---|---|---|---|---|
| Party | Candidate | Votes | Percentage | Electoral votes | |
| Republican | George H. W. Bush | 270,341 | 51.86% | 5 | |
| Democratic | Michael Dukakis | 244,497 | 46.90% | 0 | |
| Libertarian | Ron Paul | 3,268 | 0.63% | 0 | |
| New Alliance Party | Lenora Fulani | 2,237 | 0.43% | 0 | |
| Socialist Workers Party | James Warren | 344 | 0.07% | 0 | |
| Workers World | Larry Holmes | 258 | 0.05% | 0 | |
| Prohibition | Earl Dodge | 249 | 0.05% | 0 | |
| Write-Ins | 93 | 0.02% | 0 | ||
| Totals | 521,287 | 100.0% | 5 | ||
Results by county
| George Herbert Walker Bush Republican |
Michael Stanley Dukakis Democratic |
Various candidates Other parties |
Margin | |||||
|---|---|---|---|---|---|---|---|---|
| County | % | # | % | # | % | # | % | # |
| Lincoln | 66.40% | 3,511 | 31.96% | 1,690 | 1.65% | 87 | 34.44% | 1,821 |
| Union | 65.87% | 1,291 | 32.55% | 638 | 1.58% | 31 | 33.32% | 653 |
| Curry | 66.17% | 8,032 | 32.91% | 3,995 | 0.91% | 111 | 33.26% | 4,037 |
| Los Alamos | 65.22% | 6,622 | 32.26% | 3,275 | 2.52% | 256 | 32.97% | 3,347 |
| Chaves | 65.84% | 13,367 | 33.15% | 6,730 | 1.01% | 206 | 32.69% | 6,637 |
| Lea | 65.36% | 11,309 | 33.98% | 5,879 | 0.66% | 115 | 31.38% | 5,430 |
| Otero | 64.50% | 9,984 | 34.14% | 5,284 | 1.36% | 210 | 30.37% | 4,700 |
| Catron | 62.25% | 925 | 32.97% | 490 | 4.78% | 71 | 29.27% | 435 |
| Roosevelt | 63.18% | 3,589 | 35.79% | 2,033 | 1.04% | 59 | 27.39% | 1,556 |
| Sierra | 60.19% | 2,507 | 38.30% | 1,595 | 1.51% | 63 | 21.90% | 912 |
| San Juan | 58.39% | 16,202 | 39.98% | 11,094 | 1.64% | 454 | 18.41% | 5,108 |
| Torrance | 57.19% | 2,252 | 41.09% | 1,618 | 1.73% | 68 | 16.10% | 634 |
| De Baca | 56.60% | 643 | 42.25% | 480 | 1.14% | 13 | 14.35% | 163 |
| Harding | 56.10% | 377 | 43.30% | 291 | 0.60% | 4 | 12.80% | 86 |
| Quay | 55.62% | 2,454 | 43.09% | 1,901 | 1.29% | 57 | 12.53% | 553 |
| Hidalgo | 54.46% | 1,100 | 44.60% | 901 | 0.94% | 19 | 9.85% | 199 |
| Bernalillo | 53.62% | 92,830 | 45.25% | 78,346 | 1.13% | 1,959 | 8.37% | 14,484 |
| Eddy | 52.90% | 9,805 | 46.10% | 8,544 | 1.00% | 186 | 6.80% | 1,261 |
| Luna | 51.46% | 3,415 | 46.20% | 3,066 | 2.34% | 155 | 5.26% | 349 |
| Valencia | 51.80% | 7,874 | 46.95% | 7,136 | 1.25% | 190 | 4.86% | 738 |
| Doña Ana | 51.70% | 21,582 | 46.97% | 19,608 | 1.33% | 557 | 4.73% | 1,974 |
| Socorro | 50.09% | 3,114 | 47.61% | 2,960 | 2.30% | 143 | 2.48% | 154 |
| Sandoval | 49.50% | 9,411 | 49.09% | 9,332 | 1.41% | 268 | 0.42% | 79 |
| Colfax | 44.37% | 2,256 | 54.77% | 2,785 | 0.87% | 44 | -10.40% | -529 |
| Grant | 43.10% | 4,196 | 55.91% | 5,443 | 0.99% | 96 | -12.81% | -1,247 |
| Cibola | 43.02% | 2,640 | 56.35% | 3,458 | 0.64% | 39 | -13.33% | -818 |
| Guadalupe | 40.63% | 861 | 58.66% | 1,243 | 0.71% | 15 | -18.03% | -382 |
| McKinley | 36.81% | 5,694 | 62.04% | 9,595 | 1.15% | 178 | -25.22% | -3,901 |
| Mora | 36.27% | 923 | 62.91% | 1,601 | 0.83% | 21 | -26.64% | -678 |
| Santa Fe | 34.91% | 12,891 | 63.86% | 23,581 | 1.23% | 455 | -28.95% | -10,690 |
| Taos | 31.29% | 2,897 | 67.73% | 6,271 | 0.98% | 91 | -36.44% | -3,374 |
| San Miguel | 30.62% | 2,763 | 67.95% | 6,131 | 1.43% | 129 | -37.33% | -3,368 |
| Rio Arriba | 28.46% | 3,024 | 70.61% | 7,503 | 0.93% | 99 | -42.15% | -4,479 |
See also
References
- "1988 Presidential General Election Results – New Mexico". Dave Leip's Atlas of U.S. Presidential Elections. Retrieved 2018-02-15.
- Sullivan, Robert David; ‘How the Red and Blue Map Evolved Over the Past Century’; America Magazine in The National Catholic Review; June 29, 2016
