1988 United States presidential election in Nevada
The 1988 United States presidential election in Nevada took place on November 8, 1988. All 50 states and the District of Columbia, were part of the 1988 United States presidential election. State voters chose four electors to the Electoral College, which selected the president and vice president.
| ||||||||||||||||||||||||||
| ||||||||||||||||||||||||||
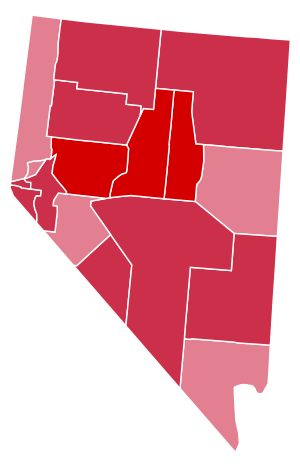 County Results
Bush 50–60%
60–70%
70–80% | ||||||||||||||||||||||||||
| ||||||||||||||||||||||||||

| Elections in Nevada | ||||||||
|---|---|---|---|---|---|---|---|---|
 | ||||||||
|
||||||||
|
||||||||
|
||||||||
| None of These Candidates | ||||||||
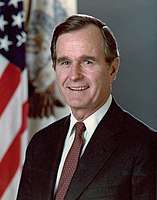
Nevada was won by incumbent United States Vice President George H. W. Bush of Texas, who was running against Massachusetts Governor Michael Dukakis. Bush ran with Indiana Senator Dan Quayle as Vice President, and Dukakis ran with Texas Senator Lloyd Bentsen. Bush carried Nevada with 58.86% of the vote, while Dukakis received 37.92%, a victory margin of 20.94%.
Nevada weighed in for this election as about 13% more Republican than the national average. This was also the last election in which Clark County, the most populated county in Nevada, was won by a Republican presidential candidate.[1]
Partisan background
The presidential election of 1988 was a rather multi-partisan election for Nevada, with more than 3% of the state voting for third parties or for Nevada's "None of These Candidates" option.[2]
This would be the last election in which a Republican presidential nominee would win heavily populated Clark County, home to the city of Las Vegas, which beginning in 1992 would become a reliably Democratic stronghold in the state. Consequently, 1988 was also the last occasion in which a Republican presidential candidate swept every county in Nevada, and the last time a Republican carried the state by a double-digit margin.
Republican victory
Bush won the election in Nevada with a solid 21 point sweep-out landslide. This is one of the final elections where Nevada can be seen as being ubiquitously Republican. The election results in Nevada are generally reflective of a nationwide political reconsolidation of base for the Republican Party, which took place through the 1980s. Through the passage of some very controversial economic programs, spearheaded by then President Ronald Reagan (called, collectively, "Reaganomics"), the mid-to-late 1980s saw a period of economic growth and stability. The hallmark for Reaganomics was, in part, the wide-scale deregulation of corporate interests, and tax cuts for the wealthy.[3]
Dukakis ran on a socially liberal platform, and advocated for higher economic regulation and environmental protection. Bush, alternatively, ran on a campaign of continuing the social and economic policies of former President Reagan - which gained him much support with social conservatives and people living in rural areas. Additionally, while the economic programs passed under Reagan, and furthered under Bush and Clinton, may have boosted the economy for a brief period, they are criticized by many analysts as "setting the stage" for economic troubles in the United State after 2007, such as the Great Recession.[4]
Results
| 1988 United States presidential election in Nevada | |||||
|---|---|---|---|---|---|
| Party | Candidate | Votes | Percentage | Electoral votes | |
| Republican | George H. W. Bush | 206,040 | 58.86% | 4 | |
| Democratic | Michael Dukakis | 132,738 | 37.92% | 0 | |
| "None of These Candidates" | 6,934 | 1.98% | 0 | ||
| Libertarian | Ron Paul | 3,520 | 1.01% | 0 | |
| New Alliance Party | Lenora Fulani | 835 | 0.24% | 0 | |
| Totals | 350,067 | 100.0% | 4 | ||
Results by county
| County or City | George Herbert Walker Bush[5] Republican |
Michael Stanley Dukakis[5] Democratic |
No Candidate[5] Independent |
Ronald Ernest Paul[5] Libertarian |
Leonora Branch Fulani[5] New Alliance |
Margin | Total votes cast | ||||||
|---|---|---|---|---|---|---|---|---|---|---|---|---|---|
| # | % | # | % | # | % | # | % | # | % | # | % | ||
| Churchill | 4,578 | 72.86% | 1,481 | 23.57% | 155 | 2.47% | 49 | 0.78% | 20 | 0.32% | 3,097 | 49.29% | 6,283 |
| Clark | 108,110 | 56.37% | 78,359 | 40.86% | 3,400 | 1.77% | 1,535 | 0.80% | 375 | 0.20% | 29,751 | 15.51% | 191,779 |
| Douglas | 7,074 | 67.02% | 3,107 | 29.44% | 214 | 2.03% | 135 | 1.28% | 25 | 0.24% | 3,967 | 37.58% | 10,555 |
| Elko | 5,722 | 68.35% | 2,310 | 27.59% | 220 | 2.63% | 96 | 1.15% | 24 | 0.29% | 3,412 | 40.75% | 8,372 |
| Esmeralda | 380 | 68.84% | 143 | 25.91% | 16 | 2.90% | 11 | 1.99% | 2 | 0.36% | 237 | 42.93% | 552 |
| Eureka | 413 | 70.96% | 151 | 25.95% | 11 | 1.89% | 7 | 1.20% | 0 | 0.00% | 262 | 45.02% | 582 |
| Humboldt | 2,378 | 66.50% | 1,024 | 28.64% | 87 | 2.43% | 65 | 1.82% | 22 | 0.62% | 1,354 | 37.86% | 3,576 |
| Lander | 1,214 | 70.83% | 439 | 25.61% | 35 | 2.04% | 21 | 1.23% | 5 | 0.29% | 775 | 45.22% | 1,714 |
| Lincoln | 1,035 | 66.18% | 466 | 29.80% | 45 | 2.88% | 9 | 0.58% | 9 | 0.58% | 569 | 36.38% | 1,564 |
| Lyon | 4,390 | 62.83% | 2,301 | 32.93% | 171 | 2.45% | 103 | 1.47% | 22 | 0.31% | 2,089 | 29.90% | 6,987 |
| Mineral | 1,480 | 56.88% | 978 | 37.59% | 101 | 3.88% | 20 | 0.77% | 23 | 0.88% | 502 | 19.29% | 2,602 |
| Nye | 3,619 | 64.59% | 1,748 | 31.20% | 143 | 2.55% | 78 | 1.39% | 15 | 0.27% | 1,871 | 33.39% | 5,603 |
| Pershing | 867 | 62.11% | 458 | 32.81% | 48 | 3.44% | 17 | 1.22% | 6 | 0.43% | 409 | 29.30% | 1,396 |
| Storey | 651 | 56.36% | 432 | 37.40% | 46 | 3.98% | 22 | 1.90% | 4 | 0.35% | 219 | 18.96% | 1,155 |
| Washoe | 52,654 | 59.34% | 32,902 | 37.08% | 1,803 | 2.03% | 1,137 | 1.28% | 232 | 0.26% | 19,752 | 22.26% | 88,728 |
| White Pine | 1,774 | 53.31% | 1,351 | 40.59% | 163 | 4.90% | 20 | 0.60% | 20 | 0.60% | 423 | 12.71% | 3,328 |
| Carson City | 9,701 | 63.44% | 5,088 | 33.27% | 276 | 1.80% | 195 | 1.28% | 31 | 0.20% | 4,613 | 30.17% | 15,291 |
| Totals | 206,040 | 58.86% | 132,738 | 37.92% | 6,934 | 1.98% | 3,520 | 1.01% | 835 | 0.24% | 73,302 | 20.94% | 350,067 |
See also
References
- Sullivan, Robert David; ‘How the Red and Blue Map Evolved Over the Past Century’; America Magazine in The National Catholic Review; June 29, 2016
- "Dave Leip's Atlas of U.S. Presidential Elections". Uselectionatlas.org. Retrieved 2013-07-21.
- "Since 1980s, the Kindest of Tax Cuts for the Rich". The New York Times. 2012-01-18. Retrieved 2013-07-21.
- Jerry Lanson (2008-11-06). "A historic victory. A changed nation. Now, can Obama deliver?". Christian Science Monitor. Retrieved 2013-07-21.
- Our Campaigns; NV US President 1988
