1976 United States presidential election in New Mexico
The 1976 United States presidential election in New Mexico took place on November 2, 1976. All fifty states and The District of Columbia, were part of the 1976 United States presidential election. State voters chose four electors to represent them in the Electoral College, who voted for president and vice president.
| ||||||||||||||||||||||||||
| ||||||||||||||||||||||||||
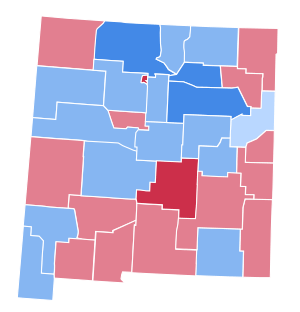 County results Ford: 50–60% 60-70% Carter: 40–50% 50–60% 60–70% | ||||||||||||||||||||||||||
| ||||||||||||||||||||||||||
| Elections in New Mexico | |||||||||
|---|---|---|---|---|---|---|---|---|---|
 | |||||||||
|
|||||||||
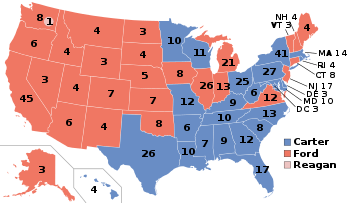
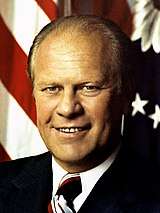
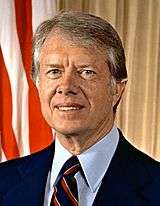
New Mexico was won by President Gerald Ford by a 2-point lead. A very partisan election in New Mexico, only one percent of the electorate voted for third-party candidates.[1] While Ford took the State of New Mexico, and much of the American Southwest and Midwest, Georgia Governor Jimmy Carter won the electoral college with 297 votes, and was elected President.
A reliable bellwether state in presidential elections, this was the first election since gaining statehood that New Mexico did not back the winning presidential candidate. This has only happened in two other presidential elections, 2000 and 2016, thus making this the only instance in which New Mexico has gone to a candidate that lost the overall popular vote. As of the 2016 presidential election, this is the last election in which Torrance County and Quay County voted for a Democratic presidential candidate.[2]
Results
| Presidential candidate | Party | Home state | Popular vote | Electoral vote |
Running mate | |||
|---|---|---|---|---|---|---|---|---|
| Count | Percentage | Vice-presidential candidate | Home state | Electoral vote | ||||
| Gerald Ford | Republican | Michigan | 211,419 | 50.75% | 4 | Bob Dole | Kansas | 4 |
| Jimmy Carter | Democratic | Georgia | 201,148 | 48.28% | 0 | Walter Mondale | Minnesota | 0 |
| Peter Camejo | Socialist Workers | California | 2,462 | 0.59% | 0 | Willie Mae Reid | Illinois | 0 |
| Roger MacBride | Libertarian | Virginia | 1,110 | 0.27% | 0 | David Bergland | California | 0 |
| Frank Zeidler | Socialist | Wisconsin | 240 | 0.06% | 0 | J. Quinn Brisben | Illinois | 0 |
| Benjamin Bubar | Prohibition | Maine | 211 | 0.05% | 0 | Earl Dodge | Colorado | 0 |
| Total | 416,590 | 100% | 4 | 4 | ||||
| Needed to win | 270 | 270 | ||||||
Results by county
| Gerald Rudolph Ford Republican |
James Earl Carter Democratic |
Various candidates Other parties |
Margin | |||||
|---|---|---|---|---|---|---|---|---|
| County | # | % | # | % | # | % | # | % |
| Los Alamos | 5,383 | 64.43% | 2,890 | 34.59% | 82 | 0.98% | 2,493 | 29.84% |
| Lincoln | 2,320 | 61.64% | 1,415 | 37.59% | 29 | 0.77% | 905 | 24.04% |
| Chaves | 10,631 | 59.26% | 7,139 | 39.79% | 170 | 0.95% | 3,492 | 19.46% |
| Harding | 387 | 57.08% | 285 | 42.04% | 6 | 0.88% | 102 | 15.04% |
| Lea | 8,773 | 56.82% | 6,533 | 42.31% | 135 | 0.87% | 2,240 | 14.51% |
| San Juan | 10,852 | 55.13% | 8,615 | 43.77% | 216 | 1.10% | 2,237 | 11.37% |
| Curry | 6,232 | 54.87% | 5,004 | 44.06% | 122 | 1.07% | 1,228 | 10.81% |
| Bernalillo | 76,614 | 53.98% | 63,949 | 45.06% | 1,363 | 0.96% | 12,665 | 8.92% |
| Union | 1,146 | 53.30% | 975 | 45.35% | 29 | 1.35% | 171 | 7.95% |
| Catron | 602 | 53.18% | 517 | 45.67% | 13 | 1.15% | 85 | 7.51% |
| Doña Ana | 13,888 | 53.09% | 12,036 | 46.01% | 233 | 0.89% | 1,852 | 7.08% |
| Otero | 5,914 | 52.10% | 5,333 | 46.98% | 105 | 0.92% | 581 | 5.12% |
| Sierra | 1,665 | 51.04% | 1,564 | 47.95% | 33 | 1.01% | 101 | 3.10% |
| Roosevelt | 3,269 | 50.85% | 3,111 | 48.39% | 49 | 0.76% | 158 | 2.46% |
| Luna | 2,966 | 50.25% | 2,872 | 48.65% | 65 | 1.10% | 94 | 1.59% |
| Quay | 2,059 | 49.08% | 2,095 | 49.94% | 41 | 0.98% | -36 | -0.86% |
| Torrance | 1,462 | 48.54% | 1,526 | 50.66% | 24 | 0.80% | -64 | -2.12% |
| Hidalgo | 891 | 48.56% | 938 | 51.12% | 6 | 0.33% | -47 | -2.56% |
| De Baca | 556 | 47.93% | 597 | 51.47% | 7 | 0.60% | -41 | -3.53% |
| Valencia | 7,851 | 47.43% | 8,566 | 51.75% | 136 | 0.82% | -715 | -4.32% |
| Socorro | 2,265 | 45.86% | 2,606 | 52.76% | 68 | 1.38% | -341 | -6.90% |
| Eddy | 7,698 | 45.59% | 9,073 | 53.73% | 115 | 0.68% | -1,375 | -8.14% |
| Colfax | 2,259 | 45.13% | 2,718 | 54.29% | 29 | 0.58% | -459 | -9.17% |
| Santa Fe | 11,576 | 44.53% | 14,127 | 54.34% | 294 | 1.13% | -2,551 | -9.81% |
| Sandoval | 4,110 | 44.34% | 5,072 | 54.72% | 87 | 0.94% | -962 | -10.38% |
| Grant | 4,095 | 43.90% | 5,176 | 55.49% | 57 | 0.61% | -1,081 | -11.59% |
| Guadalupe | 1,047 | 42.68% | 1,379 | 56.22% | 27 | 1.10% | -332 | -13.53% |
| Taos | 3,012 | 40.07% | 4,414 | 58.72% | 91 | 1.21% | -1,402 | -18.65% |
| McKinley | 4,617 | 39.83% | 6,856 | 59.14% | 120 | 1.04% | -2,239 | -19.31% |
| Mora | 904 | 38.29% | 1,438 | 60.91% | 19 | 0.80% | -534 | -22.62% |
| San Miguel | 3,162 | 37.17% | 5,204 | 61.17% | 141 | 1.66% | -2,042 | -24.00% |
| Rio Arriba | 3,213 | 30.75% | 7,125 | 68.19% | 111 | 1.06% | -3,912 | -37.44% |
References
- "1976 Presidential General Election Results – New Mexico". Dave Leip’s Atlas of U.S. Presidential Elections. Retrieved 2018-02-11.
- Sullivan, Robert David; ‘How the Red and Blue Map Evolved Over the Past Century’; America Magazine in The National Catholic Review; June 29, 2016