1976 United States presidential election in Arkansas
The 1976 United States presidential election in Arkansas took place on November 2, 1976, as part of the wider United States presidential election of 1976. Voters chose six electors to represent them in the Electoral College.
| ||||||||||||||||||||||||||
All 6 Arkansas electoral votes to the Electoral College | ||||||||||||||||||||||||||
|---|---|---|---|---|---|---|---|---|---|---|---|---|---|---|---|---|---|---|---|---|---|---|---|---|---|---|
| ||||||||||||||||||||||||||
 County Results
| ||||||||||||||||||||||||||
| ||||||||||||||||||||||||||
| Elections in Arkansas | ||||||||||
|---|---|---|---|---|---|---|---|---|---|---|
 | ||||||||||
|
||||||||||
|
||||||||||
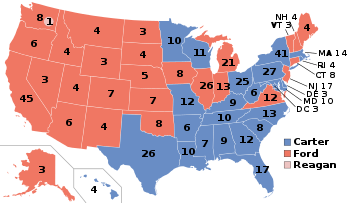
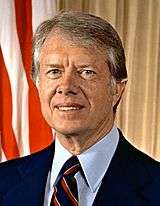
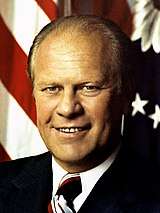
Arkansas overwhelmingly voted for the Democratic Party, former governor of Georgia Jimmy Carter and his running mate Minnesota U.S. Senator Walter Mondale with 64.94% of the vote. The Carter/Mondale ticket defeated Republican incumbent president Gerald Ford of Michigan and his running mate Kansas U.S. Senator Bob Dole in the state by a margin of 30.01%. Arkansas weighed in as more than thirty percent more Democratic than the national average.[1]
Analysis
Politics in Arkansas during this time period were dominated by the Democratic Party. In the last few elections, the party’s influence began to decline due to Southern Democrats having opposed the national party’s support for the Civil Rights Movement in the 1960s, resulting in George Wallace and Richard Nixon carrying the state in 1968 and 1972 respectively. In the aftermath of Watergate and Nixon’s resignation, the nation, including Arkansas’ overall mood towards the Republican Party dropped.
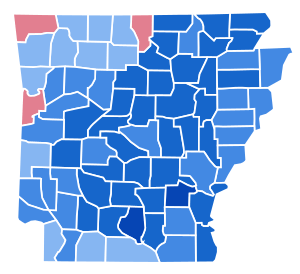
Jimmy Carter, a native Southern and former governor of Georgia, appealed to many Southern Democrats and Arkansas voters who saw him as a Washington outsider. Carter carried Arkansas in a landslide, winning 72 of the state’s 75 counties, the vast majority of which gave him over sixty percent of the vote. Carter’s weakest performance was in the state’s northwestern region, historically the strongest region in the state for Republicans. The following three counties were carried by President Ford: Baxter (Mountain Home), Benton (Bentonville, Rogers), and Sebastian (Fort Smith).
As of the 2016 presidential election, this is the last presidential election that the Democratic candidate won over sixty percent of the vote in Arkansas. The state would become friendlier towards the Republican Party after 1980, the only exceptions to this being 1992 and 1996, when Arkansas native Bill Clinton won the state in both of his presidential runs. This is also the last election in which Searcy County and Crawford County voted for the Democratic candidate.[2]
Results
| United States presidential election in Arkansas, 1976[1] | |||||
|---|---|---|---|---|---|
| Party | Candidate | Votes | Percentage | Electoral votes | |
| Democratic | Jimmy Carter | 499,614 | 64.94% | 6 | |
| Republican | Gerald Ford | 268,753 | 34.93% | 0 | |
| Write-ins | Eugene McCarthy | 647 | 0.08% | 0 | |
| Write-ins | Thomas J. Anderson | 382 | 0.05% | 0 | |
| Totals | 769,396 | 100.00% | 6 | ||
| Voter turnout (Voting age/Registered voters) | 51%/75% | ||||
Results by county
| County | James Earl Carter
Democratic |
Gerald Rudolph Ford
Republican |
Write-ins | Total votes cast | |||
|---|---|---|---|---|---|---|---|
| # | % | # | % | # | % | ||
| Arkansas | 5,640 | 69.46% | 2,480 | 30.54% | 8,120 | ||
| Ashley | 5,253 | 62.88% | 3,092 | 37.01% | 9 | 0.11% | 8,354 |
| Baxter | 5,766 | 49.49% | 5,885 | 50.51% | 11,651 | ||
| Benton | 11,289 | 47.00% | 12,670 | 52.75% | 61 | 0.25% | 24,020 |
| Boone | 5,388 | 57.64% | 3,959 | 42.36% | 9,347 | ||
| Bradley | 3,567 | 75.88% | 1,134 | 24.12% | 4,701 | ||
| Calhoun | 2,014 | 80.11% | 495 | 19.69% | 5 | 0.20% | 2,514 |
| Carroll | 3,791 | 57.01% | 2,804 | 42.17% | 55 | 0.83% | 6,650 |
| Chicot | 3,868 | 70.39% | 1,621 | 29.50% | 6 | 0.11% | 5,495 |
| Clark | 6,641 | 78.32% | 1,816 | 21.42% | 22 | 0.26% | 8,479 |
| Clay | 5,664 | 74.95% | 1,893 | 25.05% | 7,557 | ||
| Cleburne | 5,726 | 74.07% | 1,992 | 25.77% | 13 | 0.17% | 7,731 |
| Cleveland | 2,320 | 78.22% | 646 | 21.78% | 2,966 | ||
| Columbia | 4,708 | 52.31% | 4,287 | 47.63% | 6 | 0.07% | 9,001 |
| Conway | 6,443 | 74.67% | 2,177 | 25.23% | 9 | 0.10% | 8,629 |
| Craighead | 13,840 | 69.02% | 6,213 | 30.98% | 20,053 | ||
| Crawford | 5,946 | 55.52% | 4,764 | 44.48% | 10,710 | ||
| Crittenden | 8,249 | 61.26% | 5,202 | 38.63% | 14 | 0.10% | 13,465 |
| Cross | 4,198 | 68.40% | 1,909 | 31.11% | 30 | 0.49% | 6,137 |
| Dallas | 3,266 | 76.20% | 1,012 | 23.61% | 8 | 0.19% | 4,286 |
| Desha | 4,228 | 75.50% | 1,372 | 24.50% | 5,600 | ||
| Drew | 3,750 | 68.43% | 1,730 | 31.57% | 5,480 | ||
| Faulkner | 11,423 | 74.45% | 3,904 | 25.44% | 16 | 0.10% | 15,343 |
| Franklin | 3,703 | 65.24% | 1,973 | 34.76% | 5,676 | ||
| Fulton | 2,670 | 71.87% | 1,038 | 27.94% | 7 | 0.19% | 3,715 |
| Garland | 15,707 | 60.02% | 10,394 | 39.72% | 69 | 0.26% | 26,170 |
| Grant | 3,797 | 78.39% | 1,047 | 21.61% | 4,844 | ||
| Greene | 7,495 | 73.54% | 2,690 | 26.39% | 7 | 0.07% | 10,192 |
| Hempstead | 5,397 | 65.37% | 2,859 | 34.63% | 8,256 | ||
| Hot Spring | 7,809 | 78.12% | 2,187 | 21.88% | 9,996 | ||
| Howard | 3,207 | 67.06% | 1,575 | 32.94% | 4,782 | ||
| Independence | 7,116 | 71.17% | 2,878 | 28.79% | 4 | 0.04% | 9,998 |
| Izard | 3,328 | 70.48% | 1,394 | 29.52% | 4,722 | ||
| Jackson | 6,456 | 78.36% | 1,783 | 21.64% | 8,239 | ||
| Jefferson | 21,001 | 72.33% | 8,034 | 27.67% | 29,035 | ||
| Johnson | 5,044 | 69.89% | 2,173 | 30.11% | 7,217 | ||
| Lafayette | 2,342 | 61.49% | 1,467 | 38.51% | 3,809 | ||
| Lawrence | 5,167 | 75.08% | 1,708 | 24.82% | 7 | 0.10% | 6,882 |
| Lee | 3,463 | 68.74% | 1,574 | 31.24% | 1 | 0.02% | 5,038 |
| Lincoln | 3,045 | 81.33% | 699 | 18.67% | 3,744 | ||
| Little River | 3,142 | 68.71% | 1,431 | 31.29% | 4,573 | ||
| Logan | 5,313 | 64.06% | 2,909 | 35.07% | 72 | 0.87% | 8,294 |
| Lonoke | 7,761 | 75.36% | 2,522 | 24.49% | 16 | 0.16% | 10,299 |
| Madison | 2,926 | 53.91% | 2,502 | 46.09% | 5,428 | ||
| Marion | 2,979 | 59.30% | 2,045 | 40.70% | 5,024 | ||
| Miller | 6,648 | 58.58% | 4,679 | 41.23% | 22 | 0.19% | 11,349 |
| Mississippi | 10,292 | 63.03% | 6,009 | 36.80% | 27 | 0.17% | 16,328 |
| Monroe | 3,556 | 73.35% | 1,285 | 26.51% | 7 | 0.14% | 4,848 |
| Montgomery | 2,420 | 72.37% | 924 | 27.63% | 3,344 | ||
| Nevada | 3,101 | 72.64% | 1,163 | 27.24% | 5 | 0.12% | 4,269 |
| Newton | 1,840 | 53.32% | 1,611 | 46.68% | 3,451 | ||
| Ouachita | 8,946 | 76.47% | 2,753 | 23.53% | 11,699 | ||
| Perry | 2,310 | 73.52% | 832 | 26.48% | 3,142 | ||
| Phillips | 7,774 | 69.93% | 3,342 | 30.06% | 1 | 0.01% | 11,117 |
| Pike | 2,822 | 69.40% | 1,234 | 30.35% | 10 | 0.25% | 4,066 |
| Poinsett | 6,835 | 71.45% | 2,726 | 28.50% | 5 | 0.05% | 9,566 |
| Polk | 3,505 | 58.75% | 2,432 | 40.76% | 29 | 0.49% | 5,966 |
| Pope | 8,355 | 65.62% | 4,348 | 34.15% | 29 | 0.23% | 12,732 |
| Prairie | 2,836 | 77.72% | 813 | 22.28% | 3,649 | ||
| Pulaski | 63,541 | 62.62% | 37,690 | 37.14% | 244 | 0.24% | 101,475 |
| Randolph | 4,551 | 74.34% | 1,571 | 25.66% | 6,122 | ||
| St. Francis | 6,851 | 65.12% | 3,639 | 34.59% | 30 | 0.29% | 10,520 |
| Saline | 12,008 | 74.41% | 4,123 | 25.55% | 7 | 0.04% | 16,138 |
| Scott | 2,880 | 66.79% | 1,427 | 33.09% | 5 | 0.12% | 4,312 |
| Searcy | 3,180 | 54.09% | 2,699 | 45.91% | 5,879 | ||
| Sebastian | 15,768 | 47.11% | 17,671 | 52.79% | 34 | 0.10% | 33,473 |
| Sevier | 3,391 | 69.53% | 1,468 | 30.10% | 18 | 0.37% | 4,877 |
| Sharp | 3,532 | 62.15% | 2,151 | 37.85% | 5,683 | ||
| Stone | 2,718 | 72.54% | 1,014 | 27.06% | 15 | 0.40% | 3,747 |
| Union | 8,257 | 51.03% | 7,918 | 48.93% | 7 | 0.04% | 16,182 |
| Van Buren | 4,004 | 71.14% | 1,624 | 28.86% | 5,628 | ||
| Washington | 15,610 | 52.32% | 14,132 | 47.37% | 92 | 0.31% | 29,834 |
| White | 11,412 | 70.58% | 4,756 | 29.42% | 16,168 | ||
| Woodruff | 3,040 | 78.09% | 848 | 21.78% | 5 | 0.13% | 3,893 |
| Yell | 5,785 | 74.96% | 1,932 | 25.04% | 7,717 | ||
| Totals | 499,614 | 64.94% | 268,753 | 34.93% | 1,029 | 0.13% | 769,396 |
References
- Dave Leip’s U.S. Election Atlas; 1976 Presidential General Election Results – Arkansas
- Sullivan, Robert David; ‘How the Red and Blue Map Evolved Over the Past Century’; America Magazine in The National Catholic Review; June 29, 2016