Richmond upon Thames London Borough Council election, 2014
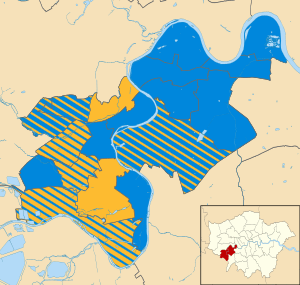
Map of the results of the 2014 Richmond upon Thames Council election. Conservatives in blue and Liberal Democrats in yellow.
Elections for Richmond upon Thames Borough Council were held on 22 May 2014. Elections to the European Parliament took place on the same day.
In London council elections the entire council is elected every four years.
Summary of results
| Party | Seats | Gains | Losses | Net gain/loss | Seats % | Votes % | Votes | +/− | |
|---|---|---|---|---|---|---|---|---|---|
| Conservative | 39 | 11 | 1 | +10 | 72.2 | 45.0 | 80,180 | +3.3 | |
| Liberal Democrat | 15 | 1 | 10 | -9 | 27.8 | 31.8 | 56,689 | -8.4 | |
| Labour | 0 | 0 | 0 | 0 | 12.5 | 22,298 | +3.1 | ||
| Green | 0 | 0 | 0 | 0 | 6.0 | 10,685 | +0.3 | ||
| UKIP | 0 | 0 | 1 | -1 | 3.9 | 6,930 | +3.7 | ||
| Independent | 0 | 0.9 | 1,599 | ||||||
Ward Results
Barnes
| Party | Candidate | Votes | % | ± | |
|---|---|---|---|---|---|
| Conservative | Rita Palmer | 1852 | 20.67 | ||
| Conservative | Paul Hodgins | 1,844 | 20.58 | ||
| Conservative | Christine Percival | 1,840 | 20.54 | ||
| Liberal Democrat | Merlene Emerson | 654 | 7.3 | ||
| Liberal Democrat | Carolyn Rampton | 617 | 6.89 | ||
| Liberal Democrat | John Howell | 574 | 6.41 | ||
| Green | Matthew Ridley | 484 | 5.4 | ||
| Labour | Frank Cooper | 406 | 4.53 | ||
| Labour | Su Patel | 373 | 4.16 | ||
| Labour | David Graystone | 315 | 3.52 | ||
East Sheen
| Party | Candidate | Votes | % | ± | |
|---|---|---|---|---|---|
| Conservative | Nicholas True | 2159 | 21.27 | ||
| Conservative | Brian Anthony Marcel | 2128 | 20.96 | ||
| Conservative | Robert Thompson | 1995 | 19.65 | ||
| Liberal Democrat | Timothy Catchpole | 790 | 7.78 | ||
| Liberal Democrat | Nicola Macbean | 725 | 7.14 | ||
| Liberal Democrat | Helena Lang | 586 | 5.77 | ||
| Green | Simon Hegarty | 561 | 5.53 | ||
| Labour | David Miles | 410 | 4.04 | ||
| Labour | Elisabeth Turner-Morris | 404 | 3.98 | ||
| Labour | Mike Freedman | 393 | 3.87 | ||
Fulwell & Hampton Hill
| Party | Candidate | Votes | % | ± | |
|---|---|---|---|---|---|
| Liberal Democrat | Jonathan Cardy | 1328 | 13.36 | ||
| Liberal Democrat | Jerry Elloy | 1282 | 12.9 | ||
| Conservative | Mark Boyle | 1260 | 12.68 | ||
| Conservative | Joe Broughton | 1171 | 11.78 | ||
| Liberal Democrat | Dan Sear | 1142 | 11.49 | ||
| Conservative | Dabbie Hollis | 1119 | 11.26 | ||
| Green | Monica Saunders | 555 | 5.59 | ||
| Green | Sally Gray | 481 | 4.84 | ||
| Labour | Sandra Roberts | 439 | 4.42 | ||
| Green | Daniel Dollin | 411 | 4.14 | ||
| Labour | Graham Nixon | 383 | 3.85 | ||
| Labour | Jenifer Wyatt | 366 | 3.68 | ||
Ham, Petersham & Richmond Riverside
| Party | Candidate | Votes | % | ± | |
|---|---|---|---|---|---|
| Liberal Democrat | Penelope Frost | 1341 | 13.23 | ||
| Conservative | Jean Loveland | 1319 | 13.01 | ||
| Conservative | Sarah Tippet | 1316 | 12.98 | ||
| Liberal Democrat | David Williams | 1299 | 12.81 | ||
| Liberal Democrat | Brian Miller | 1266 | 12.49 | ||
| Conservative | Seamus Joyce | 1208 | 11.92 | ||
| Green | Andrée Frieze | 420 | 4.14 | ||
| Labour | Sandra Keen | 401 | 3.96 | ||
| UKIP | David Sparrow | 342 | 3.37 | ||
| Labour | Chris Fawcett | 326 | 3.22 | ||
| UKIP | Sam Naz | 316 | 3.12 | ||
| UKIP | Teresa Vanneck-Surplice | 300 | 2.96 | ||
| Labour | Laura Rollin | 284 | 2.8 | ||
Hampton
| Party | Candidate | Votes | % | ± | |
|---|---|---|---|---|---|
| Liberal Democrat | Gareth Roberts | 1578 | 15.38 | ||
| Liberal Democrat | Suzette Nicholson | 1570 | 15.3 | ||
| Conservative | Petra Sale | 1341 | 13.07 | ||
| Conservative | Mark Davies | 1244 | 12.12 | ||
| Liberal Democrat | Nuriyeh Popalzi | 1241 | 12.09 | ||
| Conservative | Nathaniel Ikeazor | 1157 | 11.27 | ||
| Green | Felix Wood | 519 | 5.06 | ||
| UKIP | Alex Corner | 512 | 4.99 | ||
| Labour | Margaret Mills | 394 | 3.84 | ||
| Labour | Donald Makepeace | 387 | 3.77 | ||
| Labour | Howard Roberts | 319 | 3.11 | ||
Hampton North
| Party | Candidate | Votes | % | ± | |
|---|---|---|---|---|---|
| Conservative | Geoffrey Samuel | 1390 | 15.87 | ||
| Conservative | Kate Howard | 1313 | 14.99 | ||
| Conservative | Martin Seymour | 1280 | 14.61 | ||
| Liberal Democrat | Ellen Day | 756 | 8.63 | ||
| Liberal Democrat | Darren Thornton | 700 | 7.99 | ||
| Liberal Democrat | Avril Coelho | 686 | 7.83 | ||
| UKIP | Michael Mackie | 416 | 4.75 | ||
| UKIP | Michael Maloney | 397 | 4.53 | ||
| UKIP | Paul Rodwell | 396 | 4.52 | ||
| Labour | Louisa Spawls | 379 | 4.33 | ||
| Labour | Jane Butters | 372 | 4.25 | ||
| Green | Catherine von Ruhland | 342 | 3.9 | ||
| Labour | John Thrower | 334 | 3.81 | ||
Hampton Wick
| Party | Candidate | Votes | % | ± | |
|---|---|---|---|---|---|
| Conservative | Tony Arbour | 1870 | 20.12 | ||
| Conservative | Tania Mathias | 1708 | 18.38 | ||
| Conservative | Gareth Evans | 1586 | 17.07 | ||
| Green | Michael Bangham | 696 | 7.49 | ||
| Liberal Democrat | James Chard | 676 | 7.28 | ||
| Liberal Democrat | Chris Gee | 647 | 6.96 | ||
| Liberal Democrat | Mark Goodrich | 593 | 6.38 | ||
| Labour | Caroline Loewenstein | 522 | 5.62 | ||
| Labour | Gerard Ward | 520 | 5.6 | ||
| Labour | Sheila Nixon | 474 | 5.1 | ||
Heathfield
| Party | Candidate | Votes | % | ± | |
|---|---|---|---|---|---|
| Liberal Democrat | John Coombs | 1147 | 12.34 | ||
| Conservative | Alan Butler | 1126 | 12.12 | ||
| Conservative | Annie Hambridge | 1088 | 11.71 | ||
| Liberal Democrat | Rosy Cobb | 1019 | 10.97 | ||
| Liberal Democrat | Michael Wilson | 935 | 10.06 | ||
| Conservative | Saba Shaukat | 933 | 10.04 | ||
| Labour | Rhonda Evans | 755 | 8.12 | ||
| Labour | Robert Newbery | 717 | 7.72 | ||
| UKIP | Andrew Christie | 653 | 7.03 | ||
| Labour | Craig Owen | 609 | 6.55 | ||
| Green | Stephen Smith | 311 | 3.35 | ||
Kew
| Party | Candidate | Votes | % | ± | |
|---|---|---|---|---|---|
| Conservative | Meena Bond | 2101 | 17.49 | ||
| Conservative | David Linnette | 1983 | 16.51 | ||
| Conservative | Monica Horner | 1902 | 15.84 | ||
| Liberal Democrat | J-F Burford | 1601 | 13.33 | ||
| Liberal Democrat | Catrine Mogilner | 1404 | 11.69 | ||
| Liberal Democrat | Leon Sosnowski | 1223 | 10.18 | ||
| Green | Andrew Webster | 552 | 4.6 | ||
| Labour | Gareth James | 348 | 2.9 | ||
| Labour | Pamela Leons-Marder | 338 | 2.81 | ||
| Labour | Tony Eades | 337 | 2.81 | ||
| Independent | Jane Harrison | 221 | 1.84 | ||
Mortlake & Barnes Common
| Party | Candidate | Votes | % | ± | |
|---|---|---|---|---|---|
| Conservative | Gemma Curran | 1844 | 17.61 | ||
| Conservative | Paul Avon | 1809 | 17.28 | ||
| Conservative | Richard Martin | 1630 | 15.57 | ||
| Liberal Democrat | Michael Dingemans | 907 | 8.66 | ||
| Liberal Democrat | Hong Ling Dyer | 856 | 8.17 | ||
| Liberal Democrat | Anton McNulty-Howard | 665 | 6.35 | ||
| Green | James Page | 500 | 4.78 | ||
| Independent | Simon Danciger | 454 | 4.34 | ||
| Green | Steph Aldridge | 436 | 4.16 | ||
| Labour | Leonard Griffiths | 386 | 3.69 | ||
| Labour | Ayar Ata | 383 | 3.66 | ||
| Labour | Derek Somers | 326 | 3.11 | ||
| Green | Anthony Breslin | 275 | 2.63 | ||
North Richmond
| Party | Candidate | Votes | % | ± | |
|---|---|---|---|---|---|
| Conservative | Lisa Blakemore | 1632 | 16.09 | ||
| Conservative | Margaret Butler | 1593 | 15.71 | ||
| Conservative | Stephen Speak | 1515 | 14.94 | ||
| Liberal Democrat | Emily Ward | 1086 | 10.71 | ||
| Liberal Democrat | Rosina Robson | 1080 | 10.65 | ||
| Liberal Democrat | Richard Pyne | 1057 | 10.42 | ||
| Green | Tanya Williams | 484 | 4.77 | ||
| Labour | Barnaby Marder | 386 | 3.81 | ||
| Labour | Pamela Risner | 383 | 3.78 | ||
| Labour | Anthony Jaimongal | 380 | 3.75 | ||
| UKIP | Raymond Perrin | 295 | 2.91 | ||
| UKIP | Jack Sosnierz | 250 | 2.47 | ||
South Richmond
| Party | Candidate | Votes | % | ± | |
|---|---|---|---|---|---|
| Conservative | Pamela Fleming | 1866 | 19.95 | ||
| Conservative | Peter Buckwell | 1793 | 19.17 | ||
| Conservative | Thomas O'Malley | 1665 | 17.8 | ||
| Liberal Democrat | Serena Hennessy | 788 | 8.43 | ||
| Liberal Democrat | Susan Lloyd | 684 | 7.31 | ||
| Liberal Democrat | Andrew Pilkington | 581 | 6.21 | ||
| Green | Elizabeth Nash | 564 | 6.03 | ||
| Labour | Brian Caton | 408 | 4.36 | ||
| Labour | Matthew Horrocks | 400 | 4.28 | ||
| Labour | Sachin Patel | 321 | 3.43 | ||
| UKIP | Robert Leon | 283 | 3.03 | ||
South Twickenham
| Party | Candidate | Votes | % | ± | |
|---|---|---|---|---|---|
| Conservative | Clare Head | 1621 | 17.19 | ||
| Conservative | David Porter | 1551 | 16.45 | ||
| Conservative | David Marlow | 1480 | 15.69 | ||
| Liberal Democrat | Dawny Christien | 918 | 9.73 | ||
| Liberal Democrat | Michael Butlin | 914 | 9.69 | ||
| Liberal Democrat | York Membery | 767 | 8.13 | ||
| Green | Diana Locke | 652 | 6.91 | ||
| Labour | James Carpenter | 521 | 5.52 | ||
| Labour | Beatriz McGawn Lees | 504 | 5.34 | ||
| Labour | Stephen Guichard | 502 | 5.32 | ||
St Margarets & North Twickenham
| Party | Candidate | Votes | % | ± | |
|---|---|---|---|---|---|
| Liberal Democrat | Geoff Acton | 1729 | 15.86 | ||
| Liberal Democrat | Ben Khosa | 1564 | 14.34 | ||
| Liberal Democrat | Alexander Ehmann | 1469 | 13.47 | ||
| Conservative | Suzanne Healy | 1413 | 12.96 | ||
| Conservative | Chris Harrison | 1384 | 12.69 | ||
| Conservative | Luke Parker | 1165 | 10.68 | ||
| Green | Jack Munro | 637 | 5.84 | ||
| Labour | Penelope Banaji | 466 | 4.27 | ||
| Labour | Anthony Nieper | 409 | 3.75 | ||
| UKIP | Martyn Ferguson-Jones | 353 | 3.24 | ||
| Labour | Derek tutchell | 316 | 2.9 | ||
Teddington
| Party | Candidate | Votes | % | ± | |
|---|---|---|---|---|---|
| Liberal Democrat | Jennifer Churchill | 1587 | 14.78 | ||
| Liberal Democrat | Martin Elengorn | 1514 | 14.1 | ||
| Liberal Democrat | Stephen Knight | 1497 | 13.94 | ||
| Conservative | Elizabeth Foster | 1447 | 13.47 | ||
| Conservative | Jon Hollis | 1356 | 12.62 | ||
| Conservative | Simon Lamb | 1296 | 12.07 | ||
| Green | Mark Sanders-Barwick | 512 | 4.77 | ||
| Labour | Cheryl Ould | 425 | 3.96 | ||
| Labour | Michelle Sims | 414 | 3.85 | ||
| Labour | Eva Tutchell | 385 | 3.58 | ||
| UKIP | Dominic Stockford | 308 | 2.87 | ||
Twickenham Riverside
| Party | Candidate | Votes | % | ± | |
|---|---|---|---|---|---|
| Conservative | Susan Chappell | 1485 | 15.1 | ||
| Conservative | Benedict Dias | 1293 | 13.15 | ||
| Conservative | Helen Hill | 1267 | 12.88 | ||
| Liberal Democrat | Susan Burningham | 1187 | 12.07 | ||
| Liberal Democrat | Sue Howes | 1142 | 11.61 | ||
| Liberal Democrat | Roger Crouch | 1027 | 10.44 | ||
| Green | Anne Page | 544 | 5.53 | ||
| Labour | Deborah Lane | 378 | 3.84 | ||
| Labour | Adam Gladstone | 375 | 3.81 | ||
| Labour | David Harley | 355 | 3.61 | ||
| UKIP | Scott Naylor | 293 | 2.98 | ||
| UKIP | Sarah Meagher | 254 | 2.58 | ||
| UKIP | Barry Edwards | 235 | 2.39 | ||
West Twickenham
| Party | Candidate | Votes | % | ± | |
|---|---|---|---|---|---|
| Liberal Democrat | Piers Allen | 1249 | 13.31 | ||
| Liberal Democrat | Helen Lee Parsons | 1209 | 12.88 | ||
| Conservative | Jane Boulton | 1133 | 12.07 | ||
| Conservative | Reuben Fevrier | 1105 | 12.07 | ||
| Liberal Democrat | Lesley Pollesche | 1030 | 10.97 | ||
| Conservative | Graham Woolnough | 966 | 10.29 | ||
| Labour | Neil Browning | 520 | 5.54 | ||
| Green | Lisa Howard | 482 | 5.14 | ||
| Labour | Paul Tanto | 474 | 5.05 | ||
| Labour | Peter McCabe | 446 | 4.75 | ||
| UKIP | Richard Lailey | 405 | 4.31 | ||
| UKIP | Jamie Moodie | 367 | 3.91 | ||
Whitton
| Party | Candidate | Votes | % | ± | |
|---|---|---|---|---|---|
| Conservative | Gareth Elliott | 1427 | 15.32 | ||
| Conservative | Grant Healy | 1129 | 12.12 | ||
| Liberal Democrat | Liz Jaeger | 1104 | 11.85 | ||
| Conservative | Marc Hope | 1082 | 11.85 | ||
| Liberal Democrat | Alan Juriansz | 902 | 9.68 | ||
| Liberal Democrat | Steven Topol | 796 | 8.54 | ||
| UKIP | Douglas Orchard | 555 | 5.96 | ||
| Independent | Paul Hampartsoumian | 469 | 5.03 | ||
| Independent | Neil Wilton | 455 | 4.88 | ||
| Labour | Alan Barber | 425 | 4.56 | ||
| Labour | Stephen Batey | 390 | 4.19 | ||
| Labour | Sampson Low | 315 | 3.38 | ||
| Green | Rustam Majainah | 267 | 2.87 | ||
References
- ↑ "Election results by party". Local Election – Thursday, 22 May 2014. London Borough of Richmond upon Thames. 23 May 2014. Retrieved 23 May 2014.
| Mayor of London | |
|---|---|
| London Assembly | |
| Inner London Education Authority | |
| Greater London Council | |
| London County Council | |
| Borough Councils | |
| Referendums | |
| |
This article is issued from
Wikipedia.
The text is licensed under Creative Commons - Attribution - Sharealike.
Additional terms may apply for the media files.