Manchester City Council election, 2014
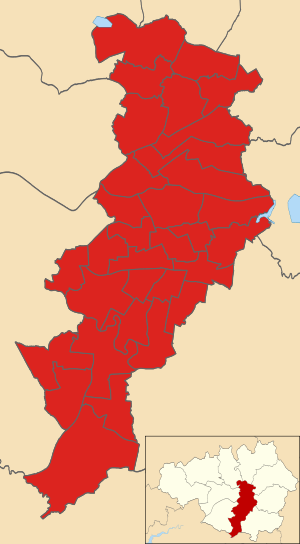
Map of the results of the 2014 Manchester council election, with Labour
Elections to Manchester City Council will be held on 22 May 2014,[1] on the same day as the 2014 United Kingdom local elections and the United Kingdom component of the 2014 European Parliament election. One-third of the council is up for election, with each successful candidate to serve a four-year term of office, expiring in 2018. Due to this 'in thirds' format, direct comparison with results has to be made to the 2010 poll.
Ward results
Ancoats and Clayton
| Party | Candidate | Votes | % | ± | |
|---|---|---|---|---|---|
| Labour | Donna Ludford* | 1,700 | 49.49 | -5.31 | |
| UKIP | Josie Loftus | 538 | 15.66 | N/A | |
| Liberal | Ken Dobson | 383 | 11.15 | N/A | |
| Green | Larissa Claire Hansford | 315 | 9.17 | +1.37 | |
| Conservative | Beverley Atkins | 230 | 6.70 | -6.40 | |
| Pirate | Loz Kaye | 129 | 3.20 | N/A | |
| Liberal Democrat | Chris Lovell | 110 | 3.20 | -21.20 | |
| TUSC | Alex Davidson | 30 | 0.87 | N/A | |
| Majority | 1,162 | 33.8 | |||
| Turnout | 3,435 | 25.37 | |||
| Labour hold | Swing | ||||
Ardwick
| Party | Candidate | Votes | % | ± | |
|---|---|---|---|---|---|
| Labour | Mavis Smitheman | 2,163 | 72.41 | +14.11 | |
| Green | Harriet Pugh | 348 | 11.65 | +5.55 | |
| TUSC | Alexander Dunbar | 207 | 6.93 | N/A | |
| Liberal Democrat | Mumina Yeasmin Tahir | 152 | 5.09 | -20.01 | |
| Conservative | Joey Ferrigno | 117 | 3.92 | -6.58 | |
| Majority | 1,815 | 60.8 | |||
| Turnout | 2,987 | 23 | |||
| Labour hold | Swing | ||||
Baguley
| Party | Candidate | Votes | % | ± | |
|---|---|---|---|---|---|
| Labour Co-op | Tracy Rawlins* | 1,544 | 58.60 | +11.50 | |
| UKIP | Ian George Fleming | 602 | 22.85 | +16.05 | |
| Conservative | Stephen Paul Woods | 247 | 9.37 | -6.83 | |
| Green | Frank Clements | 116 | 4.40 | +1.60 | |
| TUSC | Lynn Worthington | 64 | 2.43 | N/A | |
| Liberal Democrat | Rhona Eva Elizabeth Brown | 62 | 2.35 | -22.15 | |
| Majority | 942 | 35.7 | |||
| Turnout | 2,635 | 23.47 | |||
| Labour hold | Swing | ||||
Bradford
| Party | Candidate | Votes | % | ± | |
|---|---|---|---|---|---|
| Labour | John Longsden | 2,215 | 70.74 | +6.84 | |
| Green | George Czernuszka | 367 | 11.72 | +7.02 | |
| Conservative | Saira Khanum | 296 | 9.45 | -1.85 | |
| Liberal Democrat | Simon Mitchell | 195 | 6.23 | -13.77 | |
| Christian Democrat Party for a Consensus | Jonathan Cox | 58 | 1.85 | N/A | |
| Majority | 1,848 | 59 | |||
| Turnout | 3,131 | 25.7 | |||
| Labour hold | Swing | ||||
Brooklands
| Party | Candidate | Votes | % | ± | |
|---|---|---|---|---|---|
| Labour Co-op | Sue Murphy | 1,464 | 49.38 | +3.18 | |
| UKIP | Anne Spoor | 734 | 24.76 | +19.56 | |
| Conservative | Ralph John Ellerton | 507 | 17.10 | -9.80 | |
| Green | Eithne Quinn | 159 | 5.36 | +2.46 | |
| Liberal Democrat | Joel Moorcroft | 101 | 3.41 | -15.19 | |
| Majority | 730 | 24.6 | |||
| Turnout | 2,965 | 27.38 | |||
| Labour hold | Swing | ||||
Burnage
| Party | Candidate | Votes | % | ± | |
|---|---|---|---|---|---|
| Labour | Azra Ali | 2,055 | 55.65 | +13.25 | |
| Green | Sam Darby | 685 | 18.55 | +14.55 | |
| Liberal Democrat | Ronan Stafford | 684 | 18.52 | -26.88 | |
| Conservative | Josh Lelliot | 269 | 7.28 | +2.4 | |
| Majority | 1,370 | 37.10 | |||
| Turnout | 3,693 | 33.76 | |||
| Labour gain from Liberal Democrat | Swing | ||||
Charlestown
| Party | Candidate | Votes | % | ± | |
|---|---|---|---|---|---|
| Labour | Veronica Kirkpatrick | 1,741 | 54.65 | +0.05 | |
| UKIP | Neil Griffiths | 1,030 | 32.33 | N/A | |
| Conservative | Will Stobart | 203 | 14.5 | -8.13 | |
| Liberal Democrat | Martina Anne Dunican | 65 | 2.04 | -10.96 | |
| Majority | 711 | 23.4 | |||
| Turnout | 3,039 | 30.45 | |||
| Labour hold | Swing | ||||
Cheetham
| Party | Candidate | Votes | % | ± | |
|---|---|---|---|---|---|
| Labour | Naeem Ul Hassan | 3,734 | 79.62 | +25.82 | |
| Green | Alex Ian Blythe | 530 | 11.30 | N/A | |
| Conservative | Stuart Andrew McKenna | 426 | 9.08 | -13.22 | |
| Majority | 3,204 | 68.3 | |||
| Turnout | 4,690 | 30.5 | |||
| Labour hold | Swing | ||||
Chorlton
| Party | Candidate | Votes | % | ± | |
|---|---|---|---|---|---|
| Labour Co-op | John Hacking | 2,675 | 54.98 | +16.18 | |
| Green | Jake Welsh | 1,002 | 20.60 | +9.90 | |
| Liberal Democrat | Peter James Maxon | 739 | 15.19 | -28.41 | |
| Conservative | Zachery Husseini | 286 | 5.88 | -0.92 | |
| TUSC | Mark Bradley Krantz | 163 | 3.35 | N/A | |
| Majority | 1,673 | 34.4 | |||
| Turnout | 4,865 | 44.34 | |||
| Labour gain from Liberal Democrat | Swing | ||||
Chorlton Park
| Party | Candidate | Votes | % | ± | |
|---|---|---|---|---|---|
| Labour Co-op | Mandie Shilton-Goodwin | 1,991 | 43.41 | +11.01 | |
| Liberal Democrat | Norman Lewis | 1,691 | 36.87 | -16.43 | |
| Green | Brian Candeland | 648 | 14.13 | +7.63 | |
| Conservative | Stuart Richardson | 256 | 5.58 | 2.22 | |
| Majority | 300 | 6.5 | |||
| Turnout | 4,586 | 39.14 | |||
| Labour gain from Liberal Democrat | Swing | ||||
City Centre
| Party | Candidate | Votes | % | ± | |
|---|---|---|---|---|---|
| Labour Co-op | Beth Knowles | 1,149 | 48.46 | +16.96 | |
| Green | Rachel Carr | 511 | 21.55 | +15.25 | |
| Conservative | Nicholas Savage | 442 | 18.64 | =2.96 | |
| Liberal Democrat | John Richard Bridges | 269 | 11.35 | -29.25 | |
| Majority | 638 | 26.9 | |||
| Turnout | 2,371 | 17.2 | |||
| Labour gain from Liberal Democrat | Swing | ||||
Crumpsall
| Party | Candidate | Votes | % | ± | |
|---|---|---|---|---|---|
| Labour | Jon-Leigh Pritchard | 2,524 | 66.70 | +8.80 | |
| UKIP | Bob Willescroft | 588 | 15.54 | +8.34 | |
| Conservative | Sham Raja Akhtar | 392 | 10.36 | -6.44 | |
| Green | Anne Vivienne Power | 208 | 5.50 | N/A | |
| Liberal Democrat | Charles William Turner | 72 | 1.90 | -10.30 | |
| Majority | 1,936 | 51.2 | |||
| Turnout | 3,784 | 32.82 | |||
| Labour hold | Swing | ||||
Didsbury East
| Party | Candidate | Votes | % | ± | |
|---|---|---|---|---|---|
| Labour | James Wilson | 1,968 | 43.18 | +6.78 | |
| Liberal Democrat | Dominic Hardwick | 1,375 | 30.17 | -16.53 | |
| Green | Lucy Jane Bannister | 405 | 8.89 | +3.09 | |
| Conservative | Rob Manning | 403 | 8.84 | -2.36 | |
| UKIP | Mark Falcon Davies | 369 | 8.10 | N/A | |
| TUSC | Sam Gleadon | 38 | 0.83 | N/A | |
| Majority | 593 | 13.0 | |||
| Turnout | 4,558 | 41.6 | |||
| Labour gain from Liberal Democrat | Swing | ||||
Didsbury West
| Party | Candidate | Votes | % | ± | |
|---|---|---|---|---|---|
| Labour | Josie Teubler | 1,457 | 46.27 | +14.12 | |
| Liberal Democrat | Mark Clayton | 1,295 | 41.12 | -9.07 | |
| Green | Glen Marsden | 592 | 15.82 | N/A | |
| Conservative | David Robert Semple | 397 | 12.61 | -5.05 | |
| Majority | 162 | 4.33 | |||
| Turnout | 3,741 | 36 | |||
| Labour gain from Liberal Democrat | Swing | ||||
Fallowfield
| Party | Candidate | Votes | % | ± | |
|---|---|---|---|---|---|
| Labour | Mike Amesbury | 2,181 | 61.56 | +30.57 | |
| Green | Catrin Louise Brock | 780 | 22.02 | +17.11 | |
| Conservative | Jack Murray | 362 | 10.22 | -1.44 | |
| Liberal Democrat | Dave Page | 140 | 3.95 | -29.13 | |
| TUSC | Zoe Frances Brunswick | 80 | 2.26 | N/A | |
| Majority | 1,401 | 39.5 | |||
| Turnout | 3,543 | 30.62 | |||
| Labour hold | Swing | ||||
Gorton North
| Party | Candidate | Votes | % | ± | |
|---|---|---|---|---|---|
| Labour | Nilofar Siddiqi | 2,016 | 62.09 | ||
| Green | Karl Wardlaw | 516 | 15.89 | ||
| Liberal Democrat | Andrew Peter Hickey | 428 | 13.18 | ||
| Conservative | John Wadsworth-Ladkin | 287 | 8.84 | ||
| Majority | 1,500 | 46.2 | |||
| Turnout | 3,247 | 28.16 | |||
| Labour hold | Swing | ||||
Gorton South
| Party | Candidate | Votes | % | ± | |
|---|---|---|---|---|---|
| Labour | Julie Reid | 2,548 | 60.44 | ||
| UKIP | Bob Catterall | 787 | 18.67 | ||
| Liberal Democrat | Charles Leslie Glover | 375 | 8.89 | ||
| Green | Martin Burke | 369 | 8.75 | ||
| Conservative | Tmo Opesan | 137 | 3.25 | ||
| Majority | 1,761 | 41.8 | |||
| Turnout | 4,216 | 31.74 | |||
| Labour hold | Swing | ||||
Harpurhey
| Party | Candidate | Votes | % | ± | |
|---|---|---|---|---|---|
| Labour | Sandra Collins | 2,174 | 68.56 | ||
| Green | Mildred Willner | 552 | 17.41 | ||
| Conservative | Tom Clarke | 341 | 10.75 | ||
| Liberal Democrat | Bernadette Ryan | 104 | 3.28 | ||
| Majority | 1,622 | 51.2 | |||
| Turnout | 3,171 | 25.3 | |||
| Labour hold | Swing | ||||
Higher Blackley
Councillor Anna Trotman stood down for family reasons and was replaced in February 2018 by Paula Sadler, also of Labour in a by-election.[3]
| Party | Candidate | Votes | % | ± | |
|---|---|---|---|---|---|
| Labour | Anna Margaret Trotman | 1,737 | 54.76 | ||
| UKIP | Martin Power | 1,046 | 32.98 | N/A | |
| Conservative | Alexandru Stelian Stancu | 194 | 6.12 | ||
| Green | James Sheppard | 142 | 4.48 | N/A | |
| Liberal Democrat | Maria Theresa Turner | 53 | 1.67 | ||
| Majority | 691 | 21.8 | |||
| Turnout | 3,172 | 34.58 | |||
| Labour hold | Swing | ||||
Hulme
| Party | Candidate | Votes | % | ± | |
|---|---|---|---|---|---|
| Labour | Nigel Joseph Murphy | 1,731 | 57.70 | ||
| Green | Deyika Nzeribe | 706 | 23.53 | ||
| UKIP | Phil Eckersley | 189 | 6.30 | ||
| Conservative | Harry Williams | 182 | 6.07 | ||
| Liberal Democrat | Richard Gadsen | 152 | 5.07 | ||
| TUSC | Conor Daniel Price | 40 | .1.33 | ||
| Majority | 1,025 | 34.2 | |||
| Turnout | 3,000 | 35 | |||
| Labour hold | Swing | ||||
Levenshulme
| Party | Candidate | Votes | % | ± | |
|---|---|---|---|---|---|
| Labour | Dzidra Noor | 1,885 | 43.83 | ||
| Liberal Democrat | James Hennigan | 1,551 | 36.06 | ||
| Green | Dick Venes | 718 | 16.69 | ||
| Conservative | Shaden Jaradat | 147 | 3.42 | ||
| Majority | 334 | 7.8 | |||
| Turnout | 4,301 | 38.4 | |||
| Labour gain from Liberal Democrat | Swing | ||||
Longsight
| Party | Candidate | Votes | % | ± | |
|---|---|---|---|---|---|
| Labour | Suzanne Richards | 2,888 | 70.77 | ||
| Conservative | Mohammed Afzal | 433 | 10.61 | ||
| Green | Ryan John Bestford | 376 | 9.21 | ||
| Liberal Democrat | Liaqat Ali | 275 | 6.74 | ||
| Independent | Mohammad Raisahmad Khan | 109 | 2.67 | ||
| Majority | 2,455 | 60.2 | |||
| Turnout | 4,081 | 36 | |||
| Labour hold | Swing | ||||
Miles Platting and Newton Heath
| Party | Candidate | Votes | % | ± | |
|---|---|---|---|---|---|
| Labour | John Flanagan | 1,826 | 65.24 | ||
| BNP | Gareth Black | 397 | 14.18 | ||
| Green | Jake Lay | 242 | 8.65 | ||
| Conservative | Benjamin John Michael Thacker | 190 | 6.79 | ||
| Liberal Democrat | Grace Baynham | 144 | 5.14 | ||
| Majority | 1,429 | 51.1 | |||
| Turnout | 2,799 | 25.82 | |||
| Labour hold | Swing | ||||
Moss Side
| Party | Candidate | Votes | % | ± | |
|---|---|---|---|---|---|
| Labour | Emily Rowles | 2,811 | 65.75 | ||
| Independent | Muhammad Anwar Shahzad | 648 | 15.16 | ||
| Green | Clifford Fleming | 463 | 10.83 | ||
| Conservative | Eleanor Hughes | 143 | 3.35 | ||
| Respect | Colette Claire Williams | 108 | 2.53 | ||
| Liberal Democrat | Lynne Williams | 102 | 2.39 | ||
| Majority | 2,163 | 50.6 | |||
| Turnout | 4,275 | 31 | |||
| Labour hold | Swing | ||||
Moston
| Party | Candidate | Votes | % | ± | |
|---|---|---|---|---|---|
| Labour | Yasmine Dar | 1,543 | 42.55 | ||
| UKIP | Nigel F. Houston | 1,406 | 38.78 | ||
| Conservative | Daniel Kallmunzer | 321 | 8.85 | ||
| Green | Luke James Smith | 203 | 5.60 | ||
| BNP | Stephen Carden | 153 | 4.22 | ||
| Majority | 137 | 3.8 | |||
| Turnout | 3,626 | 31.38 | |||
| Labour hold | Swing | ||||
Northenden
| Party | Candidate | Votes | % | ± | |
|---|---|---|---|---|---|
| Labour | Sarah Russell | 1,842 | 57.96 | ||
| Liberal Democrat | Mary Eileen Di Mauro | 514 | 16.17 | ||
| Conservative | Fiona Mary Green | 471 | 14.82 | ||
| Green | Simon Edge | 351 | 11.04 | ||
| Majority | 1,328 | 41.8 | |||
| Turnout | 3,178 | 28.03 | |||
| Labour gain from Liberal Democrat | Swing | ||||
Old Moat
| Party | Candidate | Votes | % | ± | |
|---|---|---|---|---|---|
| Labour | Suzannah Mary Reeves | 1,924 | 56.91 | ||
| Green | Joel Smith | 699 | 20.67 | ||
| Liberal Democrat | Christopher Kane | 365 | 10.80 | ||
| Conservative | Peter Schofield | 253 | 7.48 | ||
| TUSC | Jane Lee | 107 | 3.16 | ||
| Motorcycle Alliance | James Gordon Torrance | 33 | 0.98 | ||
| Majority | 1,225 | 36.2 | |||
| Turnout | 3,381 | 29.6 | |||
| Labour hold | Swing | ||||
Rusholme
| Party | Candidate | Votes | % | ± | |
|---|---|---|---|---|---|
| Labour | Rabnawaz Akbar | 2,438 | 69.72 | ||
| Green | Joseph Ian Clough | 517 | 14.78 | ||
| Liberal Democrat | Abu Mohiuddin Chowdhury | 261 | 7.46 | ||
| Conservative | Georgina Elizabeth Calle | 191 | 5.46 | ||
| TUSC | John William McFarlane | 90 | 2.57 | ||
| Majority | 1,921 | 54.9 | |||
| Turnout | 3,497 | 32.3 | |||
| Labour hold | Swing | ||||
Sharston
| Party | Candidate | Votes | % | ± | |
|---|---|---|---|---|---|
| Labour | Madeleine Monaghan | 1,450 | 31.53 | ||
| Labour | Hugh Barrett | 1,406 | 30.57 | ||
| UKIP | Bob Burke | 848 | 18.44 | ||
| Conservative | David Morgan | 307 | 6.68 | ||
| Green | Alison Jane Hunt | 216 | 4.70 | ||
| Liberal Democrat | John Frazer Yorke-Davenport | 142 | 3.09 | ||
| Respect | Catherine Higgins | 141 | 3.07 | ||
| Liberal Democrat | Robert Summerill | 89 | 1.94 | ||
| Majority | |||||
| Turnout | 4,599 | 23.3 | |||
| Labour hold | Swing | ||||
Whalley Range
| Party | Candidate | Votes | % | ± | |
|---|---|---|---|---|---|
| Labour | Mary Rose Watson | 2,959 | 64.31 | ||
| Green | Mary Candeland | 883 | 19.19 | ||
| Liberal Democrat | John Grant | 475 | 10.32 | ||
| Conservative | Shahed Hossain | 284 | 6.17 | ||
| Majority | 2,076 | 45.1 | |||
| Turnout | 4,601 | 39.43 | |||
| Labour hold | Swing | ||||
Withington
| Party | Candidate | Votes | % | ± | |
|---|---|---|---|---|---|
| Labour | Rebecca Moore | 1,386 | 40.75 | ||
| Liberal Democrat | Simon David Wheale* | 1,098 | 32.28 | ||
| Green | Laura Bannister | 657 | 19.32 | ||
| Conservative | Peter Jacques Werner | 194 | 5.70 | ||
| TUSC | Liam David Curless | 66 | 1.94 | ||
| Majority | 288 | 8.5 | |||
| Turnout | 3,401 | 30.34 | |||
| Labour gain from Liberal Democrat | Swing | ||||
Woodhouse Park
| Party | Candidate | Votes | % | ± | |
|---|---|---|---|---|---|
| Labour | Edward Newman | 1,486 | 61.79 | ||
| UKIP | Tony Welch | 563 | 23.41 | ||
| Conservative | Stephen James McHugh | 177 | 7.36 | ||
| Green | May Molteno | 123 | 5.11 | ||
| Liberal Democrat | Colin Anthony Bannister | 56 | 2.33 | ||
| Majority | 923 | 38.4 | |||
| Turnout | 2,405 | 22.86 | |||
| Labour hold | Swing | ||||
References
- ↑ Statements of Persons Nominated Archived 6 June 2014 at the Wayback Machine. Manchester City Council
- 1 2 3 4 5 6 7 8 9 10 11 12 13 14 15 16 17 18 19 20 21 22 23 24 25 26 27 28 29 30 31 32 "Local Election Results 2014". Manchester City Council. Retrieved 29 April 2017.
- ↑ Fitzgerald, Todd (19 February 2018). "Labour's Paula Sadler wins Higher Blackley by-election". Manchester Evening News. Retrieved 22 February 2018.
| Mayor | |
|---|---|
| Bolton | |
| Bury | |
| Manchester | |
| Oldham | |
| Rochdale | |
| Salford | |
| Stockport | |
| Tameside | |
| Trafford | |
| Wigan | |
| County Council |
|
| |
Full list of results on the Manchester City Council website, here:
This article is issued from
Wikipedia.
The text is licensed under Creative Commons - Attribution - Sharealike.
Additional terms may apply for the media files.