Havering London Borough Council election, 2014
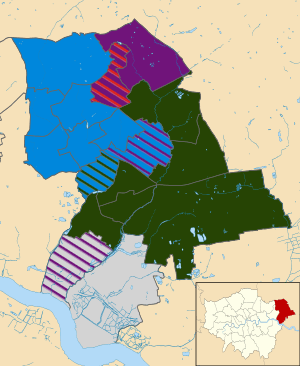
Map of the results of the 2014 Havering council election. Conservatives in blue, Havering Residents Association in dark green, Labour in red, Rainham & Wennington Independent Residents Group in grey and UKIP in purple.
The 2014 Havering Council election took place on 22 May 2014 to elect members of Havering Council in England.[1] This was on the same day as other local elections. The Conservative Party ceased to have a majority of councillors, putting the council in no overall control (NOC). Despite the various residents associations winning the most seats, an agreement was not struck and a Conservative Party minority administration was formed.
Summary of results
All 5 major UK political parties, in addition to any parties gaining ~1% of the vote or above, are shown:
| Party | Seats | Gains | Losses | Net gain/loss | Seats % | Votes % | Votes | +/− | |
|---|---|---|---|---|---|---|---|---|---|
| Conservative | 22 | -11 | 40.7 | 27.7 | 60063 | -70780 | |||
| Havering Residents Association | 19 | +7 | 35.2 | 26.9 | 58381 | -32722 | |||
| UKIP | 7 | 7 | 0 | +7 | 13.0 | 19.9 | 43040 | ||
| Independent Residents | 5 | +1 | 9.3 | 4.7 | 10185 | +3293 | |||
| Labour | 1 | -4 | 1.9 | 16.9 | 36671 | -28259 | |||
| Green | 0 | 0 | 0 | 0 | 0 | 1.7 | 3601 | ||
| Liberal Democrat | 0 | 0 | 0 | 0 | 0 | 0.9 | 1989 | -6997 | |
| Independent | 0 | 0 | 0 | 0 | 0 | 0.8 | 1722 | ||
Ward Summaries
Brooklands
| Party | Candidate | Votes | % | ± | |
|---|---|---|---|---|---|
| Conservative | Robert Benham | 1,758 | 34.7% | -13.0% | |
| Conservative | Vidyotama Persaud | 1,620 | |||
| Conservative | Roger Westwood | 1,545 | |||
| UKIP | Neil Connelly | 1,469 | 29.0% | N/A | |
| UKIP | Herbert Humphries | 1,413 | |||
| UKIP | Frederick Osborne | 1,413 | |||
| Labour | Eamonn Mahon | 1,147 | 22.7% | -8.3% | |
| Labour | Samuel Gould | 1,121 | |||
| Labour | Herbert White | 1,019 | |||
| RA | Derek Smith | 273 | 5.3% | N/A | |
| Independent | Gaggandip Sandhu-Nelson | 245 | 4.8% | N/A | |
| Liberal Democrat | Karen Kruzycka | 171 | 3.4% | -17.8% | |
| Conservative hold | Swing | ||||
| Conservative hold | Swing | ||||
| Conservative hold | Swing | ||||
Cranham
| Party | Candidate | Votes | % | ± | |
|---|---|---|---|---|---|
| RA | June Alexander | 3,243 | 55.7% | +3.6% | |
| RA | Gillian Ford | 3,159 | |||
| RA | Clarence Barrett | 3,090 | |||
| UKIP | Mark O'Neill | 1,014 | 17.4% | +11.4% | |
| Conservative | Pamela Freer | 857 | 14.7% | -13.2% | |
| Labour | Lisa Hitchin | 1,413 | 6.2% | -1.8% | |
| Labour | Patrick Chalk | 353 | |||
| Green | Peter Caton | 343 | 5.9% | +0.7% | |
| Labour | John Mckernan | 338 | |||
| RA hold | Swing | ||||
| RA hold | Swing | ||||
| RA hold | Swing | ||||
References
- ↑ "England council results". BBC News. Retrieved 23 May 2014.
- ↑ "Havering". Havering Council. Retrieved 9 August 2014.
| Mayor of London | |
|---|---|
| London Assembly | |
| Inner London Education Authority | |
| Greater London Council | |
| London County Council | |
| Borough Councils | |
| Referendums | |
| |
This article is issued from
Wikipedia.
The text is licensed under Creative Commons - Attribution - Sharealike.
Additional terms may apply for the media files.