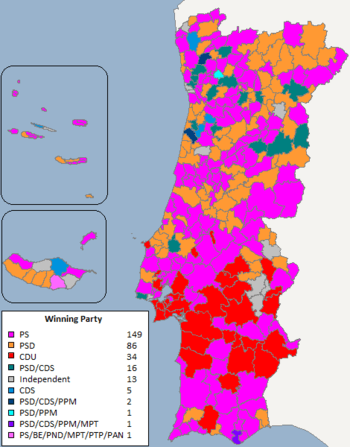
Results breakdown of the Portuguese local elections, 2013 (Municipal Councils)
This is the results breakdown of the Portuguese local elections, 2013 for the Municipal Councils held on 29 September 2013. The following tables show detailed results in each of the country's 18 districts and 2 autonomous regions and a table with the detailed results from the most populous cities in the country.
National summary of votes and seats
| Parties | Votes | % | ±pp swing | Candidacies | Councillors | Mayors | ||||
|---|---|---|---|---|---|---|---|---|---|---|
| # | ± | # | ± | |||||||
| Socialist | 1,812,029 | 36.26 | 303 | 923 | 149 | |||||
| Social Democratic | 834,455 | 16.70 | 201 | 531 | 86 | |||||
| Democratic Unity Coalition | 552,690 | 11.06 | 288 | 213 | 34 | |||||
| Social Democratic / People's Party | 379,110 | 7.59 | 73 | 154 | 16 | |||||
| Independents | 344,531 | 6.89 | 94 | 112 | 13 | |||||
| People's | 152,073 | 3.04 | 143 | 47 | 5 | |||||
| Left Bloc | 120,982 | 2.42 | 109 | 8 | 0 | |||||
| PSD / CDS–PP / MPT | 100,437 | 2.01 | 6 | 11 | 0 | |||||
| PSD / CDS–PP / PPM | 94,015 | 1.88 | 4 | 21 | 2 | |||||
| PSD / PPM | 65,102 | 1.30 | — | 7 | 21 | — | 1 | — | ||
| PSD / PPM / MPT | 43,312 | 0.87 | — | 7 | 7 | — | 0 | — | ||
| PSD/ CDS–PP / MPT / PPM | 23,551 | 0.47 | 4 | 14 | 1 | |||||
| Portuguese Workers' Communist | 23,276 | 0.47 | 27 | 0 | 0 | |||||
| PS / BE / PND / MPT / PTP / PAN | 21,102 | 0.42 | — | 1 | 5 | — | 1 | — | ||
| PSD / MPT / PPM | 19,804 | 0.40 | — | 4 | 4 | — | 0 | — | ||
| Party for Animals and Nature | 16,233 | 0.32 | — | 8 | 0 | — | 0 | — | ||
| CDS–PP / MPT / PPM | 9,299 | 0.19 | — | 7 | 1 | — | 0 | — | ||
| PSD/ CDS–PP / PPM / MPT | 8,918 | 0.18 | 4 | 4 | 0 | |||||
| Portuguese Labour Party | 8,552 | 0.17 | — | 22 | 0 | — | 0 | — | ||
| Earth | 6,660 | 0.13 | 8 | 2 | 0 | |||||
| People's Party / Social Democratic | 4,656 | 0.09 | — | 4 | 4 | — | 0 | — | ||
| PPM / PND / PPV | 3,634 | 0.07 | — | 1 | 0 | — | 0 | — | ||
| National Renovator | 3,002 | 0.06 | 6 | 0 | 0 | |||||
| People's Party / Earth Party | 2,931 | 0.06 | 3 | 0 | 0 | |||||
| PS / PTP / PND / BE | 2,157 | 0.04 | — | 1 | 1 | — | 0 | — | ||
| Social Democratic / Earth Party | 1,897 | 0.04 | — | 2 | 3 | — | 0 | — | ||
| New Democracy | 1,272 | 0.03 | 1 | 0 | 0 | |||||
| PPM / PPV | 856 | 0.02 | — | 1 | 0 | — | 0 | — | ||
| People's Monarchist | 455 | 0.01 | 1 | 0 | 0 | |||||
| Portugal Pro-Life | 338 | 0.01 | — | 1 | 0 | — | 0 | — | ||
| Total valid | 4,657,329 | 93.18 | — | 2,086 | 308 | |||||
| Blank ballots | 193,471 | 3.87 | ||||||||
| Invalid ballots | 147,205 | 2.95 | ||||||||
| Total (turnout 52.60%) | 4,998,005 | 100.00 | ||||||||
| Source: Autárquicas 2013 Resultados Oficiais | ||||||||||
Results by District
Aveiro
| Parties | Votes | % | ±pp swing | Candidacies | Councillors | Mayors | ||||
|---|---|---|---|---|---|---|---|---|---|---|
| # | ± | # | ± | |||||||
| Socialist | 119,007 | 33.48 | 19 | 53 | 5 | |||||
| Social Democratic | 114,943 | 32.34 | 15 | 56 | 9 | |||||
| People's | 30,216 | 8.50 | 15 | 13 | 2 | |||||
| PSD / CDS–PP / PPM | 16,694 | 4.70 | — | 4 | 5 | — | 1 | — | ||
| Democratic Unity Coalition | 14,503 | 4.08 | 19 | 0 | 0 | |||||
| Social Democratic / People's Party | 12,152 | 3.42 | 2 | 6 | 1 | |||||
| Independents | 11,835 | 3.33 | 4 | 5 | 1 | |||||
| Left Bloc | 7,982 | 2.25 | 10 | 0 | 0 | |||||
| PSD/ CDS–PP / MPT / PPM | 3,475 | 0.98 | — | 1 | 3 | — | 0 | — | ||
| Portuguese Workers' Communist | 235 | 0.07 | — | 1 | 0 | — | 0 | — | ||
| National Renovator | 123 | 0.03 | — | 1 | 0 | — | 0 | — | ||
| Total valid | 319,031 | 93.16 | — | 141 | 19 | |||||
| Blank ballots | 14,778 | 4.16 | ||||||||
| Invalid ballots | 9,527 | 2.68 | ||||||||
| Total (turnout 54.18%) | 343,483 | 100.00 | ||||||||
| Source: Autárquicas 2013 Resultados Oficiais | ||||||||||
Beja
In Beja, despite gaining votes overall, the PS lost two mayorships to the CDU; Cuba, and the district's capital, Beja.
| Parties | Votes | % | ±pp swing | Candidacies | Councillors | Mayors | ||||
|---|---|---|---|---|---|---|---|---|---|---|
| # | ± | # | ± | |||||||
| Socialist | 36,702 | 44.50 | 14 | 39 | 6 | |||||
| Democratic Unity Coalition | 31,855 | 38.63 | 14 | 34 | 8 | |||||
| Social Democratic / People's Party | 5,257 | 6.37 | 11 | 2 | 0 | |||||
| Independents | 2,465 | 2.99 | 3 | 2 | 0 | |||||
| Social Democratic | 1,746 | 2.12 | 2 | 1 | 0 | |||||
| Left Bloc | 704 | 0.85 | 3 | 0 | 0 | |||||
| Total valid | 78,729 | 95.46 | — | 78 | 14 | |||||
| Blank ballots | 2,134 | 2.59 | ||||||||
| Invalid ballots | 1,607 | 1.95 | ||||||||
| Total (turnout 62.35%) | 82,545 | 100.00 | ||||||||
| Source: Autárquicas 2013 Resultados Oficiais | ||||||||||
Braga
In Braga, the PS gained the mayorship in Amares (from an Independent) and Barcelos (from a PSD/CDS-PP/PPM joint list), but lost two other mayorships, in Vieira do Minho and the capital city of Braga (to a PSD/CDS-PP joint list in Viera do Minho and a PSD/CDS-PP/PPM joint list in Braga.)
| Parties | Votes | % | ±pp swing | Candidacies | Councillors | Mayors | ||||
|---|---|---|---|---|---|---|---|---|---|---|
| # | ± | # | ± | |||||||
| Socialist | 190,815 | 38.76 | 14 | 49 | 7 | |||||
| PSD / CDS–PP / PPM | 70,632 | 14.35 | 2 | 10 | 1 | |||||
| Social Democratic / People's Party | 60,578 | 12.31 | 5 | 19 | 2 | |||||
| Social Democratic | 46,473 | 9.44 | 5 | 20 | 4 | |||||
| Independents | 32,025 | 6.51 | 6 | 9 | 0 | |||||
| PSD / CDS–PP / MPT | 31,174 | 6.33 | — | 1 | 4 | — | 0 | — | ||
| Democratic Unity Colaition | 24,563 | 4.99 | 14 | 2 | 0 | |||||
| Left Bloc | 4,937 | 1.00 | 5 | 0 | 0 | |||||
| People's | 4,926 | 1.00 | 5 | 1 | 0 | |||||
| Portuguese Workers' Communist | 2,381 | 0.48 | — | 3 | 0 | — | 0 | — | ||
| PPM / PPV | 856 | 0.17 | — | 1 | 0 | — | 0 | — | ||
| Earth | 299 | 0.06 | 1 | 0 | 0 | |||||
| Total valid | 469,659 | 95.4 | — | 114 | 14 | |||||
| Blank ballots | 14,377 | 2.92 | ||||||||
| Invalid ballots | 8,267 | 1.68 | ||||||||
| Total (turnout 62.61%) | 492,650 | 100.00 | ||||||||
| Source: Autárquicas 2013 Resultados Oficiais | ||||||||||
Bragança
Bragança was one of the few districts where the PS had a net loss in mayorships, losing the mayorships in Freixo de Espada à Cinta and Torre de Moncorvo, but also gaining the mayorship in Mogadouro.
| Parties | Votes | % | ±pp swing | Candidacies | Councillors | Mayors | ||||
|---|---|---|---|---|---|---|---|---|---|---|
| # | ± | # | ± | |||||||
| Socialist | 33,727 | 37.23 | 12 | 31 | 5 | |||||
| Social Democratic | 32,477 | 35.85 | 8 | 26 | 6 | |||||
| Social Democratic / People's Party | 6,350 | 7.01 | 3 | 7 | 1 | |||||
| People's | 5,225 | 5.77 | 6 | 3 | 0 | |||||
| Independents | 3,308 | 3.65 | 1 | 1 | 0 | |||||
| People's Party / Social Democratic | 2,426 | 2.68 | — | 1 | 2 | — | 0 | — | ||
| Democratic Unity Coalition | 1,824 | 2.01 | 12 | 0 | 0 | |||||
| Left Bloc | 442 | 0.49 | 3 | 0 | 0 | |||||
| CDS–PP / MPT / PPM | 92 | 0.10 | — | 1 | 0 | — | 0 | — | ||
| Total valid | 85,871 | 94.78 | — | 70 | 12 | |||||
| Blank ballots | 2,403 | 2.65 | ||||||||
| Invalid ballots | 2,327 | 2.57 | ||||||||
| Total (turnout 60.14%) | 90,827 | 100.00 | ||||||||
| Source: Autárquicas 2013 Resultados Oficiais | ||||||||||
Castelo Branco
| Parties | Votes | % | ±pp swing | Candidacies | Councillors | Mayors | ||||
|---|---|---|---|---|---|---|---|---|---|---|
| # | ± | # | ± | |||||||
| Socialist | 47,590 | 44.33 | 10 | 35 | 7 | |||||
| Social Democratic | 29,351 | 27.34 | 9 | 22 | 4 | |||||
| Independents | 11,182 | 10.41 | — | 4 | 5 | — | 0 | — | ||
| Democratic Unity Coalition | 6,836 | 6.37 | 11 | 1 | 0 | |||||
| People's | 2,528 | 2.35 | 8 | 0 | 0 | |||||
| Left Bloc | 1,163 | 1.08 | 2 | 0 | 0 | |||||
| Social Democratic / Earth Party | 1,142 | 1.06 | — | 1 | 2 | — | 0 | — | ||
| Portuguese Labour Party | 331 | 0.31 | — | 1 | 0 | — | 0 | — | ||
| Total valid | 100,123 | 93.26 | — | 65 | 11 | |||||
| Blank ballots | 4,028 | 3.75 | ||||||||
| Invalid ballots | 3,215 | 2.99 | ||||||||
| Total (turnout 57.98%) | 107,486 | 100.00 | ||||||||
| Source: Autárquicas 2013 Resultados Oficiais | ||||||||||
Coimbra
| Parties | Votes | % | ±pp swing | Candidacies | Councillors | Mayors | ||||
|---|---|---|---|---|---|---|---|---|---|---|
| # | ± | # | ± | |||||||
| Socialist | 89,884 | 42.24 | 17 | 61 | 12 | |||||
| Social Democratic | 28,362 | 13.33 | 7 | 26 | 5 | |||||
| PSD / PPM / MPT | 18,946 | 8.90 | — | 1 | 4 | — | 0 | — | ||
| Democratic Unity Coalition | 15,970 | 7.51 | 17 | 3 | 0 | |||||
| Social Democratic / People's Party | 13,966 | 6.56 | 5 | 12 | 0 | |||||
| PSD/ CDS–PP / PPM / MPT | 8,918 | 4.19 | — | 4 | 4 | — | 0 | — | ||
| Independents | 8,766 | 4.12 | 4 | 4 | 0 | |||||
| PSD / CDS–PP / PPM | 3,960 | 1.86 | 1 | 3 | 0 | |||||
| People's | 3,767 | 1.77 | 8 | 0 | 0 | |||||
| Left Bloc | 2,260 | 1.06 | 5 | 0 | 0 | |||||
| Party for Animals and Nature | 925 | 0.43 | — | 1 | 0 | — | 0 | — | ||
| Portuguese Workers' Communist | 838 | 0.39 | — | 2 | 0 | — | 0 | — | ||
| Earth | 555 | 0.26 | — | 1 | 0 | — | 0 | — | ||
| Total valid | 197,117 | 92.64 | — | 117 | 17 | |||||
| Blank ballots | 9,777 | 4.60 | ||||||||
| Invalid ballots | 5,877 | 2.95 | ||||||||
| Total (turnout 53.86%) | 212,926 | 100.00 | ||||||||
| Source: Autárquicas 2013 Resultados Oficiais | ||||||||||
Évora
The CDU won one of its most important victories in Évora,[3] recapturing the district's capital city, and historic CDU stronghold, of Évora. The CDU had held the city from 1979-1997, when it was captured by the Socialists. CDU General Secretary Jerónimo de Sousa flew into Évora to celebrate with the city's incoming mayor, Carlos Pinto de Sá, on election night.
| Parties | Votes | % | ±pp swing | Candidacies | Councillors | Mayors | ||||
|---|---|---|---|---|---|---|---|---|---|---|
| # | ± | # | ± | |||||||
| Democratic Unity Coalition | 32,153 | 38.50 | 14 | 30 | 6 | |||||
| Socialist | 27,767 | 33.25 | 14 | 31 | 5 | |||||
| Independents | 9,217 | 11.04 | 7 | 12 | 3 | |||||
| Social Democratic / People's Party | 5,384 | 6.45 | 4 | 3 | 0 | |||||
| Social Democratic | 2,922 | 3.50 | 7 | 2 | 0 | |||||
| Left Bloc | 991 | 1.19 | 2 | 0 | 0 | |||||
| People's | 550 | 0.66 | 3 | 0 | 0 | |||||
| People's Party / Social Democratic | 340 | 0.41 | — | 2 | 0 | — | 0 | — | ||
| Total valid | 79,324 | 94.99 | — | 78 | 14 | |||||
| Blank ballots | 2,573 | 3.08 | ||||||||
| Invalid ballots | 1,615 | 1.93 | ||||||||
| Total (turnout 58.05%) | 83,581 | 100.00 | ||||||||
| Source: Autárquicas 2013 Resultados Oficiais | ||||||||||
Faro
In Faro there was a massive upswing in support for the CDU, including having the only mayorship, Silves, that swung directly from the PSD to the CDU.
| Parties | Votes | % | ±pp swing | Candidacies | Councillors | Mayors | ||||
|---|---|---|---|---|---|---|---|---|---|---|
| # | ± | # | ± | |||||||
| Socialist | 65,434 | 36.71 | 16 | 51 | 10 | |||||
| Social Democratic | 44,208 | 24.08 | 14 | 33 | 4 | |||||
| Democratic Unity Coalition | 20,919 | 11.74 | 16 | 8 | 1 | |||||
| PSD/ CDS–PP / MPT / PPM | 12,823 | 7.19 | 2 | 7 | 1 | |||||
| Left Bloc | 7,707 | 4.32 | 9 | 2 | 0 | |||||
| Independents | 6,534 | 3.67 | 7 | 2 | 0 | |||||
| CDS–PP / MPT / PPM | 4,082 | 2.29 | — | 2 | 1 | — | 0 | — | ||
| People's | 1,272 | 0.71 | 5 | 0 | 0 | |||||
| People's Party / Earth Party | 730 | 0.41 | — | 1 | 0 | — | 0 | — | ||
| Portuguese Workers' Communist | 364 | 0.20 | 1 | 0 | 0 | |||||
| Portugal Pro-Life | 338 | 0.19 | — | 1 | 0 | — | 0 | — | ||
| Total valid | 164,602 | 92.71 | — | 104 | 16 | |||||
| Blank ballots | 8,318 | 4.67 | ||||||||
| Invalid ballots | 5,325 | 2.99 | ||||||||
| Total (turnout 47.57%) | 178,312 | 100.00 | ||||||||
| Source: Autárquicas 2013 Resultados Oficiais | ||||||||||
Guarda
| Parties | Votes | % | ±pp swing | Candidacies | Councillors | Mayors | ||||
|---|---|---|---|---|---|---|---|---|---|---|
| # | ± | # | ± | |||||||
| Socialist | 41,150 | 39.72 | 13 | 36 | 6 | |||||
| Social Democratic / People's Party | 25,993 | 25.09 | 5 | 16 | 3 | |||||
| Social Democratic | 19,937 | 19.24 | 9 | 25 | 4 | |||||
| Democratic Unity Coalition | 3,262 | 3.15 | 14 | 0 | 0 | |||||
| People's | 2,441 | 2.36 | 6 | 2 | 0 | |||||
| Independents | 2,231 | 2.15 | 3 | 3 | 1 | |||||
| Left Bloc | 871 | 0.84 | 1 | 0 | 0 | |||||
| Portuguese Workers' Communist | 576 | 0.56 | 1 | 0 | 0 | |||||
| People's Monarchist | 455 | 0.44 | — | 1 | 0 | — | 0 | — | ||
| Portuguese Labour Party | 279 | 0.27 | — | 2 | 0 | — | 0 | — | ||
| Total valid | 97,195 | 93.82 | — | 82 | 14 | |||||
| Blank ballots | 3,263 | 3.15 | ||||||||
| Invalid ballots | 3,144 | 3.03 | ||||||||
| Total (turnout 61.74%) | 103,844 | 100.00 | ||||||||
| Source: Autárquicas 2013 Resultados Oficiais | ||||||||||
Leiria
| Parties | Votes | % | ±pp swing | Candidacies | Councillors | Mayors | ||||
|---|---|---|---|---|---|---|---|---|---|---|
| # | ± | # | ± | |||||||
| Social Democratic | 75,989 | 35.56 | 16 | 50 | 9 | |||||
| Socialist | 71,804 | 33.60 | 16 | 43 | 6 | |||||
| Democratic Unity Coalition | 18,537 | 8.67 | 16 | 7 | 1 | |||||
| People's | 14,849 | 6.95 | 15 | 5 | 0 | |||||
| Independents | 7,131 | 3.34 | 6 | 4 | 0 | |||||
| Left Bloc | 3,830 | 1.79 | 6 | 0 | 0 | |||||
| Earth | 430 | 0.20 | — | 1 | 0 | — | 0 | — | ||
| National Renovator | 219 | 0.10 | — | 1 | 0 | — | 0 | — | ||
| Total valid | 192,789 | 90.22 | — | 109 | 16 | |||||
| Blank ballots | 12,649 | 5.92 | ||||||||
| Invalid ballots | 8,249 | 3.86 | ||||||||
| Total (turnout 50.39%) | 213,797 | 100.00 | ||||||||
| Source: Autárquicas 2013 Resultados Oficiais | ||||||||||
Lisbon
The PS and CDU both won key victories in Lisbon. The PS retained the district (and national) capital of Lisbon, with the best result ever achieved by any political party in Lisbon,[4] and the CDU recaptured their historical stronghold of Loures from the PS.
| Parties | Votes | % | ±pp swing | Candidacies | Councillors | Mayors | ||||
|---|---|---|---|---|---|---|---|---|---|---|
| # | ± | # | ± | |||||||
| Socialist | 319,109 | 37.51 | 15 | 70 | 9 | |||||
| Democratic Unity Coalition | 133,033 | 15.64 | 15 | 27 | 2 | |||||
| PSD / CDS–PP / MPT | 68,101 | 8.01 | — | 2 | 6 | — | 0 | — | ||
| Independents | 63,081 | 7.42 | 5 | 10 | 1 | |||||
| Social Democratic | 49,076 | 5.77 | 5 | 19 | 2 | |||||
| Social Democratic / People's Party | 44,692 | 5.25 | 3 | 12 | 1 | |||||
| Left Bloc | 34,907 | 4.10 | 10 | 0 | 0 | |||||
| PSD / MPT / PPM | 19,804 | 2.33 | — | 4 | 4 | — | 0 | — | ||
| Portuguese Workers' Communist | 9,902 | 1.16 | 7 | 0 | 0 | |||||
| Party for Animals and Nature | 9,418 | 1.11 | — | 3 | 0 | — | 0 | — | ||
| PSD/ CDS–PP / MPT / PPM | 7,253 | 0.85 | 2 | 4 | 0 | |||||
| People's | 6,847 | 0.80 | 4 | 0 | 0 | |||||
| CDS–PP / MPT / PPM | 5,125 | 0.60 | — | 4 | 0 | — | 0 | — | ||
| PPM / PPV / PND | 3,443 | 0.40 | — | 2 | 0 | — | 0 | — | ||
| Portuguese Labour Party | 3,172 | 0.37 | 7 | 0 | 0 | |||||
| National Renovator | 2,634 | 0.31 | 4 | 0 | 0 | |||||
| New Democracy | 1,272 | 0.15 | — | 1 | 0 | — | 0 | — | ||
| Total valid | 780,869 | 91.79 | — | 152 | 15 | |||||
| Blank ballots | 39,778 | 4.68 | ||||||||
| Invalid ballots | 30,014 | 3.53 | ||||||||
| Total (turnout 44.51%) | 850,795 | 100.00 | ||||||||
| Source: Autárquicas 2013 Resultados Oficiais | ||||||||||
Portalegre
| Parties | Votes | % | ±pp swing | Candidacies | Councillors | Mayors | ||||
|---|---|---|---|---|---|---|---|---|---|---|
| # | ± | # | ± | |||||||
| Socialist | 28,368 | 43.32 | 15 | 37 | 6 | |||||
| Democratic Unity Coalition | 11,306 | 17.26 | 15 | 15 | 2 | |||||
| Social Democratic | 10,115 | 15.44 | 11 | 22 | 6 | |||||
| Independents | 5,662 | 8.65 | 4 | 4 | 1 | |||||
| Social Democratic / People's Party | 2,704 | 4.13 | 3 | 1 | 0 | |||||
| People's | 1,599 | 2.44 | 4 | 1 | 0 | |||||
| Earth | 1,430 | 2.18 | 1 | 1 | 0 | |||||
| PSD / PPM | 686 | 1.05 | — | 1 | 0 | — | 0 | — | ||
| Left Bloc | 658 | 1.00 | 4 | 0 | 0 | |||||
| Total valid | 62,528 | 95.48 | — | 81 | 15 | |||||
| Blank ballots | 1,599 | 2.44 | ||||||||
| Invalid ballots | 1,365 | 2.95 | ||||||||
| Total (turnout 63.14%) | 65,561 | 100.00 | ||||||||
| Source: Autárquicas 2013 Resultados Oficiais | ||||||||||
Porto
| Parties | Votes | % | ±pp swing | Candidacies | Councillors | Mayors | ||||
|---|---|---|---|---|---|---|---|---|---|---|
| # | ± | # | ± | |||||||
| Socialist | 316,597 | 35.71 | 18 | 71 | 8 | |||||
| Social Democratic / People's Party | 130,219 | 14.69 | 7 | 29 | 4 | |||||
| Independents | 125,325 | 14.14 | 11 | 18 | 2 | |||||
| Social Democratic | 66,994 | 7.56 | 6 | 19 | 3 | |||||
| PSD / PPM | 61,840 | 6.98 | — | 4 | 18 | — | 1 | — | ||
| Democratic Unity Coalition | 54,291 | 6.12 | 18 | 5 | 0 | |||||
| PSD / PPM / MPT | 24,366 | 2.75 | — | 1 | 3 | — | 0 | — | ||
| Left Bloc | 23,553 | 2.66 | 13 | 0 | 0 | |||||
| People's | 14,198 | 1.60 | 9 | 1 | 0 | |||||
| Portuguese Workers' Communist | 3,056 | 0.34 | 4 | 0 | 0 | |||||
| Portuguese Labour Party | 2,130 | 0.24 | — | 4 | 0 | — | 0 | — | ||
| Total valid | 822,569 | 92.78 | — | 164 | 18 | |||||
| Blank ballots | 34,306 | 3.87 | ||||||||
| Invalid ballots | 29,705 | 3.35 | ||||||||
| Total (turnout 55.82%) | 886,823 | 100.00 | ||||||||
| Source: Autárquicas 2013 Resultados Oficiais | ||||||||||
Santarém
| Parties | Votes | % | ±pp swing | Candidacies | Councillors | Mayors | ||||
|---|---|---|---|---|---|---|---|---|---|---|
| # | ± | # | ± | |||||||
| Socialist | 80,363 | 37.51 | 21 | 61 | 13 | |||||
| Social Democratic | 36,667 | 17.11 | 12 | 23 | 4 | |||||
| Democratic Unity Coalition | 30,292 | 14.14 | 21 | 23 | 3 | |||||
| Social Democratic / People's Party | 19,220 | 8.97 | 6 | 12 | 1 | |||||
| Independents | 15,430 | 7.20 | 11 | 8 | 0 | |||||
| Left Bloc | 8,419 | 3.93 | 11 | 4 | 0 | |||||
| People's | 4,578 | 2.14 | 11 | 0 | 0 | |||||
| Earth | 1,369 | 0.64 | — | 1 | 0 | — | 0 | — | ||
| PSD / CDS–PP / MPT | 1,162 | 0.54 | — | 1 | 1 | — | 0 | — | ||
| Social Democratic / Earth Party | 755 | 0.35 | — | 1 | 1 | — | 0 | — | ||
| People's Party / Earth Party | 210 | 0.10 | 1 | 0 | 0 | |||||
| Total valid | 198,465 | 92.62 | — | 133 | 21 | |||||
| Blank ballots | 8,906 | 4.16 | ||||||||
| Invalid ballots | 6,889 | 3.22 | ||||||||
| Total (turnout 53.68%) | 214,401 | 100.00 | ||||||||
| Source: Autárquicas 2013 Resultados Oficiais | ||||||||||
Setúbal
| Parties | Votes | % | ±pp swing | Candidacies | Councillors | Mayors | ||||
|---|---|---|---|---|---|---|---|---|---|---|
| # | ± | # | ± | |||||||
| Democratic Unity Coalition | 125,588 | 41.49 | 13 | 56 | 11 | |||||
| Socialist | 78,909 | 26.07 | 13 | 36 | 2 | |||||
| Social Democratic | 25,504 | 8.43 | 9 | 7 | 0 | |||||
| Left Bloc | 16,694 | 5.51 | 11 | 2 | 0 | |||||
| Social Democratic / People's Party | 8,925 | 2.95 | 3 | 3 | 0 | |||||
| Independents | 5,963 | 1.97 | 4 | 4 | 0 | |||||
| People's | 5,804 | 1.92 | 9 | 1 | 0 | |||||
| Portuguese Workers' Communist | 5,150 | 1.70 | 6 | 0 | 0 | |||||
| Party for Animals and Nature | 3,562 | 1.18 | — | 4 | 0 | — | 0 | — | ||
| Portuguese Labour Party | 1,699 | 0.56 | — | 4 | 0 | — | 0 | — | ||
| Total valid | 277,798 | 91.77 | — | 109 | 13 | |||||
| Blank ballots | 13,736 | 4.54 | ||||||||
| Invalid ballots | 11,178 | 3.35 | ||||||||
| Total (turnout 41.67%) | 302,767 | 100.00 | ||||||||
| Source: Autárquicas 2013 Resultados Oficiais | ||||||||||
Viana do Castelo
| Parties | Votes | % | ±pp swing | Candidacies | Councillors | Mayors | ||||
|---|---|---|---|---|---|---|---|---|---|---|
| # | ± | # | ± | |||||||
| Socialist | 55,148 | 37.50 | 10 | 30 | 6 | |||||
| Social Democratic | 45,600 | 31.00 | 10 | 25 | 2 | |||||
| People's | 19,021 | 12.93 | 4 | 7 | 1 | |||||
| Democratic Unity Coalition | 8,030 | 5.46 | 10 | 1 | 0 | |||||
| Independents | 7,570 | 5.15 | 3 | 5 | 1 | |||||
| People's Party / Earth Party | 1,991 | 1.35 | — | 1 | 0 | — | 0 | — | ||
| Portuguese Workers' Communist | 744 | 0.51 | — | 1 | 0 | — | 0 | — | ||
| Party for Animals and Nature | 659 | 0.44 | — | 1 | 0 | — | 0 | — | ||
| Total valid | 138,754 | 94.34 | — | 68 | 10 | |||||
| Blank ballots | 5,239 | 3.56 | ||||||||
| Invalid ballots | 3,087 | 2.10 | ||||||||
| Total (turnout 57.32%) | 147,288 | 100.00 | ||||||||
| Source: Autárquicas 2013 Resultados Oficiais | ||||||||||
Vila Real
| Parties | Votes | % | ±pp swing | Candidacies | Councillors | Mayors | ||||
|---|---|---|---|---|---|---|---|---|---|---|
| # | ± | # | ± | |||||||
| Socialist | 54,731 | 40.74 | 14 | 42 | 8 | |||||
| Social Democratic | 54,054 | 40.24 | 12 | 37 | 6 | |||||
| Independents | 5,749 | 4.28 | — | 3 | 3 | — | 0 | — | ||
| Democratic Unity Coalition | 4,242 | 3.16 | 14 | 0 | 0 | |||||
| People's | 3,434 | 2.56 | 9 | 0 | 0 | |||||
| Social Democratic / People's Party | 2,870 | 2.14 | 1 | 2 | 0 | |||||
| People's Party / Social Democratic | 1,890 | 1.41 | — | 1 | 2 | — | 0 | — | ||
| Left Bloc | 603 | 0.45 | 1 | 0 | 0 | |||||
| Earth | 145 | 0.11 | 1 | 0 | 0 | |||||
| Portuguese Workers' Communist | 29 | 0.02 | 1 | 0 | 0 | |||||
| Total valid | 127,747 | 95.09 | — | 86 | 14 | |||||
| Blank ballots | 3,436 | 2.56 | ||||||||
| Invalid ballots | 3,161 | 2.35 | ||||||||
| Total (turnout 57.79%) | 134,541 | 100.00 | ||||||||
| Source: Autárquicas 2013 Resultados Oficiais | ||||||||||
Viseu
| Parties | Votes | % | ±pp swing | Candidacies | Councillors | Mayors | ||||
|---|---|---|---|---|---|---|---|---|---|---|
| # | ± | # | ± | |||||||
| Socialist | 85,026 | 39.33 | 24 | 70 | 11 | |||||
| Social Democratic | 63,998 | 29.60 | 15 | 52 | 10 | |||||
| Social Democratic / People's Party | 33,017 | 15.27 | 9 | 26 | 3 | |||||
| People's | 9,689 | 4.48 | 14 | 2 | 0 | |||||
| Democratic Unity Coalition | 5,954 | 2.75 | 24 | 0 | 0 | |||||
| Left Bloc | 2,607 | 1.21 | 6 | 0 | 0 | |||||
| Independents | 2,393 | 1.11 | 2 | 2 | 0 | |||||
| Earth | 234 | 0.11 | 1 | 0 | 0 | |||||
| Total valid | 202,918 | 93.86 | — | 152 | 24 | |||||
| Blank ballots | 7,270 | 3.36 | ||||||||
| Invalid ballots | 6,000 | 2.78 | ||||||||
| Total (turnout 57.03%) | 216,465 | 100.00 | ||||||||
| Source: Autárquicas 2013 Resultados Oficiais | ||||||||||
Madeira
| Parties | Votes | % | ±pp swing | Candidacies | Councillors | Mayors | ||||
|---|---|---|---|---|---|---|---|---|---|---|
| # | ± | # | ± | |||||||
| Social Democratic | 47,207 | 34.81 | 11 | 33 | 4 | |||||
| PS / BE / PND / MPT / PTP / PAN | 21,102 | 15.56 | — | 1 | 5 | — | 1 | — | ||
| People's | 17,679 | 13.04 | 9 | 8 | 1 | |||||
| Independents | 16,738 | 12.34 | 4 | 9 | 2 | |||||
| Socialist | 11,636 | 8.58 | 7 | 13 | 3 | |||||
| Democratic Unity Coalition | 7,243 | 5.34 | 11 | 1 | 0 | |||||
| Earth | 2,198 | 1.62 | 1 | 1 | 0 | |||||
| PS / PTP / PND / BE | 2,157 | 1.59 | — | 1 | 1 | — | 0 | — | ||
| Party for Animals and Nature | 1,657 | 1.22 | — | 3 | 0 | — | 0 | — | ||
| Portuguese Labour Party | 941 | 0.69 | — | 5 | 0 | — | 0 | — | ||
| Left Bloc | 516 | 0.38 | 5 | 0 | 0 | |||||
| Total valid | 129,074 | 95.17 | — | 71 | 11 | |||||
| Blank ballots | 1,678 | 1.24 | ||||||||
| Invalid ballots | 4,870 | 3.59 | ||||||||
| Total (turnout 52.52%) | 135,676 | 100.00 | ||||||||
| Source: Autárquicas 2013 Resultados Oficiais | ||||||||||
Azores
| Parties | Votes | % | ±pp swing | Candidacies | Councillors | Mayors | ||||
|---|---|---|---|---|---|---|---|---|---|---|
| # | ± | # | ± | |||||||
| Socialist | 56,977 | 46.62 | 19 | 62 | 13 | |||||
| Social Democratic | 38,149 | 31.22 | 14 | 33 | 4 | |||||
| Social Democratic / People's Party | 7,810 | 6.39 | — | 2 | 4 | — | 0 | — | ||
| People's | 3,205 | 2.62 | 6 | 3 | 1 | |||||
| PSD / CDS–PP / PPM | 2,729 | 2.23 | — | 1 | 3 | — | 0 | — | ||
| PSD / PPM | 2,414 | 1.98 | — | 1 | 3 | — | 0 | — | ||
| Democratic Unity Coalition | 2,105 | 1.72 | 8 | 0 | 0 | |||||
| Left Bloc | 2,070 | 1.69 | 5 | 0 | 0 | |||||
| Independents | 1,961 | 1.60 | — | 3 | 3 | — | 1 | — | ||
| Total valid | 117,420 | 96.08 | — | 111 | 19 | |||||
| Blank ballots | 3,086 | 2.53 | ||||||||
| Invalid ballots | 1,702 | 1.39 | ||||||||
| Total (turnout 54.01%) | 122,364 | 100.00 | ||||||||
| Source: Autárquicas 2013 Resultados Oficiais | ||||||||||
Results by municipality
The table shows the results in the 20 District capitals plus Vila Nova de Gaia, Sintra, Oeiras and Matosinhos cities with over 100,000 inhabitants which are not district capitals.[7]
| Municipality | Party | Votes | % | Seats | +/- | |
|---|---|---|---|---|---|---|
 |
Aveiro 9 seats |
PSD/CDS–PP | 16,694 | 48.63% | 5 | |
| PS | 8,372 | 24.39% | 3 | = | ||
| Independent list | 3,480 | 10.14% | 1 | |||
 |
Beja 7 seats |
CDU | 7,438 | 43.42% | 4 | |
| PS | 7,135 | 41.65% | 3 | |||
 |
Braga 11 seats |
PSD/CDS–PP/PPM | 44,571 | 46.71% | 6 | |
| PS | 31,326 | 32,83% | 4 | |||
| CDU | 8.355 | 8.76% | 1 | |||
 |
Bragança 7 seats |
PSD | 9,449 | 47.24% | 4 | = |
| PS | 5,204 | 26.20% | 2 | = | ||
| Independent lists | 3,308 | 16.54% | 1 | = | ||
 |
Castelo Branco 9 seats |
PS | 16,104 | 61.87% | 7 | |
| PSD | 5,207 | 20.00% | 2 | |||
 |
Coimbra 11 seats |
PS | 22,631 | 35.51% | 5 | |
| PSD/PPM/MPT | 18,946 | 29.73% | 4 | |||
| CDU | 7,078 | 11,11% | 1 | = | ||
| Independent lists | 5,906 | 9,27% | 1 | |||
.png) |
Évora 7 seats |
CDU | 11,776 | 49.30% | 4 | |
| PS | 6,199 | 25.95% | 2 | |||
| PSD/CDS–PP | 3,510 | 14,70% | 1 | = | ||
 |
Faro 9 seats |
PSD/CDS–PP/PPM/MPT | 8,306 | 33.94% | 4 | |
| PS | 7,911 | 32.32% | 4 | = | ||
| CDU | 3,122 | 12.76% | 1 | |||
 |
Funchal 11 seats |
PS/BE/PND/MPT/PTP/PAN | 21,102 | 39.22% | 5 | |
| PSD | 17,450 | 32.43% | 4 | |||
| CDS–PP | 7.828 | 14.55% | 1 | = | ||
| CDU | 4.504 | 8.37% | 1 | = | ||
 |
Guarda 7 seats |
PSD/CDS–PP | 12,222 | 51.43% | 5 | |
| PS | 7,223 | 30.39% | 2 | |||
 |
Leiria 11 seats |
PS | 26,166 | 46.31% | 7 | |
| PSD | 15,735 | 27.85% | 4 | |||
| CDS–PP | 2,639 | 4.67% | 0 | |||
 |
Lisbon 17 seats |
PS | 116,425 | 50.91% | 11 | |
| PSD/CDS–PP/MPT | 51,156 | 22.37% | 4 | |||
| CDU | 22,519 | 9.85% | 2 | |||
 |
Matosinhos 11 seats |
Independent lists | 32,014 | 43.41% | 6 | |
| PS | 18,629 | 25.26% | 3 | |||
| PSD | 6,869 | 9.31% | 1 | |||
| CDU | 5,396 | 7.32% | 1 | |||
 |
Oeiras 11 seats |
Independent lists | 23,071 | 33.45% | 5 | = |
| PSD | 13,215 | 19.16% | 3 | |||
| PS | 12.638 | 18.32% | 2 | |||
| CDU | 6,309 | 9.15% | 1 | = | ||
 |
Ponta Delgada 9 seats |
PSD | 14,604 | 49.81% | 5 | |
| PS | 12,269 | 41.84% | 4 | |||
 |
Portalegre 7 seats |
Independent lists | 5,514 | 42.44% | 4 | |
| PS | 3,104 | 23.89% | 2 | |||
| CDU | 2,275 | 17.51% | 1 | = | ||
| PSD/CDS–PP | 1,377 | 10.60% | 0 | |||
 |
Porto 13 seats |
Independent lists | 45,411 | 39.25% | 6 | |
| PS | 26,237 | 22.68% | 3 | |||
| PSD/PPM/MPT | 24,366 | 21.06% | 3 | |||
| CDU | 8,539 | 7.38% | 1 | = | ||
 |
Santarém 9 seats |
PSD | 11,196 | 40.31% | 4 | |
| PS | 8,962 | 32.27% | 4 | |||
| CDU | 2,872 | 10.34% | 1 | |||
 |
Setúbal 11 seats (2 more than in the 2009 elections) |
CDU | 16,801 | 41.93% | 6 | |
| PS | 10,583 | 26.41% | 3 | |||
| PSD/CDS–PP | 5,150 | 12.85% | 1 | = | ||
 |
Sintra 11 seats |
PS | 32,984 | 26.83% | 4 | = |
| Independent lists | 31,246 | 25.42% | 4 | |||
| PSD/CDS–PP/MPT | 16,945 | 13.79% | 2 | |||
| CDU | 15,362 | 12.50% | 1 | = | ||
 |
Viana do Castelo 9 seats |
PS | 22,183 | 47.67% | 5 | = |
| PSD | 12,361 | 26.56% | 3 | |||
| CDU | 4,919 | 10.57% | 1 | |||
 |
Vila Real 9 seats (2 more than in the 2009 elections) |
PS | 13,467 | 44.00% | 5 | |
| PSD | 12,926 | 42.23% | 4 | = | ||
 |
Vila Nova de Gaia 11 seats |
PS | 53,146 | 38.15% | 5 | |
| PSD/CDS–PP | 27,813 | 19.97% | 3 | |||
| Independent lists | 27,494 | 19.74% | 3 | |||
 |
Viseu 9 seats |
PSD | 21,402 | 46.37% | 5 | |
| PS | 12,386 | 26.84% | 3 | |||
| CDS–PP | 4,414 | 9.56% | 1 | |||
References
- 1 2 3 4 5 The PSD ran on joint lists this time in municipalities that they had previously won with PSD-only lists, this number only reflects municipalities where there were PSD-only lists in both 2009 and 2013.
- 1 2 The PSD ran on joint lists with the CDS-PP in more municipalities in 2009, but ran on PSD-only lists in those municipalities in 2013. This number only reflects municipalities where there were PSD/CDS-PP lists in both 2009 and 2013.
- ↑ CDU recaptures Évora, Beja, and Loures | Público
- ↑ "Lisbon: Costa claims historic victory (in Portuguese)". Expresso. 29 September 2013. Retrieved 15 November 2013.
- ↑ This joint list was not repeated in all municipalities where it participated in 2009; this number reflects municipalities where a PSD/CDS-PP/MPT/PPM list participated in both 2009 and 2013.
- ↑ This joint list was not repeated in all municipalities where it participated in 2009; this number reflects municipalities where a PSD/CDS-PP list participated in both 2009 and 2013.
- ↑ Autarquicas 2013 - Resultados Oficiais Archived 2014-06-01 at the Wayback Machine.
| Presidential elections | |
|---|---|
| Parliamentary elections |
|
| Local elections | |
| European elections | |
| Referendums | |
| |