Portuguese legislative election, 1987
|
| ||||||||||||||||||||||||||||||||||||||||||||||||||||||||||||||||||||||||||||||||||||||
| ||||||||||||||||||||||||||||||||||||||||||||||||||||||||||||||||||||||||||||||||||||||
250 seats to the Portuguese Assembly 125 seats needed for a majority | ||||||||||||||||||||||||||||||||||||||||||||||||||||||||||||||||||||||||||||||||||||||
|---|---|---|---|---|---|---|---|---|---|---|---|---|---|---|---|---|---|---|---|---|---|---|---|---|---|---|---|---|---|---|---|---|---|---|---|---|---|---|---|---|---|---|---|---|---|---|---|---|---|---|---|---|---|---|---|---|---|---|---|---|---|---|---|---|---|---|---|---|---|---|---|---|---|---|---|---|---|---|---|---|---|---|---|---|---|---|
| Registered |
7,930,668 | |||||||||||||||||||||||||||||||||||||||||||||||||||||||||||||||||||||||||||||||||||||
| Turnout |
5,676,358 (71.6%) | |||||||||||||||||||||||||||||||||||||||||||||||||||||||||||||||||||||||||||||||||||||
| ||||||||||||||||||||||||||||||||||||||||||||||||||||||||||||||||||||||||||||||||||||||
| ||||||||||||||||||||||||||||||||||||||||||||||||||||||||||||||||||||||||||||||||||||||

_(cropped).jpg)
.jpg)
_(cropped).png)

| This article is part of the series: |
| Politics and government of Portugal |
|---|
 |
| Portugal |
The Portuguese legislative election of 1987 took place on 19 July. In the previous election, in 1985, the Social Democratic Party had won a minority government managing to survive in coalition with the Democratic and Social Center and the Democratic Renewal Party, and after the approval of a no-confidence motion from the left-wing parties, with the aid of the Democratic Renewal Party, the government fell and Mário Soares, the President at the time, called for a new election.
The PSD was elected to a landslide majority government—the biggest that a Portuguese party had ever won in a free election. Although the PSD was very popular going into the election, the size of its victory far exceeded the party's most optimistic expectations. The left-wing Democratic Unity Coalition lost some of its MPs to the Socialist Party and the Democratic Renovator Party lost almost all of its influence, mainly due to its responsibility in the fall of the former government. The right-wing Democratic and Social Center lost almost half of its vote share, due to the effect of tactical voting for the also right-wing, Social Democratic Party.
European elections were held on the same day.
Electoral system
The Parliament of the Portuguese Republic consists of a single chamber, the Assembly of the Republic, composed of 250 members directly elected by universal adult suffrage for a maximum term of four years. Assembly members represent the entire country, rather than the constituencies in which they were elected. Governments require majority support in the Assembly in order to remain in office.
Each one of Portugal's eighteen administrative districts, as well as each one of the country's two autonomous regions - the Azores and Madeira - is an electoral constituency. Portuguese voters residing outside the national territory are grouped into two electoral constituencies - Europe and the rest of the world - each one of which elects two Assembly members. The remaining 246 seats are allocated among the national territory constituencies in proportion to their number of registered electors.
Political parties and party coalitions may present lists of candidates. The lists are closed, so electors may not choose individual candidates in or alter the order of such lists. Electors cast a ballot for a single list. The seats in each constituency are divided among parties according to the largest average method of proportional representation (PR), conceived by the Belgian mathematician Victor d'Hondt in 1899. Although there is no statutory threshold for participation in the allocation of Assembly seats, there is an effective threshold at the constituency level that depends on the district magnitude.[3] The use of the d'Hondt method makes for a higher effective threshold than certain other allocation method such as the Hare quota or Sainte-Laguë method, which are more generous to small parties.[4]
Parties
The major parties involved and the respective leaders:
- Democratic Unity Coalition (CDU), Álvaro Cunhal
- Socialist Party (PS), Vítor Constâncio
- Democratic Renewal Party (PRD), Ramalho Eanes
- Social Democratic Party (PSD), Cavaco Silva
- Democratic and Social Center (CDS), Adriano Moreira
Aníbal Cavaco Silva, leader of the Social Democratic Party, was nominated Prime Minister.
Opinion Polling
The following table shows the opinion polls of voting intention of the Portuguese voters before the election. Those parties that are listed are currently represented in parliament. Included is also the result of the Portuguese general elections in 1985 and 1987 for reference.
| Date Released | Polling Firm | PSD | PS | CDU | PRD | CDS | Others | Lead | |
|---|---|---|---|---|---|---|---|---|---|
| 19 Jul 1987 | Leg. Election | 50.2 148 seats |
22.2 60 seats |
12.1 31 seats |
4.9 7 seats |
4.4 4 seats |
6.2 0 seats |
28.0 | |
| 19 Jul | RTP1 | 48.0–50.0 | 21.0–23.0 | 12.5–14.5 | 5.0–7.0 | 3.0–5.0 | – | 27.0 | |
| 19 Jul | Antena1 | 45.0–47.0 | 24.0–25.0 | – | – | – | – | 21.0–22.0 | |
| Exit polls | |||||||||
| 17 Jul | Euroexpansão/Expresso | 41.0–44.0 | 22.0–25.0 | 13.0–15.0 | 11.0–14.0 | 4.0–6.0 | – | 19.0 | |
| 1987 | |||||||||
| 6 Oct 1985 | Leg. Election | 29.9 88 seats |
20.8 57 seats |
15.5 38 seats |
17.9 45 seats |
10.0 22 seats |
5.9 0 seats |
9.1 | |
National summary of votes and seats
 | ||||||||||
| Parties | Votes | % | ± | MPs | MPs %/ votes % | |||||
|---|---|---|---|---|---|---|---|---|---|---|
| 1985 | 1987 | ± | % | ± | ||||||
| Social Democratic | 2,850,784 | 50.22 | 88 | 148 | 59.20 | 1.18 | ||||
| Socialist | 1,262,506 | 22.24 | 57 | 60 | 24.00 | 1.08 | ||||
| Democratic Unity Coalition[A][B] | 689,137 | 12.14 | 38 | 31 | 12.40 | 1.02 | ||||
| Democratic Renewal | 278,561 | 4.91 | 45 | 7 | 2.80 | 0.57 | ||||
| Democratic and Social Centre | 251,987 | 4.44 | 22 | 4 | 1.60 | 0.36 | ||||
| People's Democratic Union | 50,717 | 0.89 | 0 | 0 | 0.00 | 0.0 | ||||
| Revolutionary Socialist | 32,977 | 0.58 | 0 | 0 | 0.00 | 0.0 | ||||
| Portuguese Democratic Movement | 32,607 | 0.57 | N/A | N/A | 0 | N/A | 0.00 | N/A | 0.0 | |
| Christian Democratic | 31,667 | 0.56 | 0 | 0 | 0.00 | 0.0 | ||||
| People's Monarchist | 23,218 | 0.41 | N/A | N/A | 0 | N/A | 0.00 | N/A | 0.0 | |
| Portuguese Workers' Communist | 20,800 | 0.37 | 0 | 0 | 0.00 | 0.0 | ||||
| Communist Party (Reconstructed) | 18,544 | 0.33 | 0 | 0 | 0.00 | 0.0 | ||||
| Workers Party of Socialist Unity | 9,185 | 0.16 | 0 | 0 | 0.00 | 0.0 | ||||
| Total valid | 5,552,690 | 97.82 | 250 | 250 | 100.00 | — | ||||
| Blank ballots | 50,135 | 0.88 | ||||||||
| Invalid ballots | 73,533 | 1.30 | ||||||||
| Total (turnout 71.57%) | 5,676,358 | 100.00 | ||||||||
| A In 1985, as United People Alliance. B Portuguese Communist Party (29 MPs) and "The Greens" (2 MPs) ran in coalition.[5] | ||||||||||
| Source: Comissão Nacional de Eleições | ||||||||||
Distribution by constituency
| Constituency | % | S | % | S | % | S | % | S | % | S | Total S |
|---|---|---|---|---|---|---|---|---|---|---|---|
| PSD | PS | CDU | PRD | CDS | |||||||
| Azores | 66.7 | 4 | 20.0 | 1 | 2.3 | - | 3.0 | - | 3.3 | - | 5 |
| Aveiro | 60.4 | 11 | 22.9 | 4 | 4.4 | - | 2.7 | - | 5.3 | - | 15 |
| Beja | 24.5 | 1 | 20.3 | 1 | 38.7 | 3 | 5.7 | - | 2.0 | - | 5 |
| Braga | 53.4 | 10 | 25.9 | 5 | 6.1 | 1 | 3.3 | - | 5.9 | 1 | 17 |
| Bragança | 60.8 | 3 | 19.2 | 1 | 3.2 | - | 1.3 | - | 7.6 | - | 4 |
| Castelo Branco | 52.1 | 4 | 22.4 | 2 | 7.1 | - | 6.0 | - | 4.7 | - | 6 |
| Coimbra | 50.0 | 6 | 28.7 | 4 | 7.2 | 1 | 3.5 | - | 4.5 | - | 11 |
| Évora | 32.1 | 2 | 15.4 | - | 36.2 | 2 | 7.7 | - | 2.1 | - | 4 |
| Faro | 46.7 | 5 | 24.9 | 3 | 10.9 | 1 | 6.3 | - | 3.1 | - | 9 |
| Guarda | 60.0 | 4 | 21.8 | 1 | 3.3 | - | 2.0 | - | 6.6 | - | 5 |
| Leiria | 60.8 | 9 | 18.7 | 2 | 5.9 | - | 3.0 | - | 6.0 | - | 11 |
| Lisbon | 45.8 | 28 | 21.2 | 12 | 16.5 | 10 | 6.9 | 4 | 3.7 | 2 | 56 |
| Madeira | 65.5 | 4 | 16.2 | 1 | 1.9 | - | 3.3 | - | 5.2 | - | 5 |
| Portalegre | 37.4 | 1 | 25.1 | 1 | 20.9 | 1 | 6.3 | - | 3.1 | - | 3 |
| Porto | 50.9 | 22 | 26.7 | 11 | 9.4 | 4 | 4.0 | 1 | 4.0 | 1 | 39 |
| Santarém | 47.9 | 7 | 21.7 | 3 | 12.6 | 1 | 7.3 | 1 | 3.6 | - | 12 |
| Setúbal | 32.6 | 6 | 17.6 | 3 | 32.7 | 7 | 8.7 | 1 | 1.9 | - | 17 |
| Viana do Castelo | 54.5 | 5 | 20.3 | 1 | 6.3 | - | 4.8 | - | 7.7 | - | 6 |
| Vila Real | 62.5 | 5 | 20.3 | 1 | 4.1 | - | 1.4 | - | 5.0 | - | 6 |
| Viseu | 64.1 | 8 | 17.9 | 2 | 2.9 | - | 1.7 | - | 7.0 | - | 10 |
| Europe | 37.0 | 1 | 28.4 | 1 | 15.9 | - | 4.9 | - | 6.6 | - | 2 |
| Rest of the World | 63.2 | 2 | 7.3 | - | 1.4 | - | 1.7 | - | 19.9 | - | 2 |
| Total | 50.2 | 148 | 22.2 | 60 | 12.1 | 31 | 4.9 | 7 | 4.4 | 4 | 250 |
| Source: Comissão Nacional de Eleições | |||||||||||
Maps
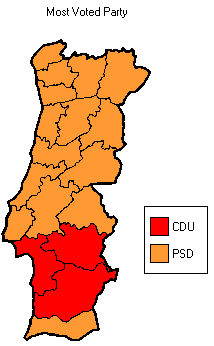
.png) Most voted political force by municipality.
Most voted political force by municipality.
References
- ↑ Assembleia da República - Deputados e Grupos Parlamentares
- ↑ Assembleia da República - Deputados e Grupos Parlamentares
- ↑ "Effective threshold in electoral systems". Trinity College, Dublin. Retrieved 2015-10-21.
- ↑ Gallaher, Michael (1992). "Comparing Proportional Representation Electoral Systems: Quotas, Thresholds, Paradoxes and Majorities"
- ↑ Electoral results - Assembly of the Republic
External links
See also
| Presidential elections | |
|---|---|
| Parliamentary elections |
|
| Local elections | |
| European elections | |
| Referendums | |
| |