Portuguese legislative election, 1976
|
| |||||||||||||||||||||||||||||||||||||||||||||||||||||||||||||||||||||||
| |||||||||||||||||||||||||||||||||||||||||||||||||||||||||||||||||||||||
263 seats to the Portuguese Assembly 132 seats needed for a majority | |||||||||||||||||||||||||||||||||||||||||||||||||||||||||||||||||||||||
|---|---|---|---|---|---|---|---|---|---|---|---|---|---|---|---|---|---|---|---|---|---|---|---|---|---|---|---|---|---|---|---|---|---|---|---|---|---|---|---|---|---|---|---|---|---|---|---|---|---|---|---|---|---|---|---|---|---|---|---|---|---|---|---|---|---|---|---|---|---|---|---|
| Registered |
6,564,667 | ||||||||||||||||||||||||||||||||||||||||||||||||||||||||||||||||||||||
| Turnout |
5,483,461 (83.5%) | ||||||||||||||||||||||||||||||||||||||||||||||||||||||||||||||||||||||
| |||||||||||||||||||||||||||||||||||||||||||||||||||||||||||||||||||||||
| |||||||||||||||||||||||||||||||||||||||||||||||||||||||||||||||||||||||
.jpg)
.jpg)

.jpg)
| This article is part of the series: |
| Politics and government of Portugal |
|---|
 |
| Portugal |
The Portuguese legislative election of 1976 took place on 25 April, exactly one year after the previous election, and two years after the Carnation Revolution. With a new Constitution approved, the country's main aim was the economical recovery and the strengthen of the democratic conquests.
The election was won again by the Socialist Party and Mário Soares, its leader, became the Prime-Minister of the 1st Constitutional government on 23 July. The lack of a socialist majority forced this party to form an unexpected coalition with the Democratic and Social Center, the party on the right end of the political spectrum at the time. The nature of such coalition, between a party that defended the socialist way to the country and another that voted against the constitution because of its socialist influences surprised most of the Portuguese voters and marked the start of the right-wing turn of the Socialist Party that would soon be attacked by all the left due to the new government measures against the left-wing conquests of the revolution, mainly the agrarian reform.
The Social Democratic Party (then known as the Democratic People's Party, PPD) was the second most voted party and the Portuguese Communist Party achieved a relevant increase in the voting, showing its growing influence, mainly in the south of the country.
Electoral system
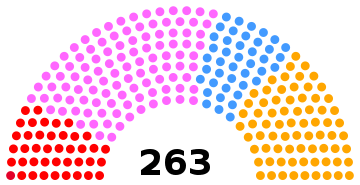
In the first election after the approval of the new Constitution, the Parliament of the Portuguese Republic consists of a single chamber, the Assembly of the Republic, composed of 263 members directly elected by universal adult suffrage for a maximum term of four years. Assembly members represent the entire country, rather than the constituencies in which they were elected. Governments require majority support in the Assembly in order to remain in office.
Each one of Continental Portugal's eighteen administrative districts, plus the 4 districts in the country's two autonomous regions – Azores and Madeira – are an electoral constituency. Portuguese voters residing outside the national territory are grouped into two electoral constituencies – Europe and the rest of the world – each one of which elects two Assembly members. The remaining 259 seats are allocated among the national territory constituencies in proportion to their number of registered electors.
Political parties and party coalitions may present lists of candidates. The lists are closed, so electors may not choose individual candidates in or alter the order of such lists. Electors cast a ballot for a single list. The seats in each constituency are divided among parties according to the largest average method of proportional representation (PR), conceived by the Belgian mathematician Victor d'Hondt in 1899. Although there is no statutory threshold for participation in the allocation of Assembly seats, there is an effective threshold at the constituency level that depends on the district magnitude.[3] The use of the d'Hondt method makes for a higher effective threshold than certain other allocation method such as the Hare quota or Sainte-Laguë method, which are more generous to small parties.[4]
Parties
The major parties involved and the respective leaders:
National summary of votes and seats
 | ||||||||||
| Parties | Votes | % | ± | Seats | MPs %/ votes % | |||||
|---|---|---|---|---|---|---|---|---|---|---|
| 1975 | 1976 | ± | % | ± | ||||||
| Socialist | 1,912,921 | 34.89 | 116 | 107 | 40.68 | 1.17 | ||||
| Democratic People's | 1,335,381 | 24.35 | 81 | 73 | 27.76 | 1.14 | ||||
| Democratic and Social Centre | 876,077 | 15.98 | 16 | 42 | 15.97 | 1.00 | ||||
| Communist | 788,830 | 14.39 | 30 | 40 | 15.21 | 1.06 | ||||
| People's Democratic Union | 91,690 | 1.67 | 1 | 1 | 0.38 | 0.23 | ||||
| People's Socialist Front | 42,162 | 0.77 | 0 | 0 | 0.00 | 0.0 | ||||
| Portuguese Workers' Communist | 36,200 | 0.66 | N/A | N/A | 0 | N/A | 0.00 | N/A | 0.0 | |
| Movement of Socialist Left | 31,332 | 0.57 | 0 | 0 | 0.00 | 0.0 | ||||
| Christian Democratic | 29,874 | 0.54 | N/A | N/A | 0 | N/A | 0.00 | N/A | 0.0 | |
| People's Monarchist | 28,320 | 0.52 | 0 | 0 | 0.00 | 0.0 | ||||
| Internationalist Communist League | 16,269 | 0.30 | 0 | 0 | 0.00 | 0.0 | ||||
| PCP(m-l) | 15,830 | 0.29 | N/A | N/A | 0 | N/A | 0.00 | N/A | 0.0 | |
| Worker-Peasant Alliance | 15,778 | 0.29 | N/A | N/A | 0 | N/A | 0.00 | N/A | 0.0 | |
| Revolutionary Socialist | 5,171 | 0.09 | N/A | N/A | 0 | N/A | 0.00 | N/A | 0.0 | |
| Total valid | 5,225,835 | 95.30 | 250[A] | 263 | 100.00 | — | ||||
| Invalid ballots | 257,696 | 4.70 | ||||||||
| Total (turnout 83.53%) | 5,483,461 | 100.00 | ||||||||
| A Portuguese Democratic Movement won 5 seats and the Independent Democratic Association of Macau won 1 seat in the 1975 election. Both parties did not contested this election. | ||||||||||
| Source: Comissão Nacional de Eleições | ||||||||||
Distribution by constituency
| Constituency | % | S | % | S | % | S | % | S | % | S | Total S |
|---|---|---|---|---|---|---|---|---|---|---|---|
| PS | PPD | CDS | PCP | UDP | |||||||
| Angra do Heroísmo | 30.4 | 1 | 51.8 | 1 | 12.1 | - | 1.5 | - | 2 | ||
| Aveiro | 30.8 | 5 | 35.2 | 6 | 22.5 | 4 | 3.7 | - | 0.9 | - | 15 |
| Beja | 32.0 | 2 | 8.2 | - | 4.2 | - | 44.0 | 4 | 2.2 | - | 6 |
| Braga | 32.3 | 6 | 28.6 | 5 | 21.2 | 4 | 4.2 | - | 1.0 | - | 15 |
| Bragança | 22.6 | 1 | 33.3 | 2 | 28.3 | 2 | 2.7 | - | 0.8 | - | 5 |
| Castelo Branco | 36.4 | 3 | 22.6 | 2 | 19.9 | 2 | 6.7 | - | 1.1 | - | 7 |
| Coimbra | 40.9 | 6 | 26.7 | 4 | 12.5 | 1 | 7.3 | 1 | 1.2 | - | 12 |
| Évora | 30.3 | 2 | 9.2 | - | 8.0 | - | 43.2 | 4 | 2.6 | - | 6 |
| Faro | 44.6 | 6 | 19.3 | 2 | 6.8 | - | 14.5 | 1 | 2.6 | - | 9 |
| Funchal | 24.9 | 1 | 53.0 | 4 | 13.3 | 1 | 1.5 | - | 1.3 | - | 6 |
| Guarda | 25.2 | 2 | 25.7 | 2 | 32.1 | 2 | 2.9 | - | 1.1 | - | 6 |
| Horta | 34.2 | - | 57.0 | 1 | 4.3 | - | 1.5 | - | 1 | ||
| Leiria | 31.1 | 4 | 31.2 | 4 | 19.4 | 2 | 7.3 | 1 | 1.0 | - | 11 |
| Lisbon | 38.3 | 25 | 16.4 | 10 | 13.2 | 8 | 21.8 | 14 | 2.6 | 1 | 58 |
| Ponta Delgada | 35.4 | 1 | 45.6 | 2 | 11.8 | - | 1.5 | - | 3 | ||
| Portalegre | 41.9 | 3 | 10.1 | - | 13.9 | - | 22.0 | 1 | 1.0 | - | 4 |
| Porto | 40.7 | 18 | 27.0 | 11 | 15.7 | 6 | 8.4 | 3 | 1.5 | - | 38 |
| Santarém | 38.5 | 6 | 19.5 | 3 | 13.9 | 2 | 16.1 | 2 | 1.7 | - | 13 |
| Setúbal | 32.2 | 7 | 8.4 | 1 | 4.4 | - | 44.4 | 9 | 2.8 | - | 17 |
| Viana do Castelo | 25.5 | 2 | 32.8 | 3 | 23.5 | 2 | 6.6 | - | 0.9 | - | 7 |
| Vila Real | 26.3 | 2 | 39.0 | 4 | 18.3 | 1 | 3.1 | - | 0.9 | - | 7 |
| Viseu | 23.0 | 3 | 32.2 | 4 | 31.2 | 4 | 2.3 | - | 0.9 | - | 11 |
| Europe | 46.1 | 1 | 32.2 | 1 | 6.9 | - | 10.1 | - | 0.8 | - | 2 |
| Rest of the World | 6.3 | - | 53.2 | 1 | 33.7 | 1 | 1.4 | - | 0.4 | - | 2 |
| Total | 34.9 | 107 | 24.4 | 73 | 16.0 | 42 | 14.4 | 40 | 1.7 | 1 | 263 |
| Source: Comissão Nacional de Eleições | |||||||||||
Maps
.png) Most voted political force by municipality.
Most voted political force by municipality.
References
- ↑ Fundação Mário Soares
- ↑ Diário da Républica, 25 de Maio de 1976 - Lista de candidatos eleitos
- ↑ "Effective threshold in electoral systems". Trinity College, Dublin. Retrieved 2015-10-21.
- ↑ Gallaher, Michael (1992). "Comparing Proportional Representation Electoral Systems: Quotas, Thresholds, Paradoxes and Majorities"
External links
See also
| Presidential elections | |
|---|---|
| Parliamentary elections |
|
| Local elections | |
| European elections | |
| Referendums | |
| |