Portuguese legislative election, 1980
|
| |||||||||||||||||||||||||||||||||||||||||||||||||
| |||||||||||||||||||||||||||||||||||||||||||||||||
250 seats to the Portuguese Assembly 125 seats needed for a majority | |||||||||||||||||||||||||||||||||||||||||||||||||
|---|---|---|---|---|---|---|---|---|---|---|---|---|---|---|---|---|---|---|---|---|---|---|---|---|---|---|---|---|---|---|---|---|---|---|---|---|---|---|---|---|---|---|---|---|---|---|---|---|---|
| Registered |
7,179,023 | ||||||||||||||||||||||||||||||||||||||||||||||||
| Turnout |
6,026,395 (83.9%) | ||||||||||||||||||||||||||||||||||||||||||||||||
| |||||||||||||||||||||||||||||||||||||||||||||||||
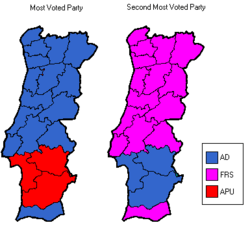 The first and the second most voted parties in each district (Azores and Madeira are not shown) | |||||||||||||||||||||||||||||||||||||||||||||||||
| |||||||||||||||||||||||||||||||||||||||||||||||||
.jpg)
.jpg)
.jpg)
| This article is part of the series: |
| Politics and government of Portugal |
|---|
 |
| Portugal |
The Portuguese legislative election of 1980 took place on 5 October. In January 1980, the Democratic Alliance, which had won the previous election, on 2 December 1979, entered office with Francisco Sá Carneiro leading the government. However, this election was an extraordinary election, and so, in 1980, another election was held.
Electoral system
The Parliament of the Portuguese Republic consists of a single chamber, the Assembly of the Republic, composed of 250 members directly elected by universal adult suffrage for a maximum term of four years. Assembly members represent the entire country, rather than the constituencies in which they were elected. Governments require majority support in the Assembly in order to remain in office.
Each one of Portugal's eighteen administrative districts, as well as each one of the country's two autonomous regions - the Azores and Madeira - is an electoral constituency. Portuguese voters residing outside the national territory are grouped into two electoral constituencies - Europe and the rest of the world - each one of which elects two Assembly members. The remaining 246 seats are allocated among the national territory constituencies in proportion to their number of registered electors.
Political parties and party coalitions may present lists of candidates. The lists are closed, so electors may not choose individual candidates in or alter the order of such lists. Electors cast a ballot for a single list. The seats in each constituency are divided among parties according to the largest average method of proportional representation (PR), conceived by the Belgian mathematician Victor d'Hondt in 1899. Although there is no statutory threshold for participation in the allocation of Assembly seats, there is an effective threshold at the constituency level that depends on the district magnitude.[3] The use of the d'Hondt method makes for a higher effective threshold than certain other allocation method such as the Hare quota or Sainte-Laguë method, which are more generous to small parties.[4]
Parties
The major parties involved and the respective leaders:
- United People Alliance (APU), Álvaro Cunhal
- Republican and Socialist Front (FRS), Mário Soares
- Democratic Alliance (AD), Francisco Sá Carneiro
The leader of the Democratic Alliance, Francisco Sá Carneiro, member of the Social Democratic Party was nominated Prime-Minister.
National summary of votes and seats
| Parties | Votes | % | ± | Seats | MPs %/ votes % | ||||||
|---|---|---|---|---|---|---|---|---|---|---|---|
| 1979 | 1980 | ± | % | ± | |||||||
| Democratic Alliance[A] | 2,706,667 | 44.91 | 121 | 126 | 50.40 | 1.12 | |||||
| Social Democratic[B] | 147,644 | 2.45 | 7 | 8 | 3.20 | 1.31 | |||||
| Democratic and Social Centre[B] | 13,765 | 0.23 | 0 | 0 | 0.00 | 0.0 | |||||
| Total Democratic Alliance | 2,868,076 | 47.59 | 128 | 134 | 53.60 | 1.13 | |||||
| Republican and Socialist Front[C] | 1,606,198 | 26.65 | N/A | N/A | 71 | N/A | 28.40 | N/A | 1.07 | ||
| Socialist[D] | 67,081 | 1.11 | N/A | 74 | 3 | N/A | 1.20 | N/A | 1.08 | ||
| Total Republican and Socialist Front | 1,673,279 | 27.76 | 741 | 74 | 29.60 | 1.07 | |||||
| United People Alliance[E] | 1,009,505 | 16.75 | 47 | 41 | 16.40 | 0.98 | |||||
| People's Democratic Union | 83,204 | 1.38 | 1 | 1 | 0.40 | 0.29 | |||||
| Workers Party of Socialist Unity | 83,095 | 1.38 | 0 | 0 | 0.00 | 0.0 | |||||
| Revolutionary Socialist | 60,496 | 1.00 | 0 | 0 | 0.00 | 0.0 | |||||
| Labour | 39,408 | 0.65 | N/A | N/A | 0 | N/A | 0.00 | N/A | 0.0 | ||
| Workers' Communist Party | 35,409 | 0.59 | 0 | 0 | 0.00 | 0.0 | |||||
| PDC / MIRN/PDP / FN | 23,819 | 0.40 | N/A | N/A | 0 | N/A | 0.00 | N/A | 0.0 | ||
| Democratic Party of the Atlantic | 8,529 | 0.14 | N/A | N/A | 0 | N/A | 0.00 | N/A | 0.0 | ||
| OCMLP | 3,913 | 0.06 | 0 | 0 | 0.00 | 0.0 | |||||
| Total valid | 5,888,733 | 97.72 | 250 | 250 | 100.00 | — | |||||
| Blank ballots | 34,552 | 0.57 | |||||||||
| Invalid ballots | 103,140 | 1.71 | |||||||||
| Total (turnout 83.94%) | 6,026,395 | 100.00 | |||||||||
| A Alliance formed by the Social Democratic Party (74 seats), the Democratic and Social Centre (46 seats) and the People's Monarchist Party (6 seats). B Social Democratic Party and Democratic and Social Centre electoral list only in Azores and Madeira. C Alliance formed by the Socialist Party (63 seats), the Leftwing Union for the Socialist Democracy (4 seats) and the Independent Social-Democratic Action (4 seats). D Socialist Party electoral list only in Azores and Madeira. E Portuguese Communist Party (39 MPs) and Portuguese Democratic Movement (2 MPs) ran in coalition.[5] | |||||||||||
| Source: Comissão Nacional de Eleições | |||||||||||
1 Republican and Socialist Front results are compared to the combined totals of the Socialist Party in the 1979 election.
Distribution by constituency
| Constituency | % | S | % | S | % | S | % | S | % | S | % | S | Total S |
|---|---|---|---|---|---|---|---|---|---|---|---|---|---|
| AD | FRS | APU | PSD | PS | UDP | ||||||||
| Azores | 3.1 | - | 57.0 | 4 | 27.3 | 1 | 1.3 | - | 5 | ||||
| Aveiro | 58.8 | 10 | 27.1 | 4 | 6.8 | 1 | 15 | ||||||
| Beja | 22.4 | 1 | 21.1 | 1 | 47.1 | 3 | 1.3 | - | 5 | ||||
| Braga | 54.9 | 9 | 29.3 | 5 | 8.4 | 1 | 0.9 | - | 15 | ||||
| Bragança | 65.3 | 3 | 21.3 | 1 | 4.8 | - | 1.0 | - | 4 | ||||
| Castelo Branco | 51.0 | 4 | 30.3 | 2 | 10.5 | - | 0.7 | - | 6 | ||||
| Coimbra | 46.1 | 6 | 35.9 | 5 | 9.9 | 1 | 0.8 | - | 12 | ||||
| Évora | 29.2 | 1 | 18.7 | 1 | 45.7 | 3 | 0.9 | - | 5 | ||||
| Faro | 37.2 | 4 | 34.7 | 4 | 16.7 | 1 | 1.9 | - | 9 | ||||
| Guarda | 60.6 | 4 | 26.3 | 1 | 5.0 | - | 0.7 | - | 5 | ||||
| Leiria | 59.8 | 7 | 22.7 | 3 | 9.7 | 1 | 1.0 | - | 11 | ||||
| Lisbon | 41.6 | 25 | 28.1 | 17 | 23.1 | 13 | 1.7 | 1 | 56 | ||||
| Madeira | 2.9 | - | 63.6 | 4 | 16.5 | 1 | 4.5 | - | 5 | ||||
| Portalegre | 33.4 | 2 | 32.4 | 1 | 26.1 | 1 | 0.7 | - | 4 | ||||
| Porto | 46.6 | 19 | 34.3 | 14 | 11.9 | 5 | 1.4 | - | 38 | ||||
| Santarém | 42.1 | 6 | 30.4 | 4 | 19.0 | 2 | 1.2 | - | 12 | ||||
| Setúbal | 24.1 | 4 | 23.5 | 4 | 44.0 | 9 | 2.8 | - | 17 | ||||
| Viana do Castelo | 59.2 | 5 | 22.8 | 1 | 10.0 | - | 0.7 | - | 6 | ||||
| Vila Real | 62.1 | 5 | 22.8 | 1 | 5.1 | - | 0.8 | - | 6 | ||||
| Viseu | 66.8 | 8 | 20.9 | 2 | 5.0 | - | 0.6 | - | 10 | ||||
| Europe | 49.6 | 1 | 15.2 | - | 25.4 | 1 | 1.4 | - | 2 | ||||
| Rest of the World | 85.5 | 2 | 2.6 | - | 4.0 | - | 0.4 | - | 2 | ||||
| Total | 44.9 | 126 | 26.7 | 71 | 16.8 | 41 | 2.5 | 8 | 1.1 | 3 | 1.4 | 1 | 250 |
| Source: Comissão Nacional de Eleições | |||||||||||||
Maps
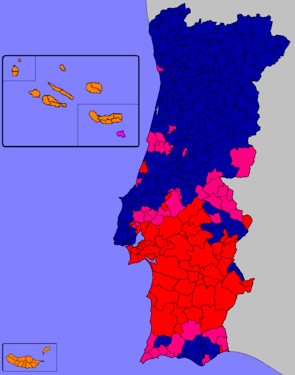 Most voted political force by municipality.
Notes
References
- ↑ Diário da Républica, 3 de Novembro de 1980 - Lista de candidatos eleitos
- ↑ Fundação Mário Soares
- ↑ "Effective threshold in electoral systems". Trinity College, Dublin. Retrieved 2015-10-21.
- ↑ Gallaher, Michael (1992). "Comparing Proportional Representation Electoral Systems: Quotas, Thresholds, Paradoxes and Majorities"
- ↑ "Electoral results - Assembly of the Republic". Archived from the original on 2012-07-16. Retrieved 2012-09-02.
External links
See also
| Presidential elections | |
|---|---|
| Parliamentary elections |
|
| Local elections | |
| European elections | |
| Referendums | |
| |