Portuguese local elections, 2005
|
| |||||||||||||||||||||||||||||||||||||||||||||||||
| |||||||||||||||||||||||||||||||||||||||||||||||||
All 308 Portuguese municipalities and 4,260 Portuguese Parishes All 2,046 local government councils | |||||||||||||||||||||||||||||||||||||||||||||||||
|---|---|---|---|---|---|---|---|---|---|---|---|---|---|---|---|---|---|---|---|---|---|---|---|---|---|---|---|---|---|---|---|---|---|---|---|---|---|---|---|---|---|---|---|---|---|---|---|---|---|
| Turnout |
60.9% | ||||||||||||||||||||||||||||||||||||||||||||||||
| |||||||||||||||||||||||||||||||||||||||||||||||||
.png)
.jpg)
.jpg)
| This article is part of the series: |
| Politics and government of Portugal |
|---|
 |
| Portugal |
The Portuguese local election of 2005 took place on 9 October. The election consisted of three separate elections in the 308 Portuguese municipalities, the election for the Municipal Chambers, whose winner is elected mayor, another election for the Municipal Assembly and a last one for the lower-level Parish Assembly, whose winner is elected parish president. This last was held separately in the more than 4,000 parishes around the country.
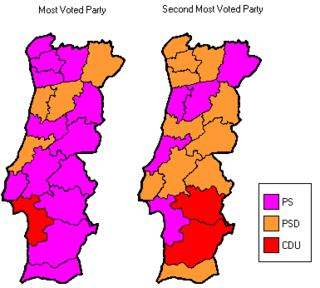
The Socialist Party may be considered the major defeated party of this election due to a slight loss of mandates. The Socialists did, however, achieve a better percentage of the vote in relation to the election of 2001.
On the right, the Social Democratic Party stole some municipalities from the Socialists, some of them in coalition with the People's Party that was reduced to only one municipality in stand-alone candidacies, Ponte de Lima, continuing its decline in comparison, for example, with the 36 mayors achieved in 1976.
On the left, the Unitarian Democratic Coalition, led by the Communist Party, regained some of its former influence, taking 4 municipalities and several parishes from the Socialists in the districts of Beja, Évora and Setúbal and Leiria achieving a total of 32 mayors, and winning, for the first time, the election in Peniche. The Leftwing Bloc kept the presidency of its single municipality, Salvaterra de Magos.
The election was also remarkable for the several victories of independent candidates, most of them former Socialist, Social Democratic and People's Party candidates who were expelled or given no confidence by their respective parties and, even so, became mayors. The best known were Valentim Loureiro in Gondomar, Fátima Felgueiras in Felgueiras and Isaltino Morais in Oeiras.
Parties
The main political forces involved in the election were:
- Left Bloc (BE)
- People's Party (CDS–PP)
- Democratic Unity Coalition (CDU)
- Socialist Party (PS)
- Social Democratic Party (PSD)
National summary of votes and seats
Municipal Councils
.png)
■ - PSD: 138
■ - PS: 109
■ - CDU: 32
■ - BE: 1
■ - CDS–PP: 1
■ - PSD coalitions: 20
■ - Independents: 7
| Parties | Votes | % | Candidacies | Councillors | Mayors | ||||
|---|---|---|---|---|---|---|---|---|---|
| # | ± | # | ± | ||||||
| Socialist | 1,933,041 | 35.87 | 307 | 853 | 109 | ||||
| Social Democratic | 1,523,526 | 28.27 | 245 | 742 | 138 | ||||
| Democratic Unity Coalition | 589,384 | 10.94 | 301 | 203 | 32 | ||||
| Social Democratic / People's | 462,199 | 8.58 | 42 | 131 | 18 | ||||
| People's | 165,192 | 3.07 | 185 | 30 | 1 | ||||
| Left Bloc | 158,953 | 2.95 | 111 | 7 | 1 | ||||
| Independents | 133,380 | 2.47 | 27 | 45 | 7 | ||||
| PSD / CDS–PP / PPM | 91,455 | 1.70 | 12 | 20 | 1 | ||||
| PSD / CDS–PP / PPM / MPT | 71,153 | 1.32 | 3 | 11 | — | 1 | — | ||
| Portuguese Workers' Communist | 15,421 | 0.29 | 19 | 0 | 0 | ||||
| Humanist | 5,096 | 0.09 | 13 | 0 | 0 | ||||
| New Democracy | 2,045 | 0.04 | 4 | 0 | — | 0 | — | ||
| National Renovator | 1,759 | 0.03 | 5 | 0 | 0 | ||||
| PSD / CDS–PP / MPT | 1,670 | 0.03 | 1 | 2 | — | 0 | — | ||
| Earth | 1,582 | 0.03 | 4 | 0 | 0 | ||||
| PSD / PPM | 707 | 0.01 | 1 | 0 | 0 | ||||
| PND / PPM | 439 | 0.01 | 1 | 0 | — | 0 | — | ||
| National Solidarity | 244 | 0.00 | 1 | 0 | — | 0 | — | ||
| People's / Social Democratic | 109 | 0.00 | 1 | 0 | 0 | ||||
| CDS–PP / PSD / PPM | 11 | 0.00 | 1 | 0 | — | 0 | — | ||
| Total valid | 5,159,104 | 95.73 | — | 2,046 | 308 | ||||
| Blank ballots | 139,012 | 2.58 | |||||||
| Invalid ballots | 90,919 | 1.69 | |||||||
| Total (turnout 60.94%) | 5,389,035 | 100.00 | |||||||
Municipal Assemblies
| Parties | Votes | % | Candidacies | Mandates | |||||
|---|---|---|---|---|---|---|---|---|---|
| # | ± | ||||||||
| Socialist | 1,923,468 | 35.68 | 307 | 2,794 | |||||
| Social Democratic | 1,454,256 | 26.98 | 245 | 2,416 | |||||
| Democratic Unity Coalition | 628,881 | 11.67 | 301 | 722 | |||||
| Social Democratic / People's | 454,972 | 8.44 | 41 | 407 | |||||
| Left Bloc | 212,652 | 3.95 | 115 | 114 | |||||
| People's | 175,927 | 3.26 | 162 | 190 | |||||
| Independents | 115,999 | 2.15 | 25 | 121 | |||||
| PSD / CDS–PP / PPM | 90,670 | 1.68 | 13 | 73 | |||||
| PSD / CDS–PP / PPM / MPT | 66,190 | 1.23 | 3 | 27 | — | ||||
| Portuguese Workers' Communist | 8,620 | 0.16 | 9 | 1 | |||||
| People's / Social Democratic | 2,768 | 0.05 | 2 | 6 | |||||
| PSD / CDS–PP / MPT | 1,641 | 0.03 | 1 | 6 | — | ||||
| Earth | 1,590 | 0.03 | 1 | 0 | |||||
| New Democracy | 1,590 | 0.03 | 2 | 1 | — | ||||
| People's Monarchist | 1,011 | 0.02 | 6 | 5 | |||||
| PND / PPM | 831 | 0.02 | 1 | 0 | — | ||||
| PSD / PPM | 760 | 0.01 | 1 | 2 | |||||
| Humanist | 200 | 0.00 | 2 | 0 | |||||
| CDS–PP / PSD / PPM | 8 | 0.00 | 1 | 0 | — | ||||
| Total valid | 5,161,181 | 95.72 | — | 6,885 | |||||
| Blank ballots | 138,424 | 2.57 | |||||||
| Invalid ballots | 92,140 | 1.71 | |||||||
| Total (turnout 60.94%) | 5,391,745 | 100.00 | |||||||
Parish Assemblies

| Parties | Votes | % | Candidacies | Mandates | Presidents | ||||
|---|---|---|---|---|---|---|---|---|---|
| # | ± | # | ± | ||||||
| Socialist | 1,903,166 | 35.37 | 3,711 | 13,460 | 1,518 | ||||
| Social Democratic | 1,433,256 | 26.64 | 3,065 | 12,447 | 1,723 | ||||
| Democratic Unity Coalition | 648,622 | 12.05 | 2,239 | 2,576 | 244 | ||||
| Social Democratic / People's | 411,633 | 7.65 | 529 | 2,065 | 219 | ||||
| Independents | 245,659 | 4.57 | 568 | 2,201 | 292 | ||||
| Left Bloc | 146,898 | 2.73 | 448 | 229 | 3 | ||||
| People's | 144,575 | 2.69 | 1,043 | 826 | 65 | ||||
| PSD / CDS–PP / PPM / MPT | 95,175 | 1.77 | 45 | 216 | — | 19 | — | ||
| PSD / CDS–PP / PPM | 84,398 | 1.57 | 125 | 400 | 34 | ||||
| Portuguese Workers' Communist | 3,635 | 0.07 | 28 | 0 | 0 | ||||
| New Democracy | 3,184 | 0.06 | 16 | 7 | — | 0 | — | ||
| Earth | 3,100 | 0.06 | 7 | 23 | 3 | ||||
| PSD / CDS–PP / MPT | 1,756 | 0.03 | 12 | 32 | — | 3 | — | ||
| People's / Social Democratic | 1,448 | 0.03 | 2 | 10 | 2 | ||||
| Humanist | 824 | 0.02 | 10 | 0 | 0 | ||||
| PSD / PPM | 807 | 0.02 | 5 | 6 | 0 | ||||
| National Solidarity Party | 72 | 0.00 | 5 | 0 | — | 0 | — | ||
| National Renovator | 38 | 0.00 | 1 | 0 | — | 0 | — | ||
| People's Monarchist | 27 | 0.00 | 1 | 0 | 0 | ||||
| Total valid | 5,130,086 | 95.31 | — | 34,498 | — | 4,125 | — | ||
| Blank ballots | 151,527 | 2.82 | |||||||
| Invalid ballots | 101,067 | 1.88 | |||||||
| Total (turnout 60.94%) | 5,382,680 | 100.00 | |||||||
End notes
- The source of the voting data is the Portuguese Electoral Commission
Further Notes:
- Democratic Unity Coalition (CDU) is composed of the Portuguese Communist Party (PCP), "The Greens" (PEV) and the Democratic Intervention (ID).
- The different coalitions between the Social Democratic Party (PSD), the People's Party (CDS–PP), the People's Monarchist Party (PPM) or the Earth Party (MPT) appear because each municipality has its own election.
- The number of candidacies expresses the number of municipalities or parishes in which the party or coalition presented lists.
- The number of mandates expresses the number of municipal deputies in the Municipal Assembly election and the number of parish deputies in the Parish Assembly election.
- The turnout varies because one may choose not to vote for all the organs.
References
- "CNE Resultados". Comissão Nacional de Eleições. Retrieved 17 January 2006.
| Presidential elections | |
|---|---|
| Parliamentary elections |
|
| Local elections | |
| European elections | |
| Referendums | |
| |