Portuguese local elections, 1985
|
| |||||||||||||||||||||||||||||||||||||||||||||||||
| |||||||||||||||||||||||||||||||||||||||||||||||||
All 305 Portuguese municipalities and 4,260 Portuguese Parishes All 1,975 local government councils | |||||||||||||||||||||||||||||||||||||||||||||||||
|---|---|---|---|---|---|---|---|---|---|---|---|---|---|---|---|---|---|---|---|---|---|---|---|---|---|---|---|---|---|---|---|---|---|---|---|---|---|---|---|---|---|---|---|---|---|---|---|---|---|
| Turnout |
63.0% | ||||||||||||||||||||||||||||||||||||||||||||||||
| |||||||||||||||||||||||||||||||||||||||||||||||||
.png)
.jpg)
| This article is part of the series: |
| Politics and government of Portugal |
|---|
 |
| Portugal |
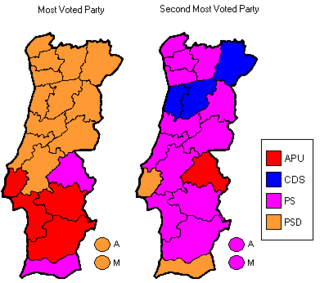
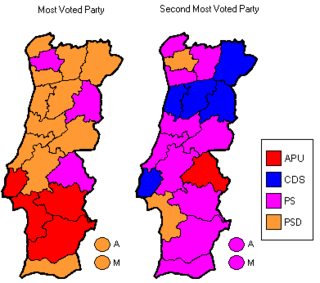
The Portuguese local elections of 1985 took place on 15 December. They were the fourth local elections in Portugal since the democratic revolution of 1974 introduced the concept of democratic local power.
The elections consisted of three separate elections in the 305 Portuguese municipalities that existed at the time, the election for the Municipal Chambers, whose winner is elected mayor, another election for the Municipal Assembly and a last one for the lower-level Parish Assembly, whose winner is elected parish president, this last was held separately in the more than 4,000 parishes around the country. This election was the first to grant a 4-years term, instead of the former 3 years. The number of members of the Municipal Assemblies and Parish Assemblies was greatly reduced in comparison with the former election.
For the first time, the Social Democratic Party achieved the majority of the voting by itself, since the coalition with the Democratic and Social Center, the Democratic Alliance, that achieved good results in 1979 and 1982 had been disbanded. Despite finishing second and losing almost 4% of the voting, the Socialist Party lost only 4 of the former 83 mayors plus the presidency achieved in coalition with the Leftwing Union for the Socialist Democracy.
The Democratic and Social Center, this time participating alone in every election, after the end of the Democratic Alliance, continued its electoral decline, gathering only 10% of the voting. Despite keeping the same number of mayors achieved in 1982, in the municipalities where it ran alone, 27, the party lost 49 presidencies achieved in coalition with the Social Democrats.
The Portuguese Communist Party and the Portuguese Democratic Movement, united in the United People Alliance, lost 1% of the voting in comparison with the election of 1982 and lost 8 mayors, gathering only 47 presidencies. However, despite losing only 1% of the voting in the elections to Municipal Assemblies, the coalition lost almost 700 assembly members, decreasing its representation to 1062 members due to the overall reduction of mandates.
The newly founded Democratic Renewal Party, achieved almost 5% of the voting and the presidency of 3 municipalities. In the elections to Municipal Assemblies it gathered almost 6% of the voting and 270 Assembly members, being the great surprise of the election.
Parties
The main political forces involved in the election were:
- United People Alliance (APU)
- Democratic and Social Center (CDS)
- Democratic Renewal Party (PRD)
- Socialist Party (PS)
- Social Democratic Party (PSD)
National summary of votes and seats
Municipal Councils
| Parties | Votes | % | Candidacies | Councillors | Mayors | ||||
|---|---|---|---|---|---|---|---|---|---|
| # | ± | # | ± | ||||||
| Social Democratic | 1,633,247 | 34.19 | 819 | 149 | |||||
| Socialist | 1,318,287 | 27.60 | 574 | 79 | |||||
| United People Alliance | 935,897 | 19.59 | 303 | 47 | |||||
| Democratic and Social Centre | 466,965 | 9.78 | 222 | 27 | |||||
| Democratic Renewal | 224,161 | 4.69 | 49 | — | 3 | — | |||
| People's Democratic Union | 28,701 | 0.60 | 3 | 0 | |||||
| People's Monarchist | 23,968 | 0.50 | 3 | 0 | |||||
| Portuguese Workers' Communist | 10,967 | 0.23 | 0 | 0 | |||||
| Christian Democratic | 7,910 | 0.17 | 2 | 0 | |||||
| Workers Party of Socialist Unity | 2,324 | 0.05 | 0 | 0 | |||||
| Total valid | 4,631,497 | 96.97 | — | 1,975 | 305 | ||||
| Blank ballots | 73,784 | 1.54 | |||||||
| Invalid ballots | 71,126 | 1.49 | |||||||
| Total (turnout 63.02%) | 4,776,407 | 100.00 | |||||||
Municipal Assemblies
| Parties | Votes | % | Candidacies | Mandates | |||||
|---|---|---|---|---|---|---|---|---|---|
| # | ± | ||||||||
| Social Democratic | 1,391,500 | 29.59 | 2,509 | ||||||
| Socialist | 1,142,381 | 24.30 | 1,796 | ||||||
| United People Alliance | 953,935 | 20.29 | 1,056 | ||||||
| Democratic and Social Centre | 761,855 | 16.20 | 1,015 | ||||||
| Democratic Renewal | 245,830 | 5.22 | 273 | — | |||||
| People's Democratic Union | 31,899 | 0.68 | 14 | ||||||
| People's Monarchist | 15,949 | 0.34 | 7 | ||||||
| Portuguese Workers' Communist | 6,396 | 0.14 | 0 | ||||||
| Christian Democratic | 4,002 | 0.09 | 2 | ||||||
| Socialist League of the Workers | 783 | 0.02 | 0 | — | |||||
| Workers Party of Socialist Unity | 254 | 0.00 | 0 | ||||||
| Total valid | 4,543,206 | 96.62 | — | 6,672 | |||||
| Blank ballots | 88,935 | 1.89 | |||||||
| Invalid ballots | 69,854 | 1.48 | |||||||
| Total (turnout 63.16%) | 4,701,995 | 100.00 | |||||||
Parish Assemblies
| Parties | Votes | % | Candidacies | Mandates | Presidents | ||||
|---|---|---|---|---|---|---|---|---|---|
| # | ± | # | ± | ||||||
| Social Democratic | 1,584,427 | 32.85 | 13,118 | ||||||
| Socialist | 1,303,425 | 27.02 | 9,039 | ||||||
| United People Alliance | 993,767 | 20.60 | 3,676 | ||||||
| Democratic and Social Centre | 507,499 | 10.52 | 4,531 | ||||||
| Democratic Renewal | 164,345 | 3.41 | 726 | — | — | ||||
| Independents | 67,601 | 1.40 | 797 | ||||||
| People's Democratic Union | 28,572 | 0.59 | 26 | ||||||
| Portuguese Workers' Communist | 4,153 | 0.09 | 0 | ||||||
| People's Monarchist | 2,585 | 0.05 | 24 | ||||||
| Christian Democratic | 1,021 | 0.02 | 4 | ||||||
| Workers Party of Socialist Unity | 792 | 0.02 | 0 | ||||||
| Total valid | 4,658,187 | 96.67 | — | 31,941 | — | ' | — | ||
| Blank ballots | 84,797 | 1.77 | |||||||
| Invalid ballots | 80,766 | 1.67 | |||||||
| Total (turnout 63.52%) | 4,823,750 | 100.00 | |||||||
End notes
- The source of the voting data is the STAPE
Further Notes:
- United People Alliance (APU) was composed by the Portuguese Communist Party (PCP) and the Portuguese Democratic Movement (MDP/CDE).
- The number of candidacies expresses the number of municipalities or parishes in which the party or coalition presented lists.
- The number of mandates expresses the number of municipal deputies in the Municipal Assembly election and the number of parish deputies in the Parish Assembly election.
- The turnout varies because one may choose not to vote for all the organs.
See also
References
- ↑ Cities where the PSD contested alone. Not with coalitions with CDS or PPM.
External links
| Presidential elections | |
|---|---|
| Parliamentary elections |
|
| Local elections | |
| European elections | |
| Referendums | |
| |