Portuguese legislative election, 1983
|
| ||||||||||||||||||||||||||||||||||||||||||||||||||||||||||||||||||||||||||
| ||||||||||||||||||||||||||||||||||||||||||||||||||||||||||||||||||||||||||
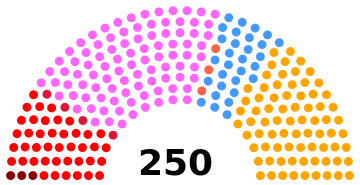
250 seats to the Portuguese Assembly 125 seats needed for a majority | ||||||||||||||||||||||||||||||||||||||||||||||||||||||||||||||||||||||||||
|---|---|---|---|---|---|---|---|---|---|---|---|---|---|---|---|---|---|---|---|---|---|---|---|---|---|---|---|---|---|---|---|---|---|---|---|---|---|---|---|---|---|---|---|---|---|---|---|---|---|---|---|---|---|---|---|---|---|---|---|---|---|---|---|---|---|---|---|---|---|---|---|---|---|---|
| Registered |
7,337,064 | |||||||||||||||||||||||||||||||||||||||||||||||||||||||||||||||||||||||||
| Turnout |
5,707,695 (77.8%) | |||||||||||||||||||||||||||||||||||||||||||||||||||||||||||||||||||||||||
| ||||||||||||||||||||||||||||||||||||||||||||||||||||||||||||||||||||||||||
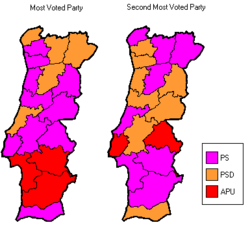 The first and the second most voted parties in each district (Azores and Madeira are not shown) | ||||||||||||||||||||||||||||||||||||||||||||||||||||||||||||||||||||||||||
| ||||||||||||||||||||||||||||||||||||||||||||||||||||||||||||||||||||||||||
.jpg)

.jpg)
| This article is part of the series: |
| Politics and government of Portugal |
|---|
 |
| Portugal |
The Portuguese legislative election of 1983 took place on 25 April. The last election, in October 1980 had been won by a right-wing coalition, the Democratic Alliance and Francisco Sá Carneiro had retained office as Prime Minister with an increased majority.
However, Sá Carneiro, along with other important members of the coalition, died in an aircrash only two months after the election, on 5 December 1980. Such happenings caused a massive political instability and Francisco Pinto Balsemão, a senior official of the Social Democratic Party, the largest party in the Alliance, became Prime Minister. But Balsemão lacked support from such senior members of his party as Aníbal Cavaco Silva, and several ministers resigned. Moreover, the right-wing policy was criticized by the left-wing and by the trade unions, and in February, the General Confederation of the Portuguese Workers, with the support of the Communists, called for a general strike that shook the government. The wave of resignations among Balsemão's ministers continued and by the end of the year, he also resigned. Because no one inside the Social Democratic Party accepted the office of Prime Minister, the President Ramalho Eanes dissolved the Parliament and called an election for April.
The election was won by the Socialist Party with 36%, and Mário Soares was nominated Prime Minister. However, the Socialists lacked a majority in the Assembly of the Republic and were forced to form a coalition with the Social Democrats, in what was called the "Central Block". Although this coalition allowed Soares to govern, several members of both parties were against it, and internal attacks led to the collapse of the coalition after less than two years. In the election that followed, the Communist-dominated United People Alliance lost 3 MPs and the Democratic and Social Center, after the dissolution of the Democratic Alliance, was now alone in the Parliament with 30 MPs, a loss of 16. The election marked the beginning of a process of bi-polarization of Portuguese politics.
This was the last legislative election to be won by the Socialist Party until 1995.
Electoral system
The Parliament of the Portuguese Republic consists of a single chamber, the Assembly of the Republic, composed of 250 members directly elected by universal adult suffrage for a maximum term of four years. Assembly members represent the entire country, rather than the constituencies in which they were elected. Governments require majority support in the Assembly in order to remain in office.
Each one of Portugal's eighteen administrative districts, as well as each one of the country's two autonomous regions - the Azores and Madeira - is an electoral constituency. Portuguese voters residing outside the national territory are grouped into two electoral constituencies - Europe and the rest of the world - each one of which elects two Assembly members. The remaining 246 seats are allocated among the national territory constituencies in proportion to their number of registered electors.
Political parties and party coalitions may present lists of candidates. The lists are closed, so electors may not choose individual candidates in or alter the order of such lists. Electors cast a ballot for a single list. The seats in each constituency are divided among parties according to the largest average method of proportional representation (PR), conceived by the Belgian mathematician Victor d'Hondt in 1899. Although there is no statutory threshold for participation in the allocation of Assembly seats, there is an effective threshold at the constituency level that depends on the district magnitude.[3] The use of the d'Hondt method makes for a higher effective threshold than certain other allocation method such as the Hare quota or Sainte-Laguë method, which are more generous to small parties.[4]
Parties
The major parties involved and the respective leaders:
- United People Alliance (APU), Álvaro Cunhal
- Socialist Party (PS), Mário Soares
- Social Democratic Party (PSD), Mota Pinto
- Democratic and Social Center (CDS), Lucas Pires
Mário Soares, leader of the Socialist Party, was nominated Prime Minister.
National summary of votes and seats
 | ||||||||||
| Parties | Votes | % | ± | Seats | MPs %/ votes % | |||||
|---|---|---|---|---|---|---|---|---|---|---|
| 1980 | 1983 | ± | % | ± | ||||||
| Socialist[A] | 2,061,309 | 36.11 | 741 | 101 | 40.40 | 1.12 | ||||
| Social Democratic[B] | 1,554,804 | 27.24 | N/A | 82 | 75 | 30.00 | 1.10 | |||
| United People Alliance[C] | 1,031,609 | 18.07 | 41 | 44 | 17.60 | 0.97 | ||||
| Democratic and Social Centre[B] | 716,705 | 12.56 | N/A | 46 | 30 | 12.00 | 0.96 | |||
| Christian Democratic | 39,180 | 0.69 | N/A | N/A | 0 | N/A | 0.00 | N/A | 0.0 | |
| People's Monarchist[B] | 27,635 | 0.48 | N/A | 6 | 0 | 0.00 | 0.0 | |||
| People's Democratic Union | 27,260 | 0.48 | 1 | 0 | 0.00 | 0.0 | ||||
| People's Democratic Union / PSR | 25,222 | 0.44 | N/A | N/A | 0 | N/A | 0.00 | N/A | 0.0 | |
| Portuguese Workers' Communist | 20,995 | 0.37 | 0 | 0 | 0.00 | 0.0 | ||||
| Workers Party of Socialist Unity | 19,657 | 0.34 | 0 | 0 | 0.00 | 0.0 | ||||
| Revolutionary Socialist | 13,327 | 0.23 | 0 | 0 | 0.00 | 0.0 | ||||
| Socialist Workers League | 11,500 | 0.20 | N/A | N/A | 0 | N/A | 0.00 | N/A | 0.0 | |
| OCMLP | 6,113 | 0.11 | 0 | 0 | 0.00 | 0.0 | ||||
| Democratic Party of the Atlantic | 5,523 | 0.10 | 0 | 0 | 0.00 | 0.0 | ||||
| Communist Party (Reconstructed)[D] | 86 | 0.00 | N/A | N/A | 0 | N/A | 0.00 | N/A | 0.0 | |
| Total valid | 5,561,011 | 97.43 | 250 | 250 | 100.00 | — | ||||
| Blank ballots | 42,494 | 0.74 | ||||||||
| Invalid ballots | 104,276 | 1.83 | ||||||||
| Total (turnout 77.79%) | 5,707,695 | 100.00 | ||||||||
| A The Socialist Party contested the 1980 election in a coalition (Republican and Socialist Front). B The Social Democratic Party, the Democratic and Social Centre and the People's Monarchist Party contested, together, the 1980 election in a coalition (Democratic Alliance). C Portuguese Communist Party (41 MPs) and Portuguese Democratic Movement (3 MPs) ran in coalition.[5] D Communist Party (Reconstructed) list only in Europe and Rest of the World. | ||||||||||
| Source: Comissão Nacional de Eleições, Mapa oficial. D.R. n.º 121, Suplemento, Série I de 1983-05-26 | ||||||||||
1 Socialist Party results are compared to the combined totals of the Republican and Socialist Front in the 1980 election.
Distribution by constituency
| Constituency | % | S | % | S | % | S | % | S | Total S |
|---|---|---|---|---|---|---|---|---|---|
| PS | PSD | APU | CDS | ||||||
| Azores | 31.1 | 2 | 54.4 | 3 | 3.1 | - | 4.7 | - | 5 |
| Aveiro | 36.6 | 6 | 34.8 | 6 | 7.0 | 1 | 16.4 | 2 | 15 |
| Beja | 28.0 | 2 | 11.8 | - | 49.4 | 3 | 4.1 | - | 5 |
| Braga | 39.7 | 7 | 27.0 | 5 | 8.8 | 1 | 18.3 | 3 | 16 |
| Bragança | 30.4 | 1 | 35.8 | 2 | 4.8 | - | 20.9 | 1 | 4 |
| Castelo Branco | 37.1 | 3 | 30.6 | 2 | 11.3 | - | 13.2 | 1 | 6 |
| Coimbra | 45.3 | 6 | 27.8 | 3 | 10.7 | 1 | 10.2 | 1 | 11 |
| Évora | 23.9 | 1 | 18.6 | 1 | 47.6 | 3 | 4.5 | - | 5 |
| Faro | 43.2 | 5 | 23.1 | 2 | 18.6 | 2 | 7.4 | - | 9 |
| Guarda | 33.5 | 2 | 31.5 | 2 | 4.9 | - | 23.8 | 1 | 5 |
| Leiria | 32.7 | 4 | 35.6 | 4 | 9.5 | 1 | 16.2 | 2 | 11 |
| Lisbon | 35.8 | 21 | 21.8 | 13 | 25.3 | 15 | 11.7 | 7 | 56 |
| Madeira | 24.4 | 1 | 56.2 | 4 | 2.8 | - | 8.2 | - | 5 |
| Portalegre | 38.5 | 2 | 19.1 | 1 | 28.7 | 1 | 7.5 | - | 4 |
| Porto | 43.0 | 18 | 26.2 | 10 | 13.6 | 5 | 12.5 | 5 | 38 |
| Santarém | 38.4 | 5 | 24.7 | 3 | 20.0 | 3 | 10.0 | 1 | 12 |
| Setúbal | 30.6 | 6 | 12.7 | 2 | 45.8 | 8 | 5.1 | 1 | 17 |
| Viana do Castelo | 32.5 | 2 | 32.6 | 3 | 9.9 | - | 18.4 | 1 | 6 |
| Vila Real | 32.3 | 2 | 42.0 | 3 | 5.4 | - | 12.7 | 1 | 6 |
| Viseu | 30.9 | 4 | 36.6 | 4 | 4.6 | - | 20.7 | 2 | 10 |
| Europe | 33.6 | 1 | 31.2 | 1 | 17.1 | - | 11.1 | - | 2 |
| Rest of the World | 7.0 | - | 48.2 | 1 | 2.8 | - | 34.1 | 1 | 2 |
| Total | 36.1 | 101 | 27.2 | 75 | 18.1 | 44 | 12.6 | 30 | 250 |
| Source: Comissão Nacional de Eleições | |||||||||
Maps
.png) Most voted political force by municipality.
Most voted political force by municipality.
Notes
References
- ↑ Fundação Mário Soares
- ↑ Diário da Républica, 26 de Maio de 1983 - Lista de candidatos eleitos
- ↑ "Effective threshold in electoral systems". Trinity College, Dublin. Retrieved 2015-10-21.
- ↑ Gallaher, Michael (1992). "Comparing Proportional Representation Electoral Systems: Quotas, Thresholds, Paradoxes and Majorities"
- ↑ "Electoral results - Assembly of the Republic". Archived from the original on 2012-07-16. Retrieved 2012-09-02.
External links
See also
| Presidential elections | |
|---|---|
| Parliamentary elections |
|
| Local elections | |
| European elections | |
| Referendums | |
| |