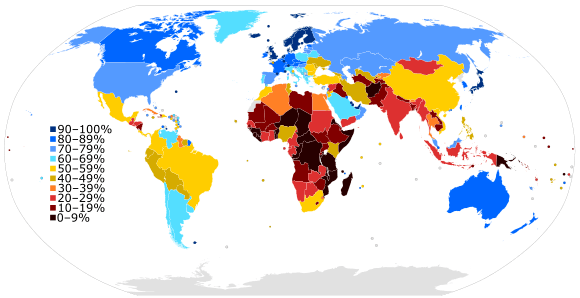
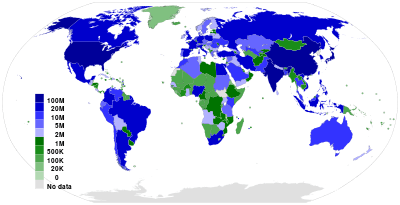
Below is a sortable list of countries by number of Internet users as of 2016. Internet users are defined as persons who accessed the Internet in the last 12 months from any device, including mobile phones.[Note 1] The percentages on the list are the percentages of each country's population that are Internet users. Estimates are derived from either household surveys or from Internet subscription data.[4]
All United Nations member states are listed. A disputed territory, Taiwan, is listed as a sovereign country.
|
|
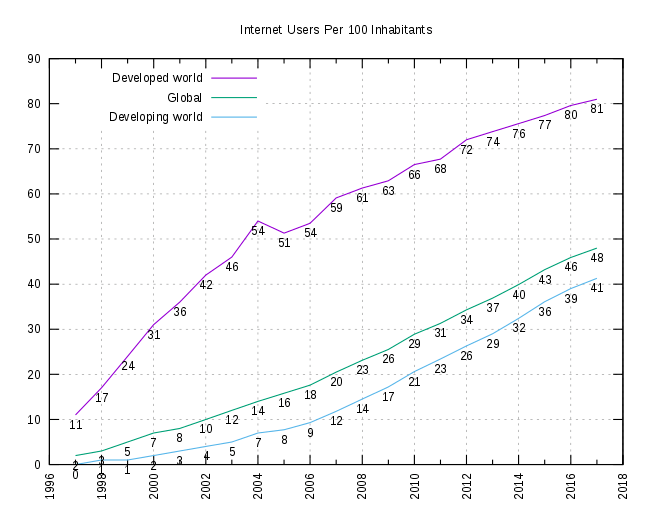
Internet users by region
| |
2005 |
2010 |
2017a |
| Africa |
2% |
10% |
21.8% |
| Americas |
36% |
49% |
65.9% |
| Arab States |
8% |
26% |
43.7% |
| Asia and Pacific |
9% |
23% |
43.9% |
Commonwealth of
Independent States |
10% |
34% |
67.7% |
| Europe |
46% |
67% |
79.6% |
a Estimate.
Source: International Telecommunication Union.[7] |
|
List
| Country or area |
Internet
users |
Rank |
Percentage |
Rank |
|---|
 China China |
772,000,000 |
1 |
54.6% |
109 |
 India India |
462,124,989 |
2 |
34.1% |
143 |
 United States United States |
245,436,423 |
3 |
76.18% |
54 |
 Indonesia Indonesia |
143,260,000 |
4 |
53.7% |
157 |
 Brazil Brazil |
123,927,230 |
5 |
59.68% |
90 |
 Japan Japan |
118,626,672 |
6 |
93.3% |
15 |
 Russia Russia |
110,003,284 |
7 |
76.41% |
53 |
 Bangladesh Bangladesh |
80,483,000 |
8 |
48.4% |
175 |
 Mexico Mexico |
75,937,568 |
9 |
59.54% |
92 |
 Germany Germany |
73,436,503 |
10 |
89.65% |
20 |
 Philippines Philippines |
67,000,000 |
11 |
62.9% |
101 |
 Vietnam Vietnam |
64,000,000 |
12 |
66.3% |
120 |
 United Kingdom United Kingdom |
62,354,410 |
13 |
94.78% |
11 |
 Thailand Thailand |
57,000,000 |
14 |
82.4% |
116 |
 France France |
55,413,854 |
15 |
85.62% |
29 |
 Nigeria Nigeria |
47,743,541 |
16 |
25.67% |
153 |
 South Korea South Korea |
47,353,649 |
17 |
92.72% |
14 |
 Turkey Turkey |
46,395,500 |
18 |
58.35% |
95 |
 Pakistan Pakistan |
44,608,065 |
19 |
22.2% |
179 |
 Iran Iran |
42,731,675 |
20 |
53.23% |
107 |
 Egypt Egypt |
37,519,531 |
21 |
39.21% |
130 |
 Spain Spain |
37,337,607 |
22 |
80.56% |
35 |
 Italy Italy |
36,442,438 |
23 |
61.32% |
86 |
 Canada Canada |
32,602,776 |
24 |
89.84% |
19 |
 Argentina Argentina |
30,758,972 |
25 |
70.15% |
70 |
 South Africa South Africa |
30,248,355 |
26 |
54.00% |
106 |
 Colombia Colombia |
28,287,098 |
27 |
58.14% |
97 |
 Poland Poland |
28,018,492 |
28 |
73.30% |
62 |
 Malaysia Malaysia |
25,084,255 |
29 |
78.79% |
45 |
 Saudi Arabia Saudi Arabia |
23,803,319 |
30 |
73.75% |
61 |
 Ukraine Ukraine |
23,321,390 |
31 |
52.48% |
110 |
 Australia Australia |
21,288,648 |
32 |
88.24% |
23 |
 Taiwan Taiwan |
20,821,364 |
33 |
87.9% |
41 |
 Morocco Morocco |
20,555,783 |
34 |
58.27% |
96 |
 Venezuela Venezuela |
18,940,907 |
35 |
60.00% |
88 |
 Myanmar Myanmar |
18,000,000 |
36 |
25.07% |
159 |
 Algeria Algeria |
17,440,299 |
37 |
42.95% |
126 |
 Nepal Nepal |
16,190,000 |
38 |
54.7% |
173 |
 Ethiopia Ethiopia |
15,739,371 |
39 |
15.37% |
180 |
 Netherlands Netherlands |
15,358,245 |
40 |
90.41% |
18 |
 Uzbekistan Uzbekistan |
14,713,955 |
41 |
46.79% |
117 |
 Peru Peru |
14,444,387 |
42 |
45.46% |
122 |
 Kazakhstan Kazakhstan |
14,063,513 |
43 |
76.80% |
51 |
 Kenya Kenya |
12,600,007 |
44 |
26.00% |
152 |
 Chile Chile |
11,822,229 |
45 |
66.01% |
82 |
 Romania Romania |
11,767,959 |
46 |
59.50% |
93 |
 Sudan Sudan |
11,082,072 |
47 |
28.00% |
147 |
.svg.png) Belgium Belgium |
9,827,270 |
48 |
86.52% |
28 |
 Ghana Ghana |
9,779,273 |
49 |
34.67% |
134 |
 Uganda Uganda |
9,077,567 |
50 |
21.88% |
167 |
 Sweden Sweden |
9,002,326 |
51 |
91.51% |
16 |
 Ecuador Ecuador |
8,857,767 |
52 |
54.06% |
104 |
 United Arab Emirates United Arab Emirates |
8,398,268 |
53 |
90.60% |
17 |
 Czech Republic Czech Republic |
8,115,252 |
54 |
76.48% |
52 |
 Iraq Iraq |
7,898,106 |
55 |
21.23% |
169 |
 Hungary Hungary |
7,730,451 |
56 |
79.26% |
43 |
 Greece Greece |
7,726,829 |
57 |
69.09% |
74 |
 Azerbaijan Azerbaijan |
7,605,244 |
58 |
78.20% |
47 |
 Switzerland Switzerland |
7,511,995 |
59 |
89.41% |
21 |
 Austria Austria |
7,346,074 |
60 |
84.32% |
30 |
 Portugal Portugal |
7,303,699 |
61 |
70.42% |
69 |
 Tanzania Tanzania |
7,224,386 |
62 |
13.00% |
184 |
 Yemen Yemen |
6,780,200 |
63 |
24.58% |
161 |
 Belarus Belarus |
6,741,258 |
64 |
71.11% |
67 |
 Sri Lanka Sri Lanka |
6,710,160 |
65 |
32.05% |
138 |
 Israel Israel |
6,535,440 |
66 |
79.78% |
40 |
 Dominican Republic Dominican Republic |
6,530,903 |
67 |
61.33% |
85 |
 Hong Kong Hong Kong |
6,375,381 |
68 |
87.30% |
25 |
 Ivory Coast Ivory Coast |
6,286,527 |
69 |
26.53% |
151 |
 Serbia Serbia |
5,914,748 |
70 |
67.06% |
77 |
 Jordan Jordan |
5,890,965 |
71 |
62.30% |
83 |
 Syria Syria |
5,873,785 |
72 |
31.87% |
139 |
 Cameroon Cameroon |
5,859,797 |
73 |
25.00% |
160 |
 Tunisia Tunisia |
5,801,972 |
74 |
50.88% |
112 |
 Guatemala Guatemala |
5,722,610 |
75 |
34.51% |
135 |
 Denmark Denmark |
5,538,800 |
76 |
96.97% |
8 |
 Norway Norway |
5,112,817 |
77 |
97.30% |
7 |
 Mozambique Mozambique |
5,050,924 |
78 |
17.52% |
178 |
 Democratic Republic of the Congo Democratic Republic of the Congo |
4,889,515 |
79 |
6.21% |
200 |
 Singapore Singapore |
4,839,204 |
80 |
83.6% |
34 |
 Finland Finland |
4,826,246 |
81 |
87.70% |
24 |
 Lebanon Lebanon |
4,571,675 |
82 |
76.11% |
55 |
 Cuba Cuba |
4,449,238 |
83 |
38.77% |
131 |
 Slovakia Slovakia |
4,381,507 |
84 |
80.48% |
36 |
 Bolivia Bolivia |
4,322,489 |
85 |
39.70% |
129 |
 Bulgaria Bulgaria |
4,266,773 |
86 |
59.83% |
89 |
 Zambia Zambia |
4,232,464 |
87 |
25.51% |
156 |
 New Zealand New Zealand |
4,123,439 |
88 |
88.47% |
22 |
 Cambodia Cambodia |
4,030,438 |
89 |
25.57% |
155 |
 Senegal Senegal |
3,954,620 |
90 |
25.66% |
154 |
 Ireland Ireland |
3,883,418 |
91 |
82.17% |
31 |
 Angola Angola |
3,745,750 |
92 |
13.00% |
185 |
 Zimbabwe Zimbabwe |
3,733,964 |
93 |
23.12% |
165 |
 Afghanistan Afghanistan |
3,673,539 |
94 |
10.6% |
192 |
 Paraguay Paraguay |
3,453,445 |
95 |
51.35% |
111 |
 Costa Rica Costa Rica |
3,207,258 |
96 |
66.03% |
81 |
 Kuwait Kuwait |
3,176,010 |
97 |
78.37% |
46 |
 Oman Oman |
3,089,369 |
98 |
69.82% |
72 |
 Croatia Croatia |
3,063,044 |
99 |
72.70% |
65 |
 Puerto Rico Puerto Rico |
2,946,059 |
100 |
80.32% |
37 |
 Palestinian Authority Palestinian Authority |
2,930,953 |
101 |
61.18% |
87 |
 Moldova Moldova |
2,882,322 |
102 |
71.00% |
68 |
 Honduras Honduras |
2,733,860 |
103 |
30.00% |
141 |
 Burkina Faso Burkina Faso |
2,603,042 |
104 |
13.96% |
181 |
 Bosnia and Herzegovina Bosnia and Herzegovina |
2,438,208 |
105 |
69.33% |
73 |
 Qatar Qatar |
2,423,068 |
106 |
94.29% |
12 |
 Rwanda Rwanda |
2,383,501 |
107 |
20.00% |
172 |
 Uruguay Uruguay |
2,286,820 |
108 |
66.40% |
79 |
 Panama Panama |
2,178,424 |
109 |
54.00% |
105 |
 Lithuania Lithuania |
2,163,155 |
110 |
74.38% |
59 |
 Kyrgyzstan Kyrgyzstan |
2,054,728 |
111 |
34.50% |
136 |
 Mali Mali |
1,999,226 |
112 |
11.11% |
190 |
 Georgia Georgia |
1,962,702 |
113 |
50.00% |
113 |
 Albania Albania |
1,941,925 |
114 |
66.36% |
80 |
 El Salvador El Salvador |
1,839,969 |
115 |
29.00% |
145 |
 Armenia Armenia |
1,813,386 |
116 |
62.00% |
84 |
 Tajikistan Tajikistan |
1,788,044 |
117 |
20.47% |
170 |
 Malawi Malawi |
1,738,600 |
118 |
9.61% |
194 |
 Latvia Latvia |
1,574,256 |
119 |
79.89% |
39 |
 Slovenia Slovenia |
1,568,786 |
120 |
75.50% |
57 |
 Nicaragua Nicaragua |
1,511,037 |
121 |
24.57% |
162 |
 Macedonia Macedonia |
1,501,798 |
122 |
72.16% |
66 |
 Laos Laos |
1,478,051 |
123 |
21.87% |
168 |
 Bahrain Bahrain |
1,396,668 |
124 |
98.00% |
3 |
 Haiti Haiti |
1,326,629 |
125 |
12.23% |
186 |
 Benin Benin |
1,303,589 |
126 |
11.99% |
187 |
 Jamaica Jamaica |
1,296,610 |
127 |
45.00% |
124 |
 Libya Libya |
1,275,642 |
128 |
20.27% |
171 |
 Guinea Guinea |
1,214,801 |
129 |
9.80% |
193 |
 Madagascar Madagascar |
1,172,533 |
130 |
4.71% |
203 |
 Estonia Estonia |
1,144,974 |
131 |
87.24% |
26 |
 Turkmenistan Turkmenistan |
1,018,691 |
132 |
17.99% |
177 |
 Trinidad and Tobago Trinidad and Tobago |
1,000,517 |
133 |
73.30% |
63 |
 Gabon Gabon |
951,287 |
134 |
48.05% |
115 |
 Niger Niger |
893,073 |
135 |
4.32% |
204 |
 Cyprus Cyprus |
888,125 |
136 |
75.90% |
56 |
 Botswana Botswana |
885,702 |
137 |
27.50% |
149 |
 Sierra Leone Sierra Leone |
870,532 |
138 |
11.77% |
188 |
 Togo Togo |
860,280 |
139 |
11.31% |
189 |
 South Sudan South Sudan |
819,459 |
140 |
6.70% |
199 |
 Papua New Guinea Papua New Guinea |
776,159 |
141 |
9.60% |
195 |
 Mauritania Mauritania |
774,183 |
142 |
18.00% |
176 |
 Namibia Namibia |
769,455 |
143 |
31.03% |
140 |
 Chad Chad |
722,627 |
144 |
5.00% |
202 |
 Mongolia Mongolia |
674,201 |
145 |
22.27% |
166 |
 Mauritius Mauritius |
671,833 |
146 |
53.23% |
108 |
 Lesotho Lesotho |
602,965 |
147 |
27.36% |
150 |
 Luxembourg Luxembourg |
561,295 |
148 |
97.49% |
6 |
 Burundi Burundi |
544,097 |
149 |
5.17% |
201 |
 Macau Macau |
499,773 |
150 |
81.64% |
32 |
 Montenegro Montenegro |
439,276 |
151 |
69.88% |
71 |
 Fiji Fiji |
418,013 |
152 |
46.51% |
119 |
 Republic of the Congo Republic of the Congo |
416,217 |
153 |
8.12% |
196 |
 Swaziland Swaziland |
383,723 |
154 |
28.57% |
146 |
 The Gambia The Gambia |
377,123 |
155 |
18.50% |
174 |
 Liberia Liberia |
337,732 |
156 |
7.32% |
198 |
 Bhutan Bhutan |
333,226 |
157 |
41.77% |
127 |
 Malta Malta |
331,853 |
158 |
77.29% |
48 |
 Iceland Iceland |
326,622 |
159 |
98.24% |
1 |
 Timor Leste Timor Leste |
320,339 |
160 |
25.25% |
158 |
 Brunei Brunei |
317,397 |
161 |
75.00% |
58 |
 The Bahamas The Bahamas |
312,986 |
162 |
80.00% |
38 |
 Equatorial Guinea Equatorial Guinea |
290,470 |
163 |
23.78% |
164 |
 Guyana Guyana |
275,760 |
164 |
35.66% |
133 |
 Somalia Somalia |
269,178 |
165 |
1.88% |
207 |
 Cabo Verde Cabo Verde |
259,906 |
166 |
48.17% |
114 |
 Suriname Suriname |
253,499 |
167 |
45.40% |
123 |
 Maldives Maldives |
252,761 |
168 |
59.09% |
94 |
 Barbados Barbados |
226,715 |
169 |
79.55% |
42 |
 New Caledonia New Caledonia |
194,707 |
170 |
74.00% year 2015 |
60 |
 French Polynesia French Polynesia |
191,774 |
171 |
68.44% |
76 |
 Central African Republic Central African Republic |
183,785 |
172 |
4.00% |
205 |
 Belize Belize |
163,588 |
173 |
44.58% |
125 |
 Guam Guam |
125,446 |
174 |
77.01% |
49 |
 Djibouti Djibouti |
123,728 |
175 |
13.13% |
183 |
 Aruba Aruba |
98,051 |
176 |
93.54% |
13 |
 Saint Lucia Saint Lucia |
83,186 |
177 |
46.73% |
118 |
 Andorra Andorra |
75,681 |
178 |
97.93% |
5 |
 Antigua and Barbuda Antigua and Barbuda |
73,702 |
179 |
73.00% |
64 |
 Guinea-Bissau Guinea-Bissau |
68,270 |
180 |
3.76% |
206 |
 Solomon Islands Solomon Islands |
65,936 |
181 |
11.00% |
191 |
 Vanuatu Vanuatu |
64,896 |
182 |
24.00% |
163 |
 Comoros Comoros |
63,170 |
183 |
7.94% |
197 |
 U.S. Virgin Islands U.S. Virgin Islands |
62,539 |
184 |
59.61% |
91 |
 Saint Vincent and the Grenadines Saint Vincent and the Grenadines |
60,929 |
185 |
55.57% |
100 |
 Bermuda Bermuda |
60,432 |
186 |
98.00% |
4 |
 Grenada Grenada |
59,947 |
187 |
55.86% |
99 |
 Eritrea Eritrea |
58,465 |
188 |
1.18% |
208 |
 Samoa Samoa |
57,386 |
189 |
29.41% |
144 |
 São Tomé and Príncipe São Tomé and Príncipe |
55,974 |
190 |
28.00% |
148 |
 Seychelles Seychelles |
53,248 |
191 |
56.51% |
98 |
 Dominica Dominica |
49,296 |
192 |
67.03% |
78 |
 Cayman Islands Cayman Islands |
48,004 |
193 |
79.00% |
44 |
 Faroe Islands Faroe Islands |
46,715 |
194 |
95.11% |
10 |
 Tonga Tonga |
42,795 |
195 |
39.95% |
128 |
 Saint Kitts and Nevis Saint Kitts and Nevis |
42,113 |
196 |
76.82% |
50 |
 Jersey Jersey |
38,958 |
197 |
41.03% year 2012 |
- |
 Greenland Greenland |
38,642 |
198 |
68.50% |
75 |
 Liechtenstein Liechtenstein |
36,946 |
199 |
98.09% |
2 |
 Monaco Monaco |
36,654 |
200 |
95.21% |
9 |
 Micronesia, Federated States of Micronesia, Federated States of |
34,996 |
201 |
33.35% |
137 |
 Gibraltar Gibraltar |
32,494 |
202 |
94.44% |
- |
 San Marino San Marino |
16,484 |
203 |
54.21% year 2009 |
103 |
 Marshall Islands Marshall Islands |
15,808 |
204 |
29.79% |
142 |
 Kiribati Kiribati |
15,672 |
205 |
13.70% |
182 |
 British Virgin Islands British Virgin Islands |
14,456 |
206 |
37.60% year 2012 |
132 |
 Anguilla Anguilla |
12,043 |
207 |
81.57% |
33 |
 Tuvalu Tuvalu |
5,106 |
208 |
46.01% |
121 |
 Saint Helena Saint Helena |
2,906 |
209 |
37.6% year 2012 |
- |
 Falkland Islands Falkland Islands |
2,881 |
210 |
99.02% |
- |
 Montserrat Montserrat |
2,833 |
211 |
54.60% year 2013 |
102 |
| Wallis and Futuna |
1,383 |
212 |
8.95% year 2012 |
- |
 Niue Niue |
1,034 |
213 |
86.90% year 2013 |
27 |
 Ascension Ascension |
361 |
214 |
41.0% year 2012 |
- |
See also
- ↑ The data for the number of Internet users is based on multiplying an estimate for the percentage of people using the Internet in a given country from one source (usually the ITU) by the population from another source (usually the U.S. Census Bureau). There are not enough significant figures in the percentage estimate for the precise Internet user counts found in the table to be meaningful. As a result, they should not be treated as precise figures or even precise estimates.
References
- ↑ "Individuals using the Internet 2005 to 2014", Key ICT indicators for developed and developing countries and the world (totals and percentage rates), International Telecommunication Union (ITU). Retrieved 25 May 2015.
- ↑ "Internet users per 100 inhabitants 1997 to 2007", ICT Data and Statistics (IDS), International Telecommunication Union (ITU). Retrieved 25 May 2015.
- 1 2 "Percentage of Individuals using the Internet 2000-2012", International Telecommunications Union (Geneva), June 2013, retrieved 22 June 2013
- ↑ "Definitions of World Telecommunication/ICT Indicators, March 2010" (PDF). International Telecommunication Union (Geneva). March 2010. Archived from the original (PDF) on 20 December 2014. Retrieved 28 October 2015 – via Internet Archive.
- ↑ "Total Midyear Population for the World: 1950-2050"". International Programs Center for Demographic and Economic Studies, U.S. Census Bureau. Archived from the original on 2017-04-17. Retrieved 2018-10-07.
- ↑ "ICT Facts and Figures 2005, 2010, 2017". Telecommunication Development Bureau, International Telecommunication Union (ITU). Retrieved 2018-10-07.
- ↑ "ICT Facts and Figures 2005, 2010, 2017". Telecommunication Development Bureau, International Telecommunication Union (ITU). Retrieved 2018-10-07.
External links
|
|---|
| Sovereign states | |
|---|
States with limited
recognition | |
|---|
Dependencies and
other territories | |
|---|
|
|---|
| Indices | |
|---|
| Internet | |
|---|
| Phones | |
|---|
| Other | |
|---|
|