Net international investment position
The difference between a country's external financial assets and liabilities is its net international investment position (NIIP).[1] A country's external debt includes both its government debt and private debt, and similarly its public and privately held (by its legal residents) external assets are also taken into account when calculating its NIIP.[2] Note that commodities, as well as currencies tend to follow cyclical patterns, whereby they undergo significant valuation changes, of which is reflected in NIIP.
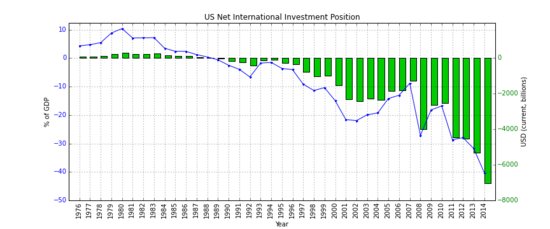
A country's international investment position (IIP) is a financial statement setting out the value and composition of that country's external financial assets and liabilities. A positive NIIP value indicates a nation is a creditor nation, while a negative value indicates it is a debtor nation. The USA, as recently as 1960 the world's largest creditor, has now become the world's largest debtor, and since the 1980s, Japan has replaced USA as the world's largest creditor nation.
List of countries and regions by net international investment position
| Countries and regions | Date | GDP[3]
(US$MM) |
Date | NIIP[4]
(US$MM) |
Date | NIIP
(%GDP) |
|---|---|---|---|---|---|---|
| 2017 | 341,659 | 2016 | +1,180,677 | 2016 | +284.0[5] | |
| 2017 | 579,302 | 2017 | +1,180,824[6] | 2017 | +203.8 | |
| 2017 | 323,902 | 2016 | +635,296 | 2014 | +182.0 | |
| 2017 | 396,457 | 2016 | +732,542 | 2014 | +170.9 | |
| 2017 | 678,575 | 2016 | +839,313 | 2014 | +119.6 | |
| 2017 | 683,827 | 2016 | +587,867 | 2014 | +106.6 | |
| 2017 | 825,745 | 2016 | +557,748 | 2016 | +75.9[7] | |
| 2017 | 4,872,135 | 2016 | +3,067,264 | 2015 | +63.8 | |
| 2017 | 324,484 | 2016 | +164,023 | 2016 | +56.1[7] | |
| 2017 | 3,684,816 | 2016 | +1,797,290 | 2016 | +54.4[7] | |
| 2017 | 494,733 | 2016 | +219,992 | 2016 | +49.5[7] | |
| 2017 | 12,011 | 2016(Q3) | +5,499 | 2016 | +47.4[7] | |
| 2017 | 350,609 | 2016 | +106,051 | 2017 | +43.3 | |
| 2017 | 210,085 | 2015 | +134,450 | 2014 | +30.5 | |
| 2017 | 62,393 | 2016 | +13,266 | 2016 | +23.2[7] | |
| 2017 | 1,538,030 | 2016 | +278,485 | 2016 | +19.8 | |
| 2017 | 1,527,469 | 2016 | +226,954 | 2016 | +17.9 | |
| 2017 | 538,575 | 2016 | +80,567 | 2016 | +16.7[7] | |
| 2017 | 12,014,610 | 2016(Q3) | +1,747,082 | 2016 | +15.8 | |
| 2017 | 637,717 | 2015 | +52,581 | 2016 | +10.2 | |
| 2017 | 253,244 | 2016 | +16,133 | 2016 | +7.1[7] | |
| 2017 | 1,652,412 | 2016 | +140,242 | 2014 | +6.9 | |
| 2017 | 416,845 | 2016 | +19,117 | 2016 | +5.2[7] | |
| 2017 | 2,624,529 | 2016 | +575,745 | 2016 | −1.1[7] | |
| 2017 | 376,284 | 2015 | -63,264 | 2014 | −10.6 | |
| | 2017 | 17,308,862 | 2016 | -663,998 | 2014 | −12.7[8] |
| 2017 | 313,419 | 2016 | -30,602 | 2014 | −14.3 | |
| 2017 | 1,937,894 | 2016(Q3) | -325,984 | 2016 | −14.9[7] | |
| 2017 | 160,839 | 2015(Q4) | -41,894 | 2014 | −15.2 | |
| 2017 | 2,583,560 | 2016 | -370,149 | 2016 | −15.8[7] | |
| 2017 | 2,611,012 | 2016 | -370,562 | 2016 | −16.2 | |
| 2017 | 277,041 | 2016(Q3) | -53,500 | 2016 | −17.7 | |
| 2017 | 213,189 | 2016 | -45,850 | 2016 | −24.9[7] | |
| 2017 | 2,054,969 | 2016 | -716,566 | 2014 | −33.1 | |
| 2017 | 1,149,236 | 2016 | -482,209 | 2014 | −33.3 | |
| 2017 | 48,868 | 2016 | -14,479 | 2016 | −34.5[7] | |
| 2017 | 25,973 | 2016 | -8,218 | 2016 | −37.3[7] | |
| 2017 | 47,263 | 2016 | -17,631 | 2016 | −43.3[7] | |
| 2017 | 19,390,600 | 2016 | -8,109,652 | 2016 | −43.4 | |
| 2017 | 1,015,411 | 2016 | -320,958 | 2014 | −47.2 | |
| 2017 | 211,315 | 2016 | -82,858 | 2016 | −49.6[7] | |
| 2017 | 56,943 | 2016(Q3) | -27,030 | 2016 | −51.3[7] | |
| 2017 | 849,480 | 2016 | -356,149 | 2014 | −54.7 | |
| 2017 | 1,379,548 | 2016 | -738,897 | 2014 | −55.6 | |
| 2017 | 95,938 | 2016 | -49,609 | 2016 | −58.1[7] | |
| 2017 | 30,319 | 2016 | -15,341 | 2016 | −58.2[7] | |
| 2017 | 152,284 | 2016 | -70,222 | 2016 | −58.9[7] | |
| 2017 | 523,886 | 2016 | -274,400 | 2016 | −61.9[7] | |
| 2017 | 201,486 | 2016(Q3) | -120,159 | 2014 | −64.7 | |
| 2017 | 54,516 | 2016(Q3) | -37,072 | 2016 | −71.2[7] | |
| 2017 | 1,313,951 | 2016 | -1,005,677 | 2017 | −80.8[7] | |
| 2017 | 218,064 | 2016 | -204,712 | 2016 | −105.1[7] | |
| 2017 | 21,310 | 2016 | -23,667 | 2016 | −125.4[7] | |
| 2017 | 200,690 | 2016 | -253,097 | 2016 | −136.5[7] | |
| 2017 | 333,994 | 2016 | -519,308 | 2016 | −185.3[7] | |
| 2017 | 23,909 | 2016 | +233 | 2014 | −398.2[9] | |
See also
References
- ↑ Bivens, L. Josh (December 14, 2004). "Debt and the dollar: The United States damages future living standards by borrowing itself into a deceptively deep hole". Epinet.org. Archived from the original on January 20, 2008. Retrieved 2009-06-28.
- ↑ Ministry of Economic and Finance of Argentina International Investment Position Methodology page.1
- ↑ "World Economic Outlook Database". International Monetary Fund. 17 April 2018.
- ↑ "IMF Data". data.imf.org. Retrieved 2018-08-18.
- ↑ Census and Statistics Department Hongkong International Investment Position at Year-End 2014
- ↑ Central Bank of the Republic of China (Taiwan)
- 1 2 3 4 5 6 7 8 9 10 11 12 13 14 15 16 17 18 19 20 21 22 23 24 25 26 27 28 "Net international investment position in % of GDP - annual data; code: tipsii10". Eurostat. Retrieved August 27, 2015.
- ↑ European Central Bank International investment position of the euro area
- ↑ Central Bank of Iceland As of Q1 2015 Excluding the financial institutions undergoing winding-up proceedings, assets totalled 4,042 b.kr. and liabilities 4,031 b.kr., yielding a positive net balance of 12 b.kr. Net liabilities declined by 122 b.kr. between quarters.
External links
- Bureau of Economic Analysis Elena L. Nguyen: The International Investment Position of the United States at Yearend 2007. U.S.
- Bank of Japan Japan’s International Investment Position at Year-End 2009 (Retrieved on June 30, 2011)
- Deutsche Bundesbank (German Central Bank) International Investment Position - External Debt Statistics
- European Economic Forecast Spring 2010 European Commission working draft Graph 1.3.2., International investment position since 1980 in major economic units.
Statistics
- International Monetary Fund (IMF) International Investment Position (IIP) Data
- International Monetary Fund (IMF) World Economic Outlook Database, April 2011
- UK National Statistics Great Britain: International Investment Position, Table K
- Saint-Petersburg (Russia) statistic Economic statistics of St. Petersburg