List of sovereign states in Europe by GNI (PPP) per capita
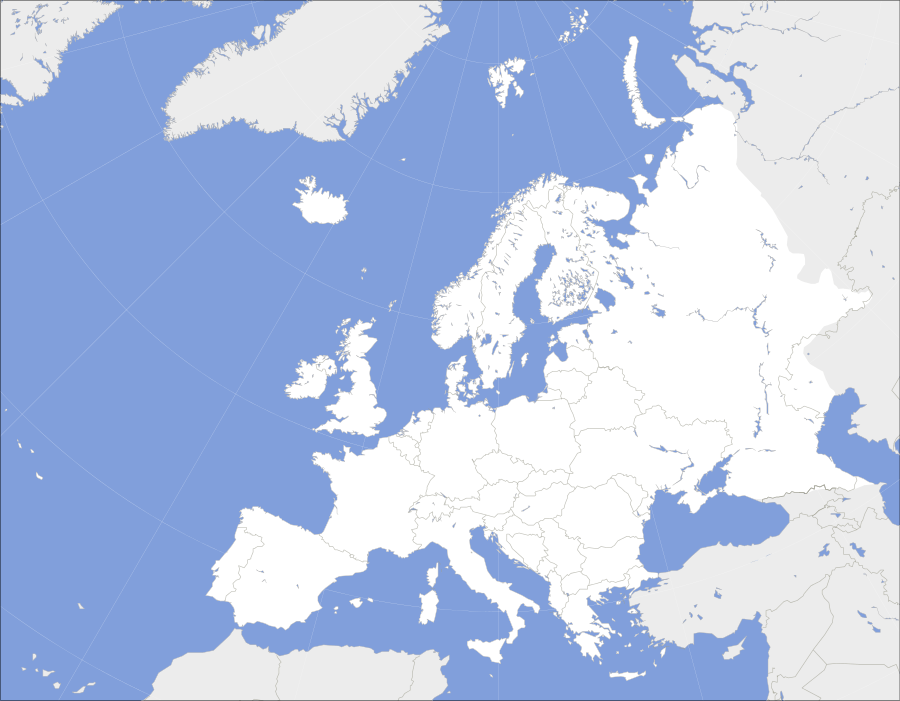
This is map and list of European countries by Gross national income (PPP) per capita for year 2017 from World Bank. Countries in green have more than $32,000, yellow $18,000-$32,000 and red below $18,000 GDP (PPP) per capita[1]
| State (51) [2] | GNI PPP |
|---|---|
| 12,120 | |
| N/D | |
| 10,060 | |
| 52,660 | |
| 16,650 | |
| 18,140 | |
| 47,960 | |
| 12,880 | |
| 20,500 | |
| 24,700 | |
| 33,609 | |
| 35,010 | |
| 51,560 | |
| 31,000 | |
| 45,730 | |
| 43,720 | |
| 10,120 | |
| 51,760 | |
| 27,820 | |
| 27,220 | |
| 53,640 | |
| 62,440 | |
| 40,030 | |
| 23,440 | |
| 11,050 | |
| 27,400 | |
| N/D | |
| 31,030 | |
| 72,640 | |
| 14,590 | |
| 36,740 | |
| 6,060 | |
| N/D | |
| 19,150 | |
| 52,640 | |
| 63,530 | |
| 28,170 | |
| 31,490 | |
| 25,150 | |
| 24,893 | |
| N/D | |
| 14,040 | |
| 31,360 | |
| 33,910 | |
| 38,090 | |
| 50,840 | |
| 65,910 | |
| 27,550 | |
| 8,900 | |
| 43,160 | |
| N/D |
See also
- International organisations in Europe
- List of European countries by budget revenues
- List of European countries by budget revenues per capita
- List of European countries by GDP (nominal) per capita
- List of European countries by GDP (PPP) per capita
- List of European countries by GNI (nominal) per capita
- List of sovereign states in Europe by net average wage
- List of countries by GDP (nominal) per capita
- List of countries by GDP 2010-2013 (PPP) per capita
- List of countries by GDP (nominal)
- List of countries by GDP (PPP)
- List of countries by GNI (PPP) per capita
References
- ↑ GNI PPP per capita 2017, World Development Indicators database , World Bank, 9 August 2018
- ↑ Only 51 sovereign states are listed, including Kosovo and Vatican which are not UN members
This article is issued from
Wikipedia.
The text is licensed under Creative Commons - Attribution - Sharealike.
Additional terms may apply for the media files.