List of sovereign states in Europe by GNI (nominal) per capita
This is a map of European countries by GNI (Gross national income nominal) per capita for year 2018[1]. High income[2] in purple ($12,056 or more, as defined by the World Bank), upper middle income in orange ($3,896 and $12,055) and lower middle income ($996 and $3,895) in red.
Explanation
For the current 2019 fiscal year, low-income economies are defined as those with a GNI per capita, calculated using the World Bank Atlas method, of $995 or less in 2017; lower middle-income economies are those with a GNI per capita between $996 and $3,895; upper middle-income economies are those with a GNI per capita between $3,896 and $12,055; high-income economies are those with a GNI per capita of $12,056 or more.
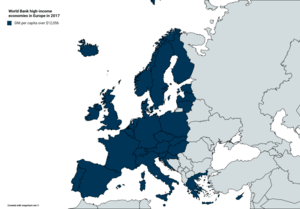
World Bank high-income economies in Europe in 2017
| State (51) [3] | GNI (nominal) per capita [4] | GDP (nominal) per capita[5] | GDP PPP per capita[6] | GNI PPP per capita[7] |
|---|---|---|---|---|
| 4,320 | 4,538 | 12,021 | 12,120 | |
| 39,147[8] | n/d | n/d | n/d | |
| 45,440 | 47,291 | 52,558 | 52,660 | |
| 5,280 | 5,726 | 18,848 | 18,140 | |
| 41,790 | 43,324 | 47,561 | 47,960 | |
| 4,940 | 5,181 | 12,876 | 12,880 | |
| 7,760 | 8,032 | 20,329 | 20,500 | |
| 12,430 | 13,295 | 25,264 | 24,700 | |
| 18,160 | 20,368 | 36,916 | 35,010 | |
| 55,220 | 56,308 | 50,541 | 51,560 | |
| 18,190 | 19,705 | 31,638 | 31,000 | |
| 44,580 | 45,703 | 45,192 | 45,730 | |
| 37,970[9] | 38,477 | 42,779 | 43,720 | |
| 43,490 | 44,470 | 50,716 | 51,760 | |
| 18,090 | 18,613 | 27,809 | 27,820 | |
| 12,870 | 14,225 | 28,375 | 27,220 | |
| 60,830 | 70,057 | 53,518 | 53,640 | |
| 55,290 | 69,331 | 76,305 | 62,440 | |
| 31,020 | 31,953 | 39,817 | 40,030 | |
| 3,890 | 3,894 | 10,754 | 11,050 | |
| 14,740 | 15,594 | 27,598 | 27,400 | |
| 134,660[10] | n/d | n/d | n/d | |
| 15,200 | 16,681 | 32,093 | 31,030 | |
| 70,260 | 104,103 | 103,662 | 72,640 | |
| 4,880 | 5,442 | 15,231 | 14,590 | |
| 23,810 | 26,946 | 39,535 | 36,740 | |
| 2,180 | 2,290 | 5,698 | 6,060 | |
| 168,004 | 168,004 | n/d | n/d | |
| 7,350 | 7,670 | 18,765 | 19,150 | |
| 46,180 | 48,223 | 52,941 | 52,640 | |
| 75,990 | 75,505 | 60,978 | 63,530 | |
| 12,710 | 13,812 | 29,291 | 28,170 | |
| 19,820 | 21,136 | 32,199 | 31,490 | |
| 9,970 | 10,814 | 25,841 | 25,150 | |
| 9,232 | 10,743 | 25,533 | 24,893 | |
| 40,586[12] | n/d | n/d | n/d | |
| 5,180 | 5,900 | 15,090 | 14,040 | |
| 16,610 | 17,605 | 32,111 | 31,360 | |
| 22,000 | 23,597 | 34,802 | 33,910 | |
| 27,180 | 28,157 | 38,091 | 38,090 | |
| 52,590 | 53,442 | 50,070 | 50,840 | |
| 80,560 | 80,190 | 65,007 | 65,910 | |
| 2,388 | 2,640 | 8,667 | 8,900 | |
| 40,530 | 39,720 | 43,877 | 43,160 |
upper middle income ($3,896 and $12,055)
lower middle income ($996 and $3,895)
See also
- World Bank high-income economy
- International organisations in Europe
- List of European countries by budget revenues
- List of European countries by budget revenues per capita
- List of European countries by GDP (nominal) per capita
- List of European countries by GDP (PPP) per capita
- List of European countries by GNI (PPP) per capita
- List of sovereign states in Europe by net average wage
- List of countries by GDP (nominal) per capita
- List of countries by GDP (PPP) per capita
- List of countries by GDP (nominal)
- List of countries by GDP (PPP)
- List of countries by GNI (nominal) per capita
References
- ↑ https://datahelpdesk.worldbank.org/knowledgebase/articles/906519-world-bank-country-and-lending-groups
- ↑ World Bank Country Classification for 2017
- ↑ Only 51 sovereign states are listed, including Kosovo and Vatican which are not UN members
- ↑ GNI (nominal) per capita for year 2017, World Development Indicators database, Atlas method, World Bank, revised 01 July 2017
- ↑ GDP (nominal) per capita (World Bank Database), revised 01 July 2017
- ↑ GDP (PPP) per capita (World Bank Database), revised 01 July 2017
- ↑ GNI (PPP) per capita (World Bank Database), revised 01 July 2017
- ↑ https://unstats.un.org/unsd/snaama/resCountry.asp
- ↑ Data include the French overseas departments of French Guiana, Guadeloupe, Martinique and Réunion.
- ↑ https://unstats.un.org/unsd/snaama/resCountry.asp
- ↑ https://unstats.un.org/unsd/snaama/resCountry.asp
- ↑ https://unstats.un.org/unsd/snaama/resCountry.asp
- ↑ World Bank Country Classification for 2017
This article is issued from
Wikipedia.
The text is licensed under Creative Commons - Attribution - Sharealike.
Additional terms may apply for the media files.