Demographics of Liberia
| Republic of Liberia |
|---|
 |
| Subdivisions |
The demographics of Liberia are examined on this page, including Liberia's population density, ethnic groups, education level, population health, economic status, religious affiliations and other demographic information.
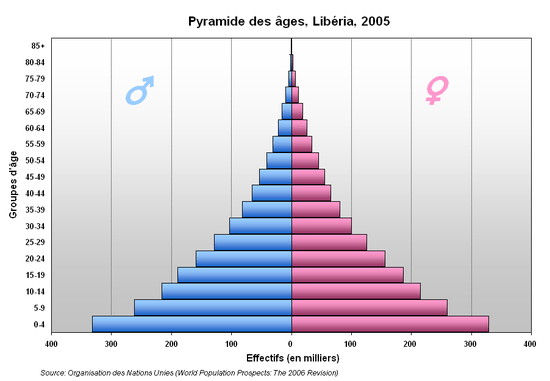
As of 2006, Liberia has the highest population growth rate in the world (4.50% per annum).[1] 43.5% of Liberians were below the age of 15 in 2010.[2]
With recent civil wars being fought along ethnic lines, Liberia is a multiethnic and multicultural country. Diversity has always been celebrated in Liberian culture - ethnically based civil wars aside - in regard to cuisine, music, fashion, language and people. Despite individuals at power claim that 80% of the population is Christian, most of the population follow traditional African belief system and an other significant portion belong to Islamic faith.
Population
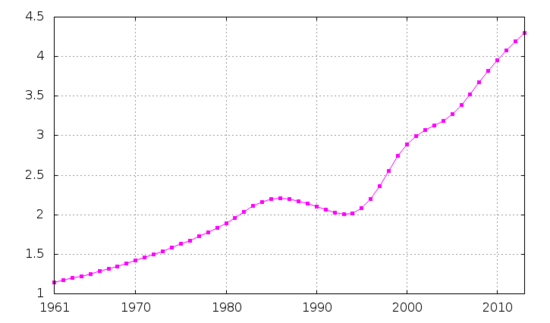
According to the 2017 revision of the World Population Prospects[4], Liberia's total population was 4,613,823 in 2016. This is compared to 911,000 in 1950.[2]
43.5% of Liberians were below the age of 15 in 2010.[2] 53.7% were between 15 and 65 years of age, while 2.8% were 65 years or older.[2]
As of 2006, Liberia has the highest population growth rate in the world (4.50% per annum).[1]
| Total population (x 1000) | Population aged 0–14 (%) | Population aged 15–64 (%) | Population aged 65+ (%) | |
|---|---|---|---|---|
| 1950 | 911 | 41.0 | 55.9 | 3.0 |
| 1955 | 997 | 41.1 | 56.1 | 2.8 |
| 1960 | 1 116 | 41.4 | 55.9 | 2.7 |
| 1965 | 1 262 | 43.0 | 54.3 | 2.6 |
| 1970 | 1 440 | 44.1 | 53.3 | 2.6 |
| 1975 | 1 658 | 44.8 | 52.6 | 2.6 |
| 1980 | 1 923 | 45.5 | 51.9 | 2.6 |
| 1985 | 2 212 | 45.9 | 51.5 | 2.6 |
| 1990 | 2 127 | 45.6 | 52.8 | 2.6 |
| 1995 | 2 095 | 44.5 | 52.8 | 2.6 |
| 2000 | 2 847 | 43.6 | 53.8 | 2.6 |
| 2005 | 3 183 | 43.3 | 54.0 | 2.7 |
| 2010 | 3 994 | 43.5 | 53.7 | 2.8 |
Vital statistics
Registration of vital events is in Liberia not complete. The Population Departement of the United Nations prepared the following estimates. [2]
| Period | Live births per year | Deaths per year | Natural change per year | CBR* | CDR* | NC* | TFR* | IMR* |
|---|---|---|---|---|---|---|---|---|
| 1950-1955 | 45 000 | 27 000 | 17 000 | 46.7 | 28.8 | 18.0 | 6.27 | 224 |
| 1955-1960 | 51 000 | 29 000 | 22 000 | 48.1 | 27.1 | 21.0 | 6.35 | 208 |
| 1960-1965 | 58 000 | 30 000 | 28 000 | 48.6 | 25.4 | 23.2 | 6.47 | 194 |
| 1965-1970 | 65 000 | 32 000 | 33 000 | 48.4 | 23.6 | 24.7 | 6.59 | 181 |
| 1970-1975 | 76 000 | 34 000 | 41 000 | 48.9 | 22.1 | 26.8 | 6.80 | 169 |
| 1975-1980 | 88 000 | 37 000 | 51 000 | 49.0 | 20.8 | 28.2 | 6.93 | 158 |
| 1980-1985 | 101 000 | 43 000 | 58 000 | 48.8 | 20.8 | 28.0 | 6.96 | 159 |
| 1985-1990 | 102 000 | 46 000 | 57 000 | 47.2 | 21.1 | 26.1 | 6.72 | 164 |
| 1990-1995 | 95 000 | 45 000 | 50 000 | 45.0 | 21.2 | 23.8 | 6.30 | 168 |
| 1995-2000 | 109 000 | 49 000 | 60 000 | 44.0 | 19.8 | 24.2 | 6.01 | 155 |
| 2000-2005 | 128 000 | 46 000 | 82 000 | 42.4 | 15.4 | 27.1 | 5.69 | 116 |
| 2005-2010 | 145 000 | 43 000 | 102 000 | 40.5 | 12.0 | 28.5 | 5.42 | 89 |
| * CBR = crude birth rate (per 1000); CDR = crude death rate (per 1000); NC = natural change (per 1000); IMR = infant mortality rate per 1000 births; TFR = total fertility rate (number of children per woman) | ||||||||
Fertility and births
Total Fertility Rate (TFR) (Wanted Fertility Rate) and Crude Birth Rate (CBR):[5][6]
| Year | CBR (Total) | TFR (Total) | CBR (Urban) | TFR (Urban) | CBR (Rural) | TFR (Rural) |
|---|---|---|---|---|---|---|
| 2007 | 37,6 | 5,2 (4,6) | 32,5 | 3,8 (3,3) | 40,4 | 6,2 (5,6) |
| 2013 | 34,4 | 4,7 (4,0) | 31,1 | 3,8 (3,3) | 38,5 | 6,1 (5,1) |
Fertility data as of 2013 (DHS Program):[7]
| Region | Total fertility rate | Percentage of women age 15-49 currently pregnant | Mean number of children ever born to women age 40-49 |
|---|---|---|---|
| North Western | 5.8 | 10.3 | 7.1 |
| South Central | 3.8 | 6.7 | 5.8 |
| South Eastern A | 6.5 | 9.6 | 6.7 |
| South Eastern B | 5.9 | 9.2 | 7.1 |
| North Central | 5.6 | 10.2 | 6.2 |
Life expectancy
| Period | Life expectancy in Years[8] |
|---|---|
| 1950–1955 | 33.13 |
| 1955–1960 | |
| 1960–1965 | |
| 1965–1970 | |
| 1970–1975 | |
| 1975–1980 | |
| 1980–1985 | |
| 1985–1990 | |
| 1990–1995 | |
| 1995–2000 | |
| 2000–2005 | |
| 2005–2010 | |
| 2010–2015 |
Ethnic communities of Liberia
Indigenous
The indigenous ethnic groups of Liberia can be linguistically divided into three groups who speak;
- The isolate Gola language and the
- Mel languages (particularly Kissi) in the east and
- Kru languages (particularly Bassa) in the west
to which must be added the immigrant communities;
- Mande-Fu (Kpelle, Gio, Mano, Loma)
- Mande-Tan (Vai, Mende, Mandingo)
- Repatriated (Americo-Liberians, Congo, Caribbean)
The Gola ethnic group originated somewhere in central Africa. During the Empire of Ancient Ghana they were involved in the land-surveying and jurisprudence of the empire.
The other ethnic groups that fall under the Mande-Tan, Mande-Fu were also members of Ancient Ghana. Because of their influence in the judicial aspects of the Ghana, the Gola's social structure dominated through the Poro.
With the influx of Islam many groups adopted it while others resisted. The Golas fought three wars with pro-Islamic elements in a changing Ghana. These wars were known as the Kumba Wars. The Golas lost the third of these wars and were forced to retreat toward Sierra Leone. They were pursued by the Mende, Gbandi and Loma. Their battles with the Mende in Sierra Leone forced them to retreat yet again and settle finally in Liberia where they encountered the Dei.
Immigrants from Mali
The Kpelle, Gio, Mano, Mandingo and Vai groups migrated from the Empire of Mali for various reasons, some escaping political intrigue, others looking for a better life. The Vais, settled in Grand Cape Mount county in the west of Liberia, were the first to invent a form of writing in 1833 or 1834. The reported inventor was Dwalu Bukele of Bandakor along the Robertsport (provincial capital) highway.
Immigrants from Côte d'Ivoire
In the 16th century; Kru (Tajuasohn), Bassa, Belleh, Krahn, Grebo.
19th century
- Americo-Liberians: Free black people and emancipated slaves, and their descendants, from the U.S. and the Caribbean
- Congos is an eponymic term for "recaptives," people rescued from slave ships after the slave trade, not slavery itself, was abolished by Great Britain and the United States. These people were "repatriated" to Liberia (and Sierra Leone if rescued by the British) and their descendants. The term was used because many of these rescued Africans were thought to be from the Congo River Basin.[9][10][11]
Immigrants from Lebanon
In the late 19th century to early 20th century Lebanese merchants, families and businessmen began arriving in Liberia. Lebanese currently own many major businesses such as supermarkets, restaurants, textiles, construction works, factories and other production based companies across the country. Despite living in the country, Lebanese are denied citizenship rights due to Liberia's nationality law and are seen in a political view as foreigners.
Religion
According to the 2008 National Census, 85.5% of Liberia's population practices Christianity.[13] Muslims comprise 12.2% of the population, largely coming from the Mandingo and Vai ethnic groups.[13] The vast majority of Muslims are Malikite Sunni, with sizeable Shia and Ahmadiyya minorities.[14] Traditional indigenous religions are practiced by 0.5% of the population, while 1.8% subscribe to no religion.[13]
CIA World Factbook demographic statistics
The following demographic statistics are from the CIA World Factbook, unless otherwise indicated.
Sex ratio
at birth:
1.03 male(s)/female
under 15 years:
1.01 male(s)/female
15–64 years:
0.98 male(s)/female
65 years and over:
1.03 male(s)/female
total population:1 male(s)/female (2011 est.)
Life expectancy at birth
total population:
57 years
male:
55.44 years
female:
58.6 years (2011 est.)
Ethnic groups
There are officially 17[15] ethnic groups that make up Liberia's indigenous African population, making up maybe 95% of the total: Kpelle, the largest group; Bassa, Gio, Kru, often fishermen; Grebo, Mandingo, often in trade and transport; Mano, Krahn, Gola, Gbandi, Loma, Kissi, Vai, Belleh, Mende and Dey.
There are also more or less nomadic groups like the Fula, who engage mostly in trade, and the Fanti, who are often fishermen or traders of fish, usually from Ghana, living seasonally and more and more often permanently in Liberia.
Then there are Americo-Liberians, who are descendants of free-born and formerly enslaved African Americans who arrived in Liberia from 1822 onward and Congo People (descendants of immigrants from the Caribbean), making up an estimated 5% of the population. They used to dominate political life in Liberia and still have a lot of influence.
There are about 5,000 people of European descent, many of them having settled down as miners, missionaries, business people, and so on. There also is a sizeable number of Lebanese, Indians, and other people with Asian roots who make up a significant part of Liberia's business community. Because of the civil war and its accompanying problem of insecurity, the number of non-Africans in Liberia is low and confined largely to Monrovia and its immediate surroundings. The Liberian constitution restricts citizenship to people of African descent.
Languages
English 20% (official), some 20 ethnic group languages, of which a few can be written and are used in correspondence.
Literacy
Literacy in Liberia, as defined as age 15 and over and can read and write, is:
total population:
38.3%
male:
53.9%
female:
22.4%[16]
note:
these figures are increasing because of the improving school system
See also
References
- 1 2 "United Nations World Population Prospects: 2006 revision : Table A.8" (PDF). Un.org. Retrieved 26 October 2017.
- 1 2 3 4 5 6 Population Division of the Department of Economic and Social Affairs of the United Nations Secretariat, World Population Prospects: The 2010 Revision Archived May 6, 2011, at the Wayback Machine.
- 1 2 Data of FAO, year 2005
- ↑ "World Population Prospects: The 2017 Revision". ESA.UN.org (custom data acquired via website). United Nations Department of Economic and Social Affairs, Population Division. Retrieved 10 September 2017.
- ↑ "Liberia Demographic and Health Survey 2013" (PDF). Dhsprogram.com. Retrieved 26 October 2017.
- ↑ "Demographic and Health Survey 2007" (PDF). Dhsprogram.com. Retrieved 26 October 2017.
- ↑ "Demographic and Health Survey 2013" (PDF). Dhsprogram.com. Retrieved 26 October 2017.
- ↑ "World Population Prospects - Population Division - United Nations". esa.un.org. Retrieved 2018-08-26.
- ↑ Clegg 2004
- ↑ Ciment 2013
- ↑ Sundiata 2003
- 1 2 "Africa :: LIBERIA". CIA The World Factbook.
- 1 2 3 "International Religious Freedom Report 2010: Liberia". United States Department of State. November 17, 2010. Retrieved July 22, 2011.
- ↑ "The World's Muslims: Unity and Diversity" (PDF). Pew Forum on Religious & Public life. August 9, 2012. Retrieved March 31, 2014.
- ↑ "2008 POPULATION AND HOUSING CENSUS" (PDF). Lisgis.net. Retrieved 26 October 2017.
- ↑ 1995 estimate
Bibliography
- Ciment, J. (2013) Another America: The Story of Liberia and the Former Slaves Who Ruled It. New York: Hill and Wang. ISBN 978-0-8090-9542-1
- Clegg, C. (2004). The Price of Liberty: African Americans and the Making of Liberia. Chapel Hill: UNC Press. ISBN 978-0-8078-2845-8
- Sundiata, I. (2003) Brothers and Strangers: Black Zion, Black Slavery, 1914-1940. Durham: Duke University Press ISBN 0-8223-3233-7
External links
| Wikimedia Commons has media related to Demographics of Liberia. |