Haute-Gaspésie—La Mitis—Matane—Matapédia
Haute-Gaspésie—La Mitis—Matane—Matapédia (formerly known as Matapédia—Matane) was a federal electoral district in Quebec, Canada, that has been represented in the House of Commons of Canada since 1979. It has the lowest percentage of visible minorities among all Canadian electoral districts (0.3%).
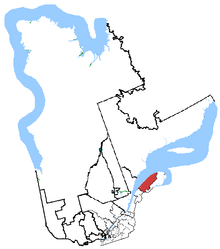
Geography
The district consists of the Regional County Municipalities of La Haute-Gaspésie, La Matapédia, Matane and La Mitis.
The neighbouring ridings are Rimouski-Neigette—Témiscouata—Les Basques, Montmorency—Charlevoix—Haute-Côte-Nord, Manicouagan, Gaspésie—Îles-de-la-Madeleine, and Madawaska—Restigouche.
History
The riding was created in 1933 as "Matapédia—Matane" from parts of Matane riding. It was abolished in 1966 when it was redistributed into Matane and Rimouski ridings.
It was created in 1976 as "Matapédia—Matane" from parts of Matane and Rimouski ridings. The name of the riding was changed in 2004 to "Haute-Gaspésie—La Mitis—Matane—Matapédia".
As per the 2012 federal electoral redistribution, this riding will be dissolved, and most will become part of Avignon—La Mitis—Matane—Matapédia and the remainder will join Gaspésie—Les Îles-de-la-Madeleine.
Members of Parliament
This riding has elected the following Members of Parliament:
| Parliament | Years | Member | Party | |
|---|---|---|---|---|
| Matapédia—Matane Riding created from Matane |
||||
| 18th | 1935–1940 | Arthur-Joseph Lapointe | Liberal | |
| 19th | 1940–1945 | |||
| 20th | 1945–1949 | Philéas Côté | Independent Liberal | |
| 21st | 1949–1953 | Liberal | ||
| 22nd | 1953–1957 | Léandre Thibault | ||
| 23rd | 1957–1958 | |||
| 24th | 1958–1962 | Alfred Belzile | Progressive Conservative | |
| 25th | 1962–1963 | |||
| 26th | 1963–1965 | René Tremblay | Liberal | |
| 27th | 1965–1968 | |||
| Riding dissolved into Matane and Rimouski | ||||
| Riding re-created from Matane and Rimouski | ||||
| 31st | 1979–1980 | Pierre de Bané | Liberal | |
| 32nd | 1980–1984 | |||
| 33rd | 1984–1988 | Jean-Luc Joncas | Progressive Conservative | |
| 34th | 1988–1993 | |||
| 35th | 1993–1997 | René Canuel | Bloc Québécois | |
| 36th | 1997–2000 | |||
| 37th | 2000–2004 | Jean-Yves Roy | ||
| Haute-Gaspésie—La Mitis—Matane—Matapédia | ||||
| 38th | 2004–2006 | Jean-Yves Roy | Bloc Québécois | |
| 39th | 2006–2008 | |||
| 40th | 2008–2010 | |||
| 41st | 2011–2014 | Jean-François Fortin | ||
| 2014–2014 | Independent | |||
| 2014–2015 | Strength in Democracy | |||
| Riding dissolved into Avignon—La Mitis—Matane—Matapédia and Gaspésie—Les Îles-de-la-Madeleine |
||||
Election results
Haute-Gaspésie—La Mitis—Matane—Matapédia, 2003 Representation Order
| Canadian federal election, 2011 | ||||||||
|---|---|---|---|---|---|---|---|---|
| Party | Candidate | Votes | % | ±% | Expenditures | |||
| Bloc Québécois | Jean-François Fortin | 12,633 | 36.05 | -1.48 | $83,313.68 | |||
| Liberal | Nancy Charest | 8,964 | 25.58 | -10.02 | $57,826.03 | |||
| New Democratic | Joanie Boulet | 7,484 | 21.36 | +16.67 | $24.16 | |||
| Conservative | Allen Cormier | 5,253 | 14.99 | -3.08 | $52,135.20 | |||
| Green | Louis Drainville | 707 | 2.02 | -1.55 | $3,418.82 | |||
| Total valid votes/Expense limit | 35,041 | 100.0 | $86,709.81 | |||||
| Total rejected, unmarked and declined ballots | 393 | 1.11 | +0.07 | |||||
| Turnout | 35,434 | 59.81 | +5.43 | |||||
| Eligible voters | 59,397 | |||||||
| Bloc Québécois hold | Swing | +4.27 | ||||||
| Sources:[3][4] | ||||||||
| Canadian federal election, 2008 | ||||||||
|---|---|---|---|---|---|---|---|---|
| Party | Candidate | Votes | % | ±% | Expenditures | |||
| Bloc Québécois | Jean-Yves Roy | 11,984 | 37.53 | -8.51 | $27,685.06 | |||
| Liberal | Nancy Charest | 11,368 | 35.60 | +22.53 | $33,059.08 | |||
| Conservative | Jérôme Landry | 5,771 | 18.07 | -11.68 | $36,135.20 | |||
| New Democratic | Julie Demers | 1,497 | 4.69 | -1.51 | none listed | |||
| Green | Louis Drainville | 1,139 | 3.57 | +0.90 | $5,771.18 | |||
| Independent | Liliane Potvin | 175 | 0.55 | – | $995.72 | |||
| Total valid votes/Expense limit | 31,934 | 100.0 | $83,890 | |||||
| Total rejected, unmarked and declined ballots | 334 | 1.04 | -0.07 | |||||
| Turnout | 32,268 | 54.38 | -3.74 | |||||
| Eligible voters | 59,340 | |||||||
| Bloc Québécois hold | Swing | -15.52 | ||||||
| Canadian federal election, 2006 | ||||||||
|---|---|---|---|---|---|---|---|---|
| Party | Candidate | Votes | % | ±% | Expenditures | |||
| Bloc Québécois | Jean-Yves Roy | 15,721 | 46.04 | -10.41 | $37,418.83 | |||
| Conservative | Rodrigue Drapeau | 10,157 | 29.75 | +23.52 | $9,382.28 | |||
| Liberal | Kim Leclerc | 4,463 | 13.07 | -17.41 | $16,825.39 | |||
| New Democratic | Stéphane Ricard | 2,116 | 6.20 | +1.21 | $6,369.99 | |||
| Green | Sarah Desjardins | 910 | 2.67 | +0.82 | none listed | |||
| Independent | Yvan Côté | 778 | 2.28 | – | $145.46 | |||
| Total valid votes/Expense limit | 34,145 | 100.0 | $78,148 | |||||
| Total rejected, unmarked and declined ballots | 384 | 1.11 | -0.56 | |||||
| Turnout | 34,529 | 58.12 | +3.92 | |||||
| Eligible voters | 59,403 | |||||||
| Bloc Québécois hold | Swing | -16.96 | ||||||
Matapédia—Matane, 2003 Representation Order
| Canadian federal election, 2004 | ||||||||
|---|---|---|---|---|---|---|---|---|
| Party | Candidate | Votes | % | ±% | Expenditures | |||
| Bloc Québécois | Jean-Yves Roy | 17,878 | 56.45 | +5.64 | $33,104.30 | |||
| Liberal | Marc Bélanger | 9,653 | 30.48 | -10.00 | $43,493.59 | |||
| Conservative | Vahid Fortin-Vidah | 1,972 | 6.23 | +0.96 | $7,100.94 | |||
| New Democratic | Jean-Guy Côté | 1,581 | 4.99 | +2.53 | $1,189.95 | |||
| Green | Nicolas Deville | 585 | 1.85 | – | none listed | |||
| Total valid votes/Expense limit | 31,669 | 100.0 | $76,262 | |||||
| Total rejected, unmarked and declined ballots | 536 | 1.67 | ||||||
| Turnout | 32,205 | 54.20 | -1.77 | |||||
| Eligible voters | 59,416 | |||||||
| Bloc Québécois notional hold | Swing | +7.82 | ||||||
| Changes from 2000 are based on redistributed results. Change for the Conservative Party is based on the combined totals of the Progressive Conservative Party and the Canadian Alliance. | ||||||||
| 2000 federal election redistributed results | |||
|---|---|---|---|
| Party | Vote | % | |
| Bloc Québécois | 16,584 | 50.81 | |
| Liberal | 13,213 | 40.48 | |
| Progressive Conservative | 1,326 | 4.06 | |
| New Democratic | 804 | 2.46 | |
| Alliance | 397 | 1.21 | |
| Others | 314 | 0.96 | |
Matapédia—Matane, 1979–2000
| Canadian federal election, 2000 | ||||||||
|---|---|---|---|---|---|---|---|---|
| Party | Candidate | Votes | % | ±% | ||||
| Bloc Québécois | Jean-Yves Roy | 14,678 | 46.6 | +1.8 | ||||
| Liberal | Marc Bélanger | 14,402 | 45.8 | +15.6 | ||||
| Progressive Conservative | Germain Dumas | 1,456 | 4.6 | -18.2 | ||||
| New Democratic | Karine Paquet-Gauthier | 935 | 3.0 | +1.8 | ||||
| Total valid votes | 31,471 | 100.0 | ||||||
| Canadian federal election, 1997 | ||||||||
|---|---|---|---|---|---|---|---|---|
| Party | Candidate | Votes | % | ±% | ||||
| Bloc Québécois | René Canuel | 15,694 | 44.8 | -12.6 | ||||
| Liberal | Robert Boulay | 10,558 | 30.1 | -2.3 | ||||
| Progressive Conservative | Darryl Gray | 7,991 | 22.8 | +15.1 | ||||
| New Democratic | Anny-Jos Paquin | 417 | 1.2 | +0.5 | ||||
| Natural Law | Miville Couture | 377 | 1.1 | -0.7 | ||||
| Total valid votes | 35,037 | 100.0 | ||||||
| Canadian federal election, 1993 | ||||||||
|---|---|---|---|---|---|---|---|---|
| Party | Candidate | Votes | % | ±% | ||||
| Bloc Québécois | René Canuel | 18,331 | 57.4 | |||||
| Liberal | Maurice Gauthier | 10,345 | 32.4 | -4.0 | ||||
| Progressive Conservative | Jean-Luc Joncas | 2,446 | 7.7 | -42.5 | ||||
| Natural Law | Pierre Gauthier | 573 | 1.8 | |||||
| New Democratic | Robert McKoy | 219 | 0.7 | -12.7 | ||||
| Total valid votes | 31,914 | 100.0 | ||||||
| Canadian federal election, 1988 | ||||||||
|---|---|---|---|---|---|---|---|---|
| Party | Candidate | Votes | % | ±% | ||||
| Progressive Conservative | Jean-Luc Joncas | 15,962 | 50.2 | -2.5 | ||||
| Liberal | Claude Canuel | 11,584 | 36.4 | +3.7 | ||||
| New Democratic | Yves Coté | 4,253 | 13.4 | +10.4 | ||||
| Total valid votes | 31,799 | 100.0 | ||||||
| Canadian federal election, 1984 | ||||||||
|---|---|---|---|---|---|---|---|---|
| Party | Candidate | Votes | % | ±% | ||||
| Progressive Conservative | Jean-Luc Joncas | 15,994 | 52.7 | +41.3 | ||||
| Liberal | Jocelyne Lévesque | 9,929 | 32.7 | -45.1 | ||||
| Parti nationaliste | Pierre Dufort | 3,523 | 11.6 | |||||
| New Democratic | Frédéric D'Astous | 909 | 3.0 | -0.3 | ||||
| Total valid votes | 30,355 | 100.0 | ||||||
| Canadian federal election, 1980 | ||||||||
|---|---|---|---|---|---|---|---|---|
| Party | Candidate | Votes | % | ±% | ||||
| Liberal | Pierre De Bané | 21,116 | 77.8 | +5.4 | ||||
| Progressive Conservative | Roland Paquin | 3,095 | 11.4 | +0.4 | ||||
| Social Credit | Léonard Boulay | 1,137 | 4.2 | -9.0 | ||||
| Rhinoceros | Michel Bélair | 892 | 3.3 | |||||
| New Democratic | Thérèse Beaulieu | 888 | 3.3 | +1.3 | ||||
| Total valid votes | 27,128 | 100.0 | ||||||
| Canadian federal election, 1979 | ||||||||
|---|---|---|---|---|---|---|---|---|
| Party | Candidate | Votes | % | |||||
| Liberal | Pierre De Bané | 19,728 | 72.4 | |||||
| Social Credit | Roland Paquin | 3,602 | 13.2 | |||||
| Progressive Conservative | Joseph-Marie Lévesque | 2,993 | 11.0 | |||||
| New Democratic | André Noël | 548 | 2.0 | |||||
| Union populaire | Pierre Demers | 374 | 1.4 | |||||
| Total valid votes | 27,245 | 100.0 | ||||||
Matapédia—Matane, 1933 - 1968
| Canadian federal election, 1965 | ||||||||
|---|---|---|---|---|---|---|---|---|
| Party | Candidate | Votes | % | ±% | ||||
| Liberal | René Tremblay | 10,435 | 51.8 | +8.8 | ||||
| Progressive Conservative | Roland-L. English | 5,568 | 27.6 | +2.4 | ||||
| Ralliement créditiste | J.-Gérard Pelletier | 3,383 | 16.8 | -14.5 | ||||
| New Democratic | H.-Aubin Dussault | 769 | 3.8 | |||||
| Total valid votes | 20,155 | 100.0 | ||||||
Note: Ralliement créditiste vote is compared to Social Credit vote in the 1963 election.
| Canadian federal election, 1963 | ||||||||
|---|---|---|---|---|---|---|---|---|
| Party | Candidate | Votes | % | ±% | ||||
| Liberal | René Tremblay | 10,265 | 43.0 | +6.2 | ||||
| Social Credit | Eudore Allard | 7,237 | 30.3 | -1.4 | ||||
| Progressive Conservative | J.-Alfred Belzile | 6,021 | 25.2 | -11.6 | ||||
| Independent Social Credit | Gérard Ratté | 344 | 1.4 | |||||
| Total valid votes | 23,867 | 100.0 | ||||||
| Canadian federal election, 1962 | ||||||||
|---|---|---|---|---|---|---|---|---|
| Party | Candidate | Votes | % | ±% | ||||
| Progressive Conservative | J.-Alfred Belzile | 8,484 | 36.8 | -22.1 | ||||
| Social Credit | Eudore Allard | 7,299 | 31.7 | |||||
| Liberal | Wilfrid Lafontaine | 6,304 | 27.4 | -13.7 | ||||
| Independent Liberal | Amable Ouellet | 633 | 2.7 | |||||
| New Democratic | H.-Aubin Dussault | 328 | 1.4 | |||||
| Total valid votes | 23,048 | 100.0 | ||||||
| Canadian federal election, 1958 | ||||||||
|---|---|---|---|---|---|---|---|---|
| Party | Candidate | Votes | % | ±% | ||||
| Progressive Conservative | J.-Alfred Belzile | 14,969 | 58.9 | +10.6 | ||||
| Liberal | Roland Bergeron | 10,433 | 41.1 | -10.6 | ||||
| Total valid votes | 25,402 | 100.0 | ||||||
| Canadian federal election, 1957 | ||||||||
|---|---|---|---|---|---|---|---|---|
| Party | Candidate | Votes | % | ±% | ||||
| Liberal | Léandre Thibault | 11,642 | 51.7 | -2.4 | ||||
| Progressive Conservative | Alfred Belzile | 10,889 | 48.3 | -2.4 | ||||
| Total valid votes | 22,531 | 100.0 | ||||||
| Canadian federal election, 1953 | ||||||||
|---|---|---|---|---|---|---|---|---|
| Party | Candidate | Votes | % | ±% | ||||
| Liberal | Léandre Thibault | 12,689 | 54.1 | +4.1 | ||||
| Progressive Conservative | J.-Donat Brulé | 10,765 | 45.9 | +3.2 | ||||
| Total valid votes | 23,454 | 100.0 | ||||||
| Canadian federal election, 1949 | ||||||||
|---|---|---|---|---|---|---|---|---|
| Party | Candidate | Votes | % | ±% | ||||
| Liberal | A.-Philéas Coté | 11,546 | 50.3 | +2.8 | ||||
| Progressive Conservative | Adélard Fortin | 9,811 | 42.7 | |||||
| Union des électeurs | Jean-Charles Gosselin | 678 | 3.0 | |||||
| Independent Liberal | Louis-Philippe Rioux | 558 | 2.4 | -6.8 | ||||
| Independent Liberal | David Ratté | 368 | 1.6 | |||||
| Total valid votes | 22,961 | 100.0 | ||||||
| Canadian federal election, 1945 | ||||||||
|---|---|---|---|---|---|---|---|---|
| Party | Candidate | Votes | % | ±% | ||||
| Independent Liberal | A.-Philéas Coté | 8,500 | 47.5 | |||||
| Independent | Oscar Drouin | 7,208 | 40.3 | |||||
| Bloc populaire | Louis-Philippe Rioux | 1,648 | 9.2 | |||||
| Independent | Arthur Lepage | 546 | 3.0 | |||||
| Total valid votes | 17,902 | 100.0 | ||||||
| Canadian federal election, 1940 | ||||||||
|---|---|---|---|---|---|---|---|---|
| Party | Candidate | Votes | % | ±% | ||||
| Liberal | Arthur-Joseph Lapointe | 9,956 | 63.2 | +28.3 | ||||
| National Government | Joseph-Ernest-Henri Larue | 5,804 | 36.8 | +3.0 | ||||
| Total valid votes | 15,760 | 100.0 | ||||||
Note: "National Government" vote is compared to Conservative vote in 1935 election.
| Canadian federal election, 1935 | ||||||||
|---|---|---|---|---|---|---|---|---|
| Party | Candidate | Votes | % | |||||
| Liberal | Arthur-Joseph Lapoine | 4,987 | 34.9 | |||||
| Conservative | Joseph-Ernest-Henri Larue | 4,834 | 33.8 | |||||
| Reconstruction | Georges-Léonidas Dionne | 4,476 | 31.3 | |||||
| Total valid votes | 14,297 | 100.0 | ||||||
See also
References
- "(Code 24041) Census Profile". 2011 census. Statistics Canada. 2012. Retrieved 2011-03-07.
- Campaign expense data from Elections Canada
- Riding history for Matapédia—Matane 1979 - 2004 from the Library of Parliament
- Riding history for Haute-Gaspésie—La Mitis—Matane—Matapédia 2004 - present from the Library of Parliament