Rosemont—La Petite-Patrie
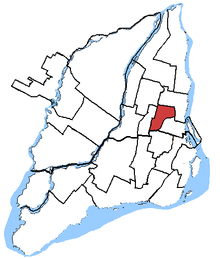 Rosemont—La Petite-Patrie in relation to other federal electoral districts in Montreal (2003 boundaries) | |||
| Federal electoral district | |||
| Legislature | House of Commons | ||
| MP |
New Democratic | ||
| District created | 1976 | ||
| First contested | 1979 | ||
| Last contested | 2015 | ||
| District webpage | profile, map | ||
| Demographics | |||
| Population (2016)[1] | 110,677 | ||
| Electors (2015) | 83,936 | ||
| Area (km²)[2] | 10.67 | ||
| Pop. density (per km²) | 10,372.7 | ||
| Census divisions | Montreal | ||
| Census subdivisions | Montreal | ||
Rosemont—La Petite-Patrie (formerly known as Rosemont and Rosemont—Petite-Patrie) is a federal electoral district in Quebec, Canada, that has been represented in the House of Commons of Canada since 1979.
Geography
The district includes the neighbourhood of Petite-Patrie and the western part of the neighbourhood of Rosemont in the Borough of Rosemont–La Petite-Patrie.
Demographics
- According to the Canada 2016 Census
- Languages: (2016) 78.2% French, 4.7% Spanish, 4.5% English, 2.3% Arabic, 1.4% Portuguese, 1.4% Italian, 1.0% Vietnamese, 1.0% Creole, 0.6% Mandarin, 0.4% Cantonese, 0.4% Russian, 0.4% Kabyle, 0.3% Ukrainian, 0.3% Romanian, 0.3% Polish[3]
History
The riding was created under the name "Rosemont" in 1976 from parts of the ridings of Lafontaine, Maisonneuve—Rosemont, Papineau, and Saint-Michel. The name was changed to "Rosemont—Petite-Patrie" in 2000, and then to its current name in 2003.
This riding gained a small fraction of territory from Outremont during the 2012 electoral redistribution.
Members of Parliament
This riding has elected the following Members of Parliament:
| Parliament | Years | Member | Party | |
|---|---|---|---|---|
| Rosemont Riding created from Lafontaine, Maisonneuve—Rosemont, Papineau and Saint-Michel |
||||
| 31st | 1979–1980 | Claude-André Lachance | Liberal | |
| 32nd | 1980–1984 | |||
| 33rd | 1984–1988 | Suzanne Blais-Grenier | Progressive Conservative | |
| 34th | 1988–1990 | Benoît Tremblay | ||
| 1990–1990 | Independent | |||
| 1990–1993 | Bloc Québécois | |||
| 35th | 1993–1997 | |||
| 36th | 1997–2000 | Bernard Bigras | ||
| Rosemont—Petite-Patrie | ||||
| 37th | 2000–2004 | Bernard Bigras | Bloc Québécois | |
| Rosemont—La Petite-Patrie | ||||
| 38th | 2004–2006 | Bernard Bigras | Bloc Québécois | |
| 39th | 2006–2008 | |||
| 40th | 2008–2011 | |||
| 41st | 2011–2015 | Alexandre Boulerice | New Democratic | |
| 42nd | 2015–Present | |||
Election results
Rosemont—La Petite-Patrie, 2003 - present
| Canadian federal election, 2015 | ||||||||
|---|---|---|---|---|---|---|---|---|
| Party | Candidate | Votes | % | ±% | Expenditures | |||
| New Democratic | Alexandre Boulerice | 28,692 | 49.17 | -1.90 | $110,249.53 | |||
| Bloc Québécois | Claude André | 12,276 | 21.03 | -11.82 | $56,203.37 | |||
| Liberal | Nadine Medawar | 12,069 | 20.68 | +11.53 | $11,102.48 | |||
| Conservative | Jeremy Dohan | 2,506 | 4.29 | -0.03 | $3,537.24 | |||
| Green | Sameer Muldeen | 1,787 | 3.06 | +1.39 | – | |||
| Rhinoceros | Laurent Aglat | 495 | 0.85 | +0.08 | – | |||
| Libertarian | Peter d'Entremont | 353 | 0.60 | – | – | |||
| Marxist–Leninist | Stéphane Chénier | 171 | 0.29 | +0.03 | – | |||
| Total valid votes/Expense limit | – | 100.0 | $222,080.44 | |||||
| Total rejected ballots | – | – | – | |||||
| Turnout | 58,349 | 69.13 | +2.22 | |||||
| Eligible voters | 83,936 | |||||||
| New Democratic hold | Swing | −1.9 | ||||||
| Source: Elections Canada[4][5] | ||||||||
| 2011 federal election redistributed results[6] | |||
|---|---|---|---|
| Party | Vote | % | |
| New Democratic | 27,644 | 51.07 | |
| Bloc Québécois | 17,731 | 32.76 | |
| Liberal | 4,951 | 9.15 | |
| Conservative | 2,337 | 4.32 | |
| Green | 906 | 1.67 | |
| Others | 558 | 1.03 | |
| Canadian federal election, 2011 | ||||||||
|---|---|---|---|---|---|---|---|---|
| Party | Candidate | Votes | % | ±% | Expenditures | |||
| New Democratic | Alexandre Boulerice | 27,484 | 51.00 | +34.74 | ||||
| Bloc Québécois | Bernard Bigras | 17,702 | 32.85 | -19.15 | ||||
| Liberal | Kettly Beauregard | 4,920 | 9.13 | -9.54 | ||||
| Conservative | Sébastien Forté | 2,328 | 4.32 | -3.07 | ||||
| Green | Sameer Muldeen | 899 | 1.67 | -2.92 | ||||
| Rhinoceros | Jean-Patrick Berthiaume | 417 | 0.77 | +0.16 | ||||
| Marxist–Leninist | Stéphane Chénier | 140 | 0.26 | -0.06 | ||||
| Total valid votes/Expense limit | 53,890 | 100.00 | ||||||
| Total rejected ballots | 589 | 1.08 | ||||||
| Turnout | 54,479 | 66.91 | ||||||
| Canadian federal election, 2008 | ||||||||
|---|---|---|---|---|---|---|---|---|
| Party | Candidate | Votes | % | ±% | Expenditures | |||
| Bloc Québécois | Bernard Bigras | 27,260 | 52.00 | -3.99 | $52,571 | |||
| Liberal | Marjorie Théodore | 9,785 | 18.67 | +2.91 | $30,634 | |||
| New Democratic | Alexandre Boulerice | 8,522 | 16.26 | +4.71 | $21,117 | |||
| Conservative | Sylvie Boulianne | 3,876 | 7.39 | -1.91 | $85,619 | |||
| Green | Vincent Larochelle | 2,406 | 4.59 | -2.01 | $903 | |||
| Rhinoceros | Jean-Patrick Berthiaume | 319 | 0.61 | – | $228 | |||
| Marxist–Leninist | Stéphane Chérnier | 170 | 0.32 | – | ||||
| Independent | Michel Dugré | 83 | 0.16 | – | $690 | |||
| Total valid votes/Expense limit | 52,421 | 100.00 | $86,436 | |||||
| Total rejected ballots | 614 | 1.16 | ||||||
| Turnout | 53,035 | 64.65 | ||||||
| Canadian federal election, 2006 | ||||||||
|---|---|---|---|---|---|---|---|---|
| Party | Candidate | Votes | % | ±% | Expenditures | |||
| Bloc Québécois | Bernard Bigras | 29,336 | 55.99 | -5.81 | $51,157 | |||
| Liberal | Suzanne Harvey | 8,259 | 15.76 | -7.14 | $14,665 | |||
| New Democratic | Chantal Reeves | 6,051 | 11.55 | +3.88 | $9,537 | |||
| Conservative | Michel Sauvé | 4,873 | 9.30 | +6.21 | $16,108 | |||
| Green | Marc-André Gadoury | 3,457 | 6.60 | +2.35 | $3,983 | |||
| Marijuana | Hugô St-Onge | 419 | 0.80 | |||||
| Total valid votes/Expense limit | 52,395 | 100.00 | $81,617 | |||||
| Total rejected ballots | 605 | 1.14 | ||||||
| Turnout | 53,000 | 64.02 | ||||||
| Canadian federal election, 2004 | ||||||||
|---|---|---|---|---|---|---|---|---|
| Party | Candidate | Votes | % | ±% | Expenditures | |||
| Bloc Québécois | Bernard Bigras | 31,224 | 61.80 | +12.67 | $52,350 | |||
| Liberal | Christian Bolduc | 11,572 | 22.90 | -10.93 | $74,577 | |||
| New Democratic | Benoit Beauchamp | 3,876 | 7.67 | +4.68 | $1,271 | |||
| Green | François Chevalier | 2,145 | 4.25 | +1.14 | $913 | |||
| Conservative | Michel Sauvé | 1,561 | 3.09 | -3.99 | $10,508 | |||
| Communist | Kenneth Higham | 145 | 0.29 | -0.20 | $647 | |||
| Total valid votes/Expense limit | 50,523 | 100.00 | $81,229 | |||||
| Total rejected ballots | 847 | 1.65 | ||||||
| Turnout | 51,370 | 61.54 | ||||||
Note: Conservative vote is compared to the total of the Canadian Alliance vote and Progressive Conservative vote in 2000 election.
Rosemont—Petite-Patrie, 2000 - 2003
| Canadian federal election, 2000 | ||||||||
|---|---|---|---|---|---|---|---|---|
| Party | Candidate | Votes | % | ±% | ||||
| Bloc Québécois | Bernard Bigras | 23,315 | 49.13 | +2.10 | ||||
| Liberal | Claude Vignault | 16,052 | 33.83 | +1.65 | ||||
| Progressive Conservative | Marc Bissonnette | 2,006 | 4.23 | -11.36 | ||||
| Marijuana | Claude Messier | 1,486 | 3.13 | |||||
| Green | Sébastien Chagnon-Jean | 1,475 | 3.11 | |||||
| New Democratic | Noémi Lo Pinto | 1,417 | 2.99 | -0.31 | ||||
| Alliance | Etienne Morin | 1,354 | 2.85 | |||||
| Communist | Dorothy Sauras | 233 | 0.49 | |||||
| Independent | Joanne Pritchard | 114 | 0.24 | |||||
| Total valid votes | 47,526 | 100.00 | ||||||
Rosemont, 1976 - 2000
| Canadian federal election, 1997 | ||||||||
|---|---|---|---|---|---|---|---|---|
| Party | Candidate | Votes | % | ±% | ||||
| Bloc Québécois | Bernard Bigras | 23,313 | 47.03 | -15.92 | ||||
| Liberal | Françoise Guidi | 15,952 | 32.18 | +4.73 | ||||
| Progressive Conservative | Marc Bissonnette | 7,727 | 15.59 | +10.20 | ||||
| New Democratic | Fidel Fuentes | 1,637 | 3.30 | +1.08 | ||||
| Independent | Vicky Mercier | 494 | 1.00 | |||||
| Marxist–Leninist | Claude Brunel | 447 | 0.90 | +0.50 | ||||
| Total valid votes | 49,570 | 100.00 | ||||||
| Canadian federal election, 1993 | ||||||||
|---|---|---|---|---|---|---|---|---|
| Party | Candidate | Votes | % | ±% | ||||
| Bloc Québécois | Benoît Tremblay | 29,414 | 62.95 | |||||
| Liberal | Pierre Bourque | 12,826 | 27.45 | -1.73 | ||||
| Progressive Conservative | Pauline Vincent | 2,519 | 5.39 | -32.45 | ||||
| New Democratic | Roger Lamarre | 1,037 | 2.22 | -18.02 | ||||
| Natural Law | Marc Roy | 646 | 1.38 | |||||
| Marxist–Leninist | Hélène Héroux | 189 | 0.40 | |||||
| Commonwealth of Canada | Stéphane Lévesque | 93 | 0.20 | -0.07 | ||||
| Total valid votes | 46,727 | 100.00 | ||||||
| Canadian federal election, 1988 | ||||||||
|---|---|---|---|---|---|---|---|---|
| Party | Candidate | Votes | % | ±% | ||||
| Progressive Conservative | Benoît Tremblay | 17,127 | 37.84 | -4.4 | ||||
| Liberal | Jacques Guilbault | 13,209 | 29.18 | -9.5 | ||||
| New Democratic | Giuseppe Sciortino | 9,163 | 20.24 | +9.4 | ||||
| Independent | Suzanne Blais-Grenier | 2,060 | 4.65 | |||||
| Rhinoceros | Christian Nettoyeur Jolicoeur | 1,656 | 3.66 | -0.6 | ||||
| Green | Sylvain Auclair | 1,383 | 3.06 | |||||
| Communist | Gaétan Trudel | 151 | 0.33 | -0.1 | ||||
| Social Credit | Dollard Desjardins | 148 | 0.33 | -0.1 | ||||
| Independent | Arnold August | 122 | 0.27 | |||||
| Independent | Léo Larocque | 122 | 0.27 | |||||
| Commonwealth of Canada | Christiane Deland-Gervais | 120 | 0.27 | +0.1 | ||||
| Total valid votes | 45,261 | 100.00 | ||||||
| Canadian federal election, 1984 | ||||||||
|---|---|---|---|---|---|---|---|---|
| Party | Candidate | Votes | % | ±% | ||||
| Progressive Conservative | Suzanne Blais-Grenier | 15,782 | 42.2 | +35.8 | ||||
| Liberal | Antonio Sciascia | 14,477 | 38.7 | -37.1 | ||||
| New Democratic | Roger J.W.D. Lamarre | 4,054 | 10.8 | +1.3 | ||||
| Rhinoceros | Francine Rose Lime Lacasse | 1,587 | 4.2 | +0.5 | ||||
| Parti nationaliste | Denis Castonguay | 1,008 | 2.7 | |||||
| Communist | Claude Demers | 161 | 0.4 | |||||
| Social Credit | Lucien Lapointe | 143 | 0.4 | -2.2 | ||||
| Independent | Dollard Desjardins | 101 | 0.3 | |||||
| Commonwealth of Canada | André Malboeuf | 64 | 0.2 | |||||
| Total valid votes | 37,377 | 100.0 | ||||||
| Canadian federal election, 1980 | ||||||||
|---|---|---|---|---|---|---|---|---|
| Party | Candidate | Votes | % | ±% | ||||
| Liberal | Claude-André Lachance | 26,544 | 75.9 | +4.9 | ||||
| New Democratic | Marcel Julien | 3,337 | 9.5 | +3.9 | ||||
| Progressive Conservative | Léon Vellone | 2,260 | 6.5 | -1.4 | ||||
| Rhinoceros | G. Mara Tremblay | 1,310 | 3.7 | +0.6 | ||||
| Social Credit | Yvette Gosselin | 912 | 2.6 | -7.3 | ||||
| Independent | Jocelyne Lachapelle | 199 | 0.6 | |||||
| Independent | René Denis | 197 | 0.6 | -0.7 | ||||
| Union populaire | Monique Fournier | 139 | 0.4 | – | ||||
| Marxist–Leninist | Francine Tremblay | 91 | 0.3 | – | ||||
| Total valid votes | 34,989 | 100.0 | ||||||
| Canadian federal election, 1979 | ||||||||
|---|---|---|---|---|---|---|---|---|
| Party | Candidate | Votes | % | |||||
| Liberal | Claude-André Lachance | 28,116 | 71.0 | |||||
| Social Credit | Emery Whalen | 3,919 | 9.9 | |||||
| Progressive Conservative | Léon Vellone | 3,129 | 7.9 | |||||
| New Democratic | Marcel Julien | 2,238 | 7.9 | |||||
| Rhinoceros | Francine Lévesque | 1,248 | 3.2 | |||||
| Independent | René Denis | 509 | 1.3 | |||||
| Union populaire | André Kishka | 167 | 0.4 | |||||
| Communist | Bernadette Lebrun | 156 | 0.4 | |||||
| Marxist–Leninist | Francine Tremblay | 115 | 0.3 | |||||
| Total valid votes | 39,597 | 100.0 | ||||||
See also
References
- "(Code 24061) Census Profile". 2011 census. Statistics Canada. 2012. Retrieved 2011-03-07.
- Campaign expense data from Elections Canada
Riding history from the Library of Parliament:
Notes
- ↑ Statistics Canada: 2017
- ↑ Statistics Canada: 2017
- ↑ https://www12.statcan.gc.ca/census-recensement/2016/dp-pd/dt-td/Rp-eng.cfm?TABID=2&LANG=E&APATH=3&DETAIL=0&DIM=0&FL=A&FREE=0&GC=0&GK=0&GRP=1&PID=109979&PRID=10&PTYPE=109445&S=0&SHOWALL=0&SUB=888&Temporal=2016,2017&THEME=118&VID=0&VNAMEE=&VNAMEF=
- ↑ Elections Canada – Confirmed candidates for Rosemont—La Petite-Patrie, 30 September 2015
- ↑ Elections Canada – Preliminary Election Expenses Limits for Candidates
- ↑ Pundits' Guide to Canadian Elections
.png)