Vaudreuil—Soulanges
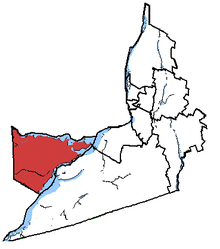 Vaudreuil-Soulanges in relation to other Montérégie federal electoral districts. | |||
| Federal electoral district | |||
| Legislature | House of Commons | ||
| MP |
Liberal | ||
| District created | 1996 | ||
| First contested | 1997 | ||
| Last contested | 2015 | ||
| District webpage | profile, map | ||
| Demographics | |||
| Population (2011)[1] | 111,905 | ||
| Electors (2015) | 89,766 | ||
| Area (km²)[2] | 408 | ||
| Pop. density (per km²) | 274.3 | ||
| Census divisions | Vaudreuil-Soulanges | ||
| Census subdivisions | Vaudreuil-Dorion, Saint-Lazare, Pincourt, L'Île-Perrot, Notre-Dame-de-l'Île-Perrot, L'Île-Cadieux, Vaudreuil-sur-le-Lac, Terrasse-Vaudreuil, Rigaud, Pointe-Fortune, Les Cèdres, Hudson | ||
Vaudreuil—Soulanges (formerly Vaudreuil—Soulanges) is a federal electoral district in Quebec, Canada, that has been represented in the House of Commons of Canada from 1914 to 1968 and since 1997.
It consists of the Vaudreuil-Soulanges Regional County Municipality. The neighbouring ridings are Argenteuil—La Petite-Nation, Lac-Saint-Louis, Salaberry—Suroît, Stormont—Dundas—South Glengarry, and Glengarry—Prescott—Russell.
Profile
The NDP did well across the riding in the 2011 election, with relatively uniform support across the district. The Bloc did well in French-dominated areas such as Rigaud near the Ontario border as well as in Vaudreuil-Dorion and the south of the riding in Les Cèdres. Hudson and Saint-Lazare were stronger areas for the Tories, being areas with higher Anglophone populations. In certain parts of Hudson, the Liberals did somewhat well, though their support across the riding was low.
History
The original Vaudreuil—Soulanges was created in 1914 when the ridings of Vaudreuil and Soulanges were combined into one riding. In keeping with the usual Canadian naming practices, the appellations 'Vaudreuil' and 'Soulanges' were linked by an em-dash as the two counties remained officially separate, and their combination was for electoral purposes only. It was abolished in 1966.
In 1997, the Vaudreuil riding was renamed "Vaudreuil-Soulanges", as it had been realigned to be perfectly coterminal to the Vaudreuil—Soulanges Regional County Municipality.
This riding lost territory to Salaberry—Suroît during the 2012 electoral redistribution and was renamed "Vaudreuil—Soulanges".
Members of Parliament
This riding has elected the following Members of Parliament:
| Parliament | Years | Member | Party | |
|---|---|---|---|---|
| Vaudreuil—Soulanges Riding created from Vaudreuil and Soulanges |
||||
| 13th | 1917–1921 | Gustave Benjamin Boyer | Liberal | |
| 14th | 1921–1922 | |||
| 1922–1925 | Joseph-Rodolphe Ouimet | |||
| 15th | 1925–1926 | Lawrence Alexander Wilson | ||
| 16th | 1926–1930 | |||
| 17th | 1930–1935 | Joseph Thauvette | ||
| 18th | 1935–1940 | |||
| 19th | 1940–1945 | |||
| 20th | 1945–1949 | Louis-René Beaudoin | ||
| 21st | 1949–1953 | |||
| 22nd | 1953–1957 | |||
| 23rd | 1957–1958 | |||
| 24th | 1958–1962 | Marcel Bourbonnais | Progressive Conservative | |
| 25th | 1962–1963 | |||
| 26th | 1963–1965 | René Émard | Liberal | |
| 27th | 1965–1968 | |||
| Riding dissolved into Vaudreuil | ||||
| Vaudreuil-Soulanges Riding re-created from Vaudreuil |
||||
| 36th | 1997–2000 | Nick Discepola | Liberal | |
| 37th | 2000–2004 | |||
| 38th | 2004–2006 | Meili Faille | Bloc Québécois | |
| 39th | 2006–2008 | |||
| 40th | 2008–2011 | |||
| 41st | 2011–2015 | Jamie Nicholls | New Democratic | |
| Vaudreuil—Soulanges | ||||
| 42nd | 2015–Present | Peter Schiefke | Liberal | |
Election results
Vaudreuil—Soulanges, 2015–present
| Canadian federal election, 2015 | ||||||||
|---|---|---|---|---|---|---|---|---|
| Party | Candidate | Votes | % | ±% | Expenditures | |||
| Liberal | Peter Schiefke | 30,550 | 46.62 | +34.23 | – | |||
| New Democratic | Jamie Nicholls | 14,627 | 22.31 | -21.19 | – | |||
| Bloc Québécois | Vincent François | 9,858 | 15.04 | -8.62 | – | |||
| Conservative | Marc Boudreau | 9,048 | 13.81 | -3.8 | – | |||
| Green | Jennifer Kaszel | 1,445 | 2.21 | -0.63 | – | |||
| Total valid votes/Expense limit | 65,528 | 100.0 | $231,083.77 | |||||
| Total rejected ballots | 714 | – | – | |||||
| Turnout | 66,242 | – | – | |||||
| Eligible voters | 89,766 | |||||||
| Source: Elections Canada[3][4] | ||||||||
| 2011 federal election redistributed results[5] | |||
|---|---|---|---|
| Party | Vote | % | |
| New Democratic | 24,134 | 43.50 | |
| Bloc Québécois | 13,129 | 23.66 | |
| Conservative | 9,770 | 17.61 | |
| Liberal | 6,873 | 12.39 | |
| Green | 1,574 | 2.84 | |
Vaudreuil-Soulanges, 1997 - 2015
| Canadian federal election, 2011 | ||||||||
|---|---|---|---|---|---|---|---|---|
| Party | Candidate | Votes | % | ±% | Expenditures | |||
| New Democratic | Jamie Nicholls | 30,177 | 43.61 | +33.98 | ||||
| Bloc Québécois | Meili Faille | 17,781 | 25.69 | -15.65 | ||||
| Conservative | Marc Boudreau | 11,360 | 16.41 | -7.28 | ||||
| Liberal | Lyne Pelchat | 8,023 | 11.59 | -9.74 | ||||
| Green | Jean-Yves Massenet | 1,864 | 2.69 | -1.32 | ||||
| Total valid votes/Expense limit | 69,205 | 100.00 | ||||||
| Total rejected ballots | 763 | 1.09 | ||||||
| Turnout | 69,968 | 67.23 | ||||||
| Canadian federal election, 2008 | ||||||||
|---|---|---|---|---|---|---|---|---|
| Party | Candidate | Votes | % | ±% | Expenditures | |||
| Bloc Québécois | Meili Faille | 27,044 | 41.34 | -1.82 | $80,072 | |||
| Conservative | Michael Fortier | 15,496 | 23.69 | +4.69 | $87,967 | |||
| Liberal | Brigitte Legault | 13,954 | 21.33 | -6.96 | $32,958 | |||
| New Democratic | Maxime Héroux-Legault | 6,298 | 9.63 | +4.09 | $1,519 | |||
| Green | Jean-Yves Massenet | 2,625 | 4.01 | +0.10 | $1,913 | |||
| Total valid votes/Expense limit | 65,417 | 100.00 | $96,487 | |||||
| Total rejected ballots | 729 | 1.10 | ||||||
| Turnout | 66,146 | 67.76 | ||||||
| Canadian federal election, 2006 | ||||||||
|---|---|---|---|---|---|---|---|---|
| Party | Candidate | Votes | % | ±% | Expenditures | |||
| Bloc Québécois | Meili Faille | 27,012 | 43.16 | -1.13 | $85,133 | |||
| Liberal | Marc Garneau | 17,768 | 28.39 | -10.41 | $79,413 | |||
| Conservative | Stephane Bourgon | 11,889 | 19.00 | +10.81 | $35,090 | |||
| New Democratic | Bert Markgraf | 3,468 | 5.54 | +1.64 | $3,385 | |||
| Green | Pierre Pariseau-Legault | 2,450 | 3.91 | +0.14 | $1,144 | |||
| Total valid votes/Expense limit | 62,587 | 100.00 | $85,543 | |||||
| Canadian federal election, 2004 | ||||||||
|---|---|---|---|---|---|---|---|---|
| Party | Candidate | Votes | % | ±% | Expenditures | |||
| Bloc Québécois | Meili Faille | 24,675 | 44.29 | +4.31 | $67,962 | |||
| Liberal | Nick Discepola | 21,613 | 38.80 | -12.77 | $57,607 | |||
| Conservative | Robert Ramage | 4,558 | 8.18 | -3.99 | $25,438 | |||
| New Democratic | Bert Markgraf | 2,175 | 3.90 | +2.13 | $2,698 | |||
| Green | Julie C. Baribeau | 2,103 | 3.77 | – | $1,206 | |||
| Marijuana | Charles Soucy | 585 | 1.05 | – | ||||
| Total valid votes/Expense limit | 55,709 | 100.00 | $81,759 | |||||
Note: Conservative vote is compared to the total of the Canadian Alliance vote and Progressive Conservative vote in 2000 election.
| Canadian federal election, 2000 | ||||||||
|---|---|---|---|---|---|---|---|---|
| Party | Candidate | Votes | % | ±% | ||||
| Liberal | Nick Discepola | 26,292 | 51.56 | +6.56 | ||||
| Bloc Québécois | Éric Cimon | 17,587 | 34.49 | +1.09 | ||||
| Alliance | Dean Drysdale | 4,188 | 8.21 | +7.12 | ||||
| Progressive Conservative | Stratos Psarianos | 2,020 | 3.96 | -14.59 | ||||
| New Democratic | Shaun G. Lynch | 904 | 1.77 | +0.75 | ||||
| Total valid votes | 50,991 | 100.00 | ||||||
Note: Canadian Alliance vote is compared to the Reform vote in 1997 election.
| Canadian federal election, 1997 | ||||||||
|---|---|---|---|---|---|---|---|---|
| Party | Candidate | Votes | % | |||||
| Liberal | Nick Discepola | 23,676 | 45.00 | |||||
| Bloc Québécois | René St-Onge | 17,574 | 33.40 | |||||
| Progressive Conservative | Jean Lajoie | 9,760 | 18.55 | |||||
| Reform | Peter McLoughlin | 573 | 1.09 | |||||
| New Democratic | Jason Sigurdson | 538 | 1.02 | |||||
| Natural Law | Eric E. Simon | 490 | 0.93 | |||||
| Total valid votes | 52,611 | 100.00 | ||||||
Vaudreuil—Soulanges, 1917–1968
| Canadian federal election, 1965 | ||||||||
|---|---|---|---|---|---|---|---|---|
| Party | Candidate | Votes | % | ±% | ||||
| Liberal | René Émard | 8,955 | 50.79 | +1.04 | ||||
| Progressive Conservative | Marcel Bourbonnais | 6,580 | 37.32 | +2.59 | ||||
| New Democratic | Roger Carrier | 1,346 | 7.63 | |||||
| Ralliement créditiste | Jean-Marie Veilleux | 750 | 4.25 | -9.22 | ||||
| Total valid votes | 17,631 | 100.00 | ||||||
Note: Ralliement créditiste vote is compared to Social Credit vote in the 1963 election.
| Canadian federal election, 1963 | ||||||||
|---|---|---|---|---|---|---|---|---|
| Party | Candidate | Votes | % | ±% | ||||
| Liberal | René Émard | 8,639 | 49.75 | +3.72 | ||||
| Progressive Conservative | J.-Marcel Bourbonnais | 6,031 | 34.73 | -12.81 | ||||
| Social Credit | Marcel Lessard | 2,340 | 13.48 | +7.05 | ||||
| Independent | Gérard Raymond | 354 | 2.04 | |||||
| Total valid votes | 17,364 | 100.00 | ||||||
| Canadian federal election, 1962 | ||||||||
|---|---|---|---|---|---|---|---|---|
| Party | Candidate | Votes | % | ±% | ||||
| Progressive Conservative | J.-Marcel Bourbonnais | 8,392 | 47.54 | -5.33 | ||||
| Liberal | Pierre Léger | 8,126 | 46.03 | -1.09 | ||||
| Social Credit | Gabriel Godin | 1,135 | 6.43 | |||||
| Total valid votes | 17,653 | 100.00 | ||||||
| Canadian federal election, 1958 | ||||||||
|---|---|---|---|---|---|---|---|---|
| Party | Candidate | Votes | % | ±% | ||||
| Progressive Conservative | Marcel Bourbonnais | 8,161 | 52.87 | +21.36 | ||||
| Liberal | Armand Asselin | 7,274 | 47.13 | -21.36 | ||||
| Total valid votes | 15,435 | 100.00 | ||||||
| Canadian federal election, 1957 | ||||||||
|---|---|---|---|---|---|---|---|---|
| Party | Candidate | Votes | % | ±% | ||||
| Liberal | Louis-René Beaudoin | 9,055 | 68.49 | -10.48 | ||||
| Progressive Conservative | Marcel Bourbonnais | 4,166 | 31.51 | +10.48 | ||||
| Total valid votes | 13,221 | 100.00 | ||||||
| Canadian federal election, 1953 | ||||||||
|---|---|---|---|---|---|---|---|---|
| Party | Candidate | Votes | % | ±% | ||||
| Liberal | Louis-René Beaudoin | 8,463 | 78.97 | +11.40 | ||||
| Progressive Conservative | Roger-Paul Sullivan | 2,254 | 21.03 | -11.40 | ||||
| Total valid votes | 10,717 | 100.00 | ||||||
| Canadian federal election, 1949 | ||||||||
|---|---|---|---|---|---|---|---|---|
| Party | Candidate | Votes | % | ±% | ||||
| Liberal | Louis-René Beaudoin | 7,622 | 67.56 | +4.62 | ||||
| Progressive Conservative | J.-Omer Lalonde | 3,659 | 32.44 | |||||
| Total valid votes | 11,281 | 100.00 | ||||||
| Canadian federal election, 1945 | ||||||||
|---|---|---|---|---|---|---|---|---|
| Party | Candidate | Votes | % | ±% | ||||
| Liberal | Louis-René Beaudoin | 6,267 | 62.94 | +14.75 | ||||
| Independent | Jean Lamarche | 1,880 | 18.88 | |||||
| Bloc populaire | Robert Stocker | 1,619 | 16.26 | |||||
| Co-operative Commonwealth | J.-Albert Bourbonnais | 191 | 1.92 | |||||
| Total valid votes | 9,957 | 100.00 | ||||||
| Canadian federal election, 1940 | ||||||||
|---|---|---|---|---|---|---|---|---|
| Party | Candidate | Votes | % | ±% | ||||
| Liberal | Joseph Thauvette | 4,381 | 48.19 | -19.95 | ||||
| National Government | J.-E.-Philippe Deguire | 2,210 | 24.31 | -4.38 | ||||
| Independent Liberal | Édouard Charlebois | 1,441 | 15.85 | |||||
| Independent Liberal | J.-Ernest Chevrier | 1,059 | 11.65 | |||||
| Total valid votes | 9,091 | 100.00 | ||||||
Note: "National Government" vote is compared to Conservative vote in 1935 election.
| Canadian federal election, 1935 | ||||||||
|---|---|---|---|---|---|---|---|---|
| Party | Candidate | Votes | % | ±% | ||||
| Liberal | Joseph Thauvette | 5,983 | 68.14 | +17.17 | ||||
| Conservative | Horace-Joseph Gagné | 2,519 | 28.69 | -0.05 | ||||
| Reconstruction | Albert Lacombe | 279 | 3.18 | |||||
| Total valid votes | 8,781 | 100.00 | ||||||
| Canadian federal election, 1930 | ||||||||
|---|---|---|---|---|---|---|---|---|
| Party | Candidate | Votes | % | ±% | ||||
| Liberal | Joseph Thauvette | 4,313 | 50.96 | -17.07 | ||||
| Conservative | Horace-Joseph Gagné | 2,432 | 28.74 | |||||
| Independent Liberal | Roland-Gilles Mousseau | 1,718 | 20.30 | -6.95 | ||||
| Total valid votes | 8,463 | 100.00 | ||||||
| Canadian federal by-election, 29 July 1929 | ||||||||
|---|---|---|---|---|---|---|---|---|
| Party | Candidate | Votes | % | ±% | ||||
| On Mr. Wilson's resignation, 1 February 1929 | ||||||||
| Liberal | Lawrence Alexander Wilson | 4,409 | 68.03 | -6.44 | ||||
| Independent Liberal | Roland-Gilles Mousseau | 1,766 | 27.25 | |||||
| Independent Liberal | Émile Gagné | 306 | 4.72 | |||||
| Total valid votes | 6,481 | 100.00 | ||||||
| Canadian federal election, 1926 | ||||||||
|---|---|---|---|---|---|---|---|---|
| Party | Candidate | Votes | % | ±% | ||||
| Liberal | Lawrence Alexander Wilson | 5,391 | 74.47 | -2.23 | ||||
| Conservative | Eugène Leroux | 1,848 | 25.53 | +2.23 | ||||
| Total valid votes | 7,239 | 100.00 | ||||||
| Canadian federal election, 1925 | ||||||||
|---|---|---|---|---|---|---|---|---|
| Party | Candidate | Votes | % | ±% | ||||
| Liberal | Lawrence Alexander Wilson | 5,554 | 76.70 | +13.17 | ||||
| Conservative | Eugène Leroux | 1,687 | 23.30 | |||||
| Total valid votes | 7,241 | 100.00 | ||||||
Note: Change in popular vote is calculated from popular vote in the 1921 general election.
| By-election on 21 March 1922
On Mr. Boyer being called to the Senate, 11 March 1922 | |||||
| Party | Candidate | Votes | |||
|---|---|---|---|---|---|
| Liberal | Joseph-Rodolphe Ouimet | acclaimed | |||
| Canadian federal election, 1921 | ||||||||
|---|---|---|---|---|---|---|---|---|
| Party | Candidate | Votes | % | ±% | ||||
| Liberal | Gustave Boyer | 5,366 | 63.53 | -27.37 | ||||
| Independent | Adrien Pharand | 2,787 | 33.00 | |||||
| Progressive | Julien Charlebois | 293 | 3.47 | |||||
| Total valid votes | 8,446 | 100.00 | ||||||
Note: Liberal vote is compared to Opposition vote in 1917 general election.
| Canadian federal election, 1917 | ||||||||
|---|---|---|---|---|---|---|---|---|
| Party | Candidate | Votes | % | |||||
| Opposition (Laurier Liberals) | Gustave Boyer | 4,075 | 90.90 | |||||
| Government (Unionist) | Julien-Firmin Bissonnette | 408 | 9.10 | |||||
| Total valid votes | 4,483 | 100.00 | ||||||
See also
References
- "(Code 24073) Census Profile". 2011 census. Statistics Canada. 2012. Retrieved 2011-03-07.
- Campaign expense data from Elections Canada
Riding history from the Library of Parliament:
- Vaudreuil--Soulanges, Quebec (1914–1966)
- Vaudreuil--Soulanges, Quebec (1997–2008)
- 2011 Results from Elections Canada
Notes