Abitibi—Témiscamingue
Coordinates: 47°18′N 79°00′W / 47.30°N 79.00°W
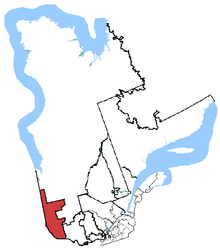 Abitibi—Témiscamingue in relation to other Quebec federal electoral districts | |||
| Federal electoral district | |||
| Legislature | House of Commons | ||
| MP |
New Democratic | ||
| District created | 2003 | ||
| First contested | 2004 | ||
| Last contested | 2015 | ||
| District webpage | profile, map | ||
| Demographics | |||
| Population (2016)[1] | 103,491 | ||
| Electors (2015) | 82,695 | ||
| Area (km²)[2] | 33,444.46 | ||
| Pop. density (per km²) | 3.1 | ||
| Census divisions | Abitibi RCM, Abitibi-Ouest RCM, Jamésie Territory, Rouyn-Noranda, Témiscamingue RCM | ||
| Census subdivisions | Amos, Barraute, La Sarre, Rouyn-Noranda, Témiscaming, Ville-Marie | ||
- For the region of Quebec, see Abitibi-Témiscamingue.
Abitibi—Témiscamingue is a federal electoral district in Quebec, Canada, that has been represented in the House of Commons of Canada since 2004. The area was also represented by the electoral district of Témiscamingue from 1968 until 2004.
Geography
The district includes the Regional County Municipalities of Témiscamingue, Abitibi, Abitibi-Ouest, the City of Rouyn-Noranda and a small section of south western Jamésie Territory.
The neighbouring ridings are Abitibi—Baie-James—Nunavik—Eeyou, Pontiac, Renfrew—Nipissing—Pembroke, Nipissing—Timiskaming, and Timmins—James Bay.
History
Témiscamingue was created in 1968 from parts of Pontiac—Témiscamingue and Villeneuve.
It was initially defined to consist of:
- the Cities of Noranda and Rouyn;
- the Towns of Belleterre, Temiscaming and Ville-Marie;
- the County of Témiscamingue (except the Townships of Béraud, Chabert, Darlens, Desroberts, Granet, Jourdan, Landanet, Laubanie, Marrias, Mazérac, Pélissier and Sabourin without local municipal organization).
In 1976, it was redefined to consist of:
- the Cities of Noranda and Rouyn;
- the Towns of Belleterre, Duparquet, La Sarre, Macamic, Temiscaming and Ville-Marie;
- the County of Témiscamingue; and
- parts of the County of Abitibi.
In 1987, it was redefined to consist of:
- the towns of Belleterre, Duparquet, La Sarre, Macamic, Noranda, Rouyn, Témiscaming and Ville-Marie;
- the County of Témiscamingue excluding the Territory of Témiscamingue-Lac-Granet portion;
- parts of the County of Abitibi; and
- the southwest part of the Municipality of James Bay.
It was renamed "Rouyn-Noranda—Témiscamingue" in 1996, and redefined to consist of:
- the cities of Belleterre, Cadillac, Duparquet, La Sarre, Macamic, Rouyn-Noranda, Témiscaming and Ville-Marie;
- the county regional municipalities of Abitibi-Ouest and Rouyn-Noranda;
- the County Regional Municipality of Témiscamingue, including Timiscaming Indian Reserve No. 19 and Eagle Village First Nation-Kipawa Indian Reserve, the Indian settlements of Hunter's Point and Winneway; and
- the southwest part of the Municipality of James Bay.
In 1997, it was renamed "Témiscamingue".
The electoral district was abolished in 2003 when it was merged into Abitibi—Témiscamingue.
Abitibi—Témiscamingue was created in 2003. 77.1% came from Témiscamingue, and 22.9% from neighbouring Abitibi—Baie-James—Nunavik riding.
The riding lost a small territory to Abitibi—Baie-James—Nunavik—Eeyou as a result of the 2012 electoral redistribution.
Members of Parliament
This riding has elected the following members of the House of Commons of Canada:
| Parliament | Years | Member | Party | |
|---|---|---|---|---|
| Témiscamingue Riding created from Pontiac—Témiscamingue and Villeneuve |
||||
| 28th | 1968–1971 | Réal Caouette | Ralliement créditiste | |
| 1971–1972 | Social Credit | |||
| 29th | 1972–1974 | |||
| 30th | 1974–1976 | |||
| 1977–1979 | Gilles Caouette | |||
| 31st | 1979–1980 | Henri Tousignant | Liberal | |
| 32nd | 1980–1984 | |||
| 33rd | 1984–1988 | Gabriel Desjardins | Progressive Conservative | |
| 34th | 1988–1993 | |||
| 35th | 1993–1997 | Pierre Brien | Bloc Québécois | |
| 36th | 1997–2000 | |||
| 37th | 2000–2003 | |||
| 2003–2004 | Gilbert Barrette | Liberal | ||
| Abitibi—Témiscamingue | ||||
| 38th | 2004–2006 | Marc Lemay | Bloc Québécois | |
| 39th | 2006–2008 | |||
| 40th | 2008–2011 | |||
| 41st | 2011–2015 | Christine Moore | New Democratic | |
| 42nd | 2015–Present | |||
Election results
Abitibi—Témiscamingue, 2004–present
| Canadian federal election, 2015 | ||||||||
|---|---|---|---|---|---|---|---|---|
| Party | Candidate | Votes | % | ±% | Expenditures | |||
| New Democratic | Christine Moore | 20,636 | 41.50 | -9.75 | $20,806.53 | |||
| Liberal | Claude Thibault | 14,733 | 29.63 | +23.71 | $42,117.75 | |||
| Bloc Québécois | Yvon Moreau | 9,651 | 19.41 | -12.09 | $31,557.76 | |||
| Conservative | Benoit Fortin | 3,425 | 6.89 | -3.01 | $1,743.82 | |||
| Green | Aline Bégin | 859 | 1.73 | +0.30 | $6,188.67 | |||
| Rhinoceros | Pascal Le Fou Gélinas | 425 | 0.90 | – | – | |||
| Total valid votes/Expense limit | 49,729 | 100.0 | $253,899.84 | |||||
| Total rejected ballots | 741 | – | – | |||||
| Turnout | 50,470 | 62.25 | +2.4 | |||||
| Eligible voters | 82,695 | |||||||
| Source: Elections Canada[3][4] | ||||||||
| 2011 federal election redistributed results[5] | |||
|---|---|---|---|
| Party | Vote | % | |
| New Democratic | 24,583 | 51.25 | |
| Bloc Québécois | 15,110 | 31.50 | |
| Conservative | 4,750 | 9.90 | |
| Liberal | 2,839 | 5.92 | |
| Green | 687 | 1.43 | |
| Canadian federal election, 2011 | ||||||||
|---|---|---|---|---|---|---|---|---|
| Party | Candidate | Votes | % | ±% | Expenditures | |||
| New Democratic | Christine Moore | 24,763 | 51.22 | +41.72 | $2,097.91 | |||
| Bloc Québécois | Marc Lemay | 15,258 | 31.56 | -16.35 | $100,215.97 | |||
| Conservative | Steven Hébert | 4,777 | 9.88 | -9.05 | $9,584.76 | |||
| Liberal | Suzie Grenon | 2,859 | 5.91 | -14.82 | $5,088.94 | |||
| Green | Patrick Rochon | 694 | 1.44 | -0.79 | ||||
| Total valid votes/Expense limit | 48,351 | 100.00 | ||||||
| Total rejected ballots | 654 | 1.33 | ||||||
| Turnout | 49,005 | 59.85 | ||||||
| New Democratic Party gain from Bloc Québécois | Swing | +29.0 | ||||||
| Canadian federal election, 2008 | ||||||||
|---|---|---|---|---|---|---|---|---|
| Party | Candidate | Votes | % | ±% | Expenditures | |||
| Bloc Québécois | Marc Lemay | 20,929 | 47.91 | -4.42 | $96,091 | |||
| Liberal | Gilbert Barrette | 9,055 | 20.73 | +6.92 | $29,810 | |||
| Conservative | Pierre Grandmaitre | 8,267 | 18.93 | -3.66 | $742 | |||
| New Democratic | Christine Moore | 4,151 | 9.50 | +0.96 | $3,377 | |||
| Green | Bruno Côté | 976 | 2.23 | -0.50 | $742 | |||
| Independent | Ghislain Loiselle | 302 | 0.69 | – | $644 | |||
| Total valid votes/Expense limit | 43,680 | 100.00 | $101,466 | |||||
| Canadian federal election, 2006 | ||||||||
|---|---|---|---|---|---|---|---|---|
| Party | Candidate | Votes | % | ±% | Expenditures | |||
| Bloc Québécois | Marc Lemay | 24,637 | 52.33 | -5.32 | $73,954 | |||
| Conservative | Marie-Josée Carbonneau | 10,634 | 22.59 | +17.01 | $6,194 | |||
| Liberal | Charles Lavergne | 6,501 | 13.81 | -17.17 | $21,500 | |||
| New Democratic | Christine Moore | 4,022 | 8.54 | +5.15 | $2,782 | |||
| Green | Patrick Rancourt | 1,283 | 2.73 | +0.34 | $710 | |||
| Total valid votes/Expense limit | 47,077 | 100.00 | $94,667 | |||||
| Bloc Québécois hold | Swing | -11.2 | ||||||
| Canadian federal election, 2004 | ||||||||
|---|---|---|---|---|---|---|---|---|
| Party | Candidate | Votes | % | ±% | Expenditures | |||
| Bloc Québécois | Marc Lemay | 25,041 | 57.66 | +22.51 | $80,876 | |||
| Liberal | Gilbert Barrette | 13,457 | 30.98 | -26.03 | $75,073 | |||
| Conservative | Bernard Hugues Beauchesne | 2,425 | 5.58 | +1.02 | $4,435 | |||
| New Democratic | Dennis Shushack | 1,472 | 3.39 | 0.11 | $3,825 | |||
| Green | Patrick Rancourt | 1,037 | 2.39 | – | $285 | |||
| Total valid votes/Expense limit | 43,432 | 100.00 | $93,778 | |||||
Témiscamingue, 1968–2004
By-election: On Mr. Brien's resignation, 14 March 2003:
| By-election on June 16, 2003 | ||||||
| Party | Candidate | Votes | % | ±% | ||
|---|---|---|---|---|---|---|
| Liberal | Gilbert Barrette | 10,195 | 57.01 | +14.26 | ||
| Bloc Québécois | Sylvain Sauvageau | 6,287 | 35.15 | -14.99 | ||
| Progressive Conservative | Rachel Lord | 733 | 4.10 | 1.96 | ||
| New Democratic | Dennis Shushack | 587 | 3.28 | 1.97 | ||
| Alliance | Clarence Marshall | 82 | 0.46 | -3.19 | ||
| Total valid votes | 17,884 | 100.00 | – | |||
| Canadian federal election, 2000 | ||||||||
|---|---|---|---|---|---|---|---|---|
| Party | Candidate | Votes | % | ±% | ||||
| Bloc Québécois | Pierre Brien | 18,803 | 50.14 | +3.52 | ||||
| Liberal | Roch Charron | 16,032 | 42.75 | +10.85 | ||||
| Alliance | Eric Larochelle | 1,368 | 3.65 | |||||
| Progressive Conservative | Sébastien Héroux | 805 | 2.14 | -17.69 | ||||
| New Democratic | Anik-Maude Morin | 489 | 1.31 | -0.34 | ||||
| Total valid votes | 37,497 | 100.00 | – | |||||
| Canadian federal election, 1997 | ||||||||
|---|---|---|---|---|---|---|---|---|
| Party | Candidate | Votes | % | ±% | ||||
| Bloc Québécois | Pierre Brien | 18,528 | 46.62 | -9.12 | ||||
| Liberal | Nora Bélanger-Teed | 12,678 | 31.90 | +9.03 | ||||
| Progressive Conservative | Denis Pilon | 7,879 | 19.83 | +0.49 | ||||
| New Democratic | Anik-Maude Morin | 654 | 1.65 | |||||
| Total valid votes | 39,739 | 100.00 | – | |||||
| Canadian federal election, 1993 | ||||||||
|---|---|---|---|---|---|---|---|---|
| Party | Candidate | Votes | % | ±% | ||||
| Bloc Québécois | Pierre Brien | 22,555 | 55.74 | |||||
| Liberal | Gilles Héroux | 9,246 | 22.87 | +8.72 | ||||
| Progressive Conservative | Gabriel Desjardins | 7,806 | 19.34 | -26.91 | ||||
| Natural Law | Grégoire Deguire | 530 | 1.31 | |||||
| Abolitionist | Célyne Ayotte | 300 | 0.74 | |||||
| Total valid votes | 40,437 | 100.00 | – | |||||
| Canadian federal election, 1988 | ||||||||
|---|---|---|---|---|---|---|---|---|
| Party | Candidate | Votes | % | ±% | ||||
| Progressive Conservative | Gabriel Desjardins | 19,106 | 46.28 | -3.96 | ||||
| New Democratic | Rémy Trudel | 15,623 | 37.84 | +32.44 | ||||
| Liberal | Laurent Guertin | 5,843 | 14.15 | -19.81 | ||||
| Rhinoceros | Jean Ouellet | 712 | 1.72 | -1.88 | ||||
| Total valid votes | 41,284 | 100.00 | – | |||||
| Canadian federal election, 1984 | ||||||||
|---|---|---|---|---|---|---|---|---|
| Party | Candidate | Votes | % | ±% | ||||
| Progressive Conservative | Gabriel Desjardins | 20,347 | 50.24 | +45.02 | ||||
| Liberal | Henri Tousignant | 13,756 | 33.96 | -27.06 | ||||
| New Democratic | Guy Verville | 2,189 | 5.40 | +1.01 | ||||
| Nationaliste | Roberte Parent | 2,126 | 5.25 | +3.84 | ||||
| Rhinoceros | Marcel Yves Bégin | 1,457 | 3.60 | +0.26 | ||||
| Social Credit | Rachel Lord | 626 | 1.55 | -22.42 | ||||
| Total valid votes | 40,501 | 100.00 | – | |||||
| Canadian federal election, 1980 | ||||||||
|---|---|---|---|---|---|---|---|---|
| Party | Candidate | Votes | % | ±% | ||||
| Liberal | Henri Tousignant | 22,031 | 61.02 | +19.7 | ||||
| Social Credit | Roger Bureau | 8,653 | 23.97 | -15.17 | ||||
| Progressive Conservative | Bernard Martel | 1,886 | 5.22 | -6.70 | ||||
| New Democratic | Marc Lord | 1,586 | 4.39 | +0.62 | ||||
| Rhinoceros | Michel Célestin Massicotte | 1,206 | 3.34 | +0.53 | ||||
| Union populaire | Réjean Fortier | 510 | 1.41 | +0.61 | ||||
| Independent | Ted McLaren | 136 | 0.38 | |||||
| Marxist–Leninist | Pierre-Jean Lafleur | 96 | 0.27 | +0.03 | ||||
| Total valid votes | 36,104 | 100.00 | – | |||||
| Canadian federal election, 1979 | ||||||||
|---|---|---|---|---|---|---|---|---|
| Party | Candidate | Votes | % | ±% | ||||
| Liberal | Henri Tousignant | 16,147 | 41.32 | +6.03 | ||||
| Social Credit | Gilles Caouette | 15,295 | 39.14 | -6.52 | ||||
| Progressive Conservative | Normand Grimard | 4,659 | 11.92 | -2.99 | ||||
| New Democratic | Germain Boudreau | 1,473 | 3.77 | +1.98 | ||||
| Rhinoceros | Raymond Paquin | 1,099 | 2.81 | |||||
| Union populaire | Marcel Lortie | 311 | 0.80 | |||||
| Marxist–Leninist | Fernand Deschamps | 92 | 0.24 | |||||
| Total valid votes | 39,076 | 100.00 | – | |||||
By-election: On Mr. Réal Caouette's death, 16 December 1976
| By-election on 24 June 1977 | ||||||
| Party | Candidate | Votes | % | ±% | ||
|---|---|---|---|---|---|---|
| Social Credit | Gilles Caouette | 9,603 | 45.66 | -18.25 | ||
| Liberal | Gaston Pratte | 7,422 | 35.29 | +6.15 | ||
| Progressive Conservative | Normand Grimard | 3,136 | 14.91 | +11.99 | ||
| Communist | Guy Desautels | 495 | 2.35 | |||
| New Democratic | Réal Bellehumeur | 377 | 1.79 | -2.24 | ||
| Total valid votes | 21,033 | 100.00 | – | |||
| Canadian federal election, 1974 | ||||||||
|---|---|---|---|---|---|---|---|---|
| Party | Candidate | Votes | % | ±% | ||||
| Social Credit | Réal Caouette | 14,026 | 63.91 | +0.69 | ||||
| Liberal | Jacquelin Bergeron | 6,396 | 29.14 | +1.97 | ||||
| New Democratic | Réal Bellehumeur | 884 | 4.03 | +0.91 | ||||
| Progressive Conservative | Wilbrod Ayotte | 641 | 2.92 | -0.12 | ||||
| Total valid votes | 21,947 | 100.00 | – | |||||
| Canadian federal election, 1972 | ||||||||
|---|---|---|---|---|---|---|---|---|
| Party | Candidate | Votes | % | ±% | ||||
| Social Credit | Réal Caouette | 15,660 | 63.22 | +4.84 | ||||
| Liberal | Jacquelin Bergeron | 6,731 | 27.17 | -3.59 | ||||
| Independent | Claude Banville | 854 | 3.45 | |||||
| New Democratic | Charles Carpenter | 774 | 3.12 | +0.53 | ||||
| Progressive Conservative | Roger Rioux | 752 | 3.04 | -5.22 | ||||
| Total valid votes | 24,771 | 100.00 | – | |||||
| Canadian federal election, 1968 | ||||||||
|---|---|---|---|---|---|---|---|---|
| Party | Candidate | Votes | % | |||||
| Ralliement créditiste | Réal Caouette | 12,532 | 58.38 | |||||
| Liberal | Côme-A. Lapierre | 6,603 | 30.76 | |||||
| Progressive Conservative | Aurore Charron-Labrie | 1,774 | 8.26 | |||||
| New Democratic | George Wormsley | 556 | 2.59 | |||||
| Total valid votes | 21,465 | 100.00 | ||||||
See also
References
- "(Code 24001) Census Profile". 2011 census. Statistics Canada. 2012. Retrieved 2011-03-07.
- Elections Canada 2011 results
- Riding history from the Library of Parliament
- (1966 - 1996)
- (1996 - 1997)
- (1997 - 2003)
- Campaign expense data from Elections Canada