Laurier—Sainte-Marie
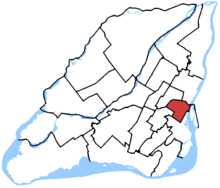 Laurier—Sainte-Marie in relation to other federal electoral districts in Montreal and Laval (2013 boundaries) | |||
| Federal electoral district | |||
| Legislature | House of Commons | ||
| MP |
New Democratic | ||
| District created | 1987 | ||
| First contested | 1988 | ||
| Last contested | 2015 | ||
| District webpage | profile, map | ||
| Demographics | |||
| Population (2016)[1] | 111,835 | ||
| Electors (2015) | 83,730 | ||
| Area (km²)[2] | 10.40 | ||
| Pop. density (per km²) | 10,753.4 | ||
| Census divisions | Montreal | ||
| Census subdivisions | Montreal | ||
Laurier—Sainte-Marie is a federal electoral district in Downtown Montreal, Quebec, Canada, that has been represented in the House of Commons of Canada since 1988. Its population in 2006 was 101,758.
Geography
The district includes Côte Saint-Louis and the eastern parts of The Plateau and Mile End in the Borough of Le Plateau-Mont-Royal and the eastern part of Downtown Montreal and the western part of Centre-Sud (including part of the neighbourhood of Sainte-Marie) in the Borough of Ville-Marie.
History
In 1987, the district of "Laurier—Sainte-Marie" was created from Laurier, Montreal—Sainte-Marie and Saint-Jacques ridings.
In 2003, Laurier—Sainte-Marie was abolished when it was redistributed into Laurier and Hochelaga ridings.
After the 2004 election, Laurier riding was renamed "Laurier—Sainte-Marie" in 2004.
The name comes from Laurier Avenue, a street in Plateau Mont-Royal named after Wilfrid Laurier, and Sainte-Marie, a former name for Centre-Sud, which in turn came from a parish church dedicated to Saint Mary.
The riding was represented by Gilles Duceppe, leader of the Bloc Québécois, until 2011 when he was defeated by Hélène Laverdière of the New Democratic Party.
This riding lost territory to Outremont and Ville-Marie—Le Sud-Ouest—Île-des-Sœurs, and gained territory from Hochelaga, Westmount—Ville-Marie and Outremont during the 2012 electoral redistribution.
Former boundaries
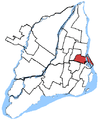 2004 to 2011 election
Demographics
- According to the Canada 2006 Census
Racial groups: 84.9% White, 3.6% Black, 2.9% Latin American, 2.1% Chinese, 1.8% Arab, 1.5% Southeast Asian, 1.4% South Asian
Religions (2001): 68.5% Catholic, 2.8% Muslim, 2.8% Protestant, 1.4% Buddhist, 1.1% Christian Orthodox, 1.0% Other Christian, 21.0% No religion
Average income: $25,079
- According to the Canada 2016 Census
- Twenty most common mother tongue languages (2016) : 70.9% French, 10.4% English, 4.1% Spanish, 2.3% Arabic, 1.4% Mandarin, 1.2% Portuguese, 1.2% Cantonese, 0.9% Bengali, 0.7% Farsi, 0.7% Vietnamese, 0.6% Russian, 0.5% Italian, 0.4% German, 0.4% Romanian, 0.3% Creole languages, 0.3% Polish, 0.2% Greek, 0.2% Korean, 0.2% Japanese, 0.2% Turkish[3]
Riding Associations
Riding associations are the local branches of political parties:
| Party | Association Name | CEO | HQ Address | |
| Communist | Laurier—Sainte-Marie EDA, CPC | Pierre Fontaine | 1703 Létourneux | |
| Conservative | Laurier—Sainte-Marie Conservative Association | Bertrane Royer | 4390 Rue de Mentana | |
| Green | Association du Parti Vert du Canada de Laurier—Sainte-Marie | Amara Diallo | 314-1150, rue Marie-Anne Est | |
| Liberal | Laurier—Sainte-Marie Federal Liberal Association | Sendanga Yeba | 5323 Avenue de Lorimier | |
| New Democratic | NDP Riding Association of Laurier—Sainte-Marie | Nicholas Trottier | 312B-4821 Boulevard Saint-Laurent | |
Members of Parliament
This riding has elected the following Members of Parliament:
| Parliament | Years | Member | Party | |
|---|---|---|---|---|
| Laurier—Sainte-Marie Riding created from Laurier, Montreal—Sainte-Marie and Saint-Jacques |
||||
| 34th | 1988–1990 | Jean-Claude Malépart | Liberal | |
| 1990–1993 | Gilles Duceppe | Independent | ||
| 35th | 1993–1997 | Bloc Québécois | ||
| 36th | 1997–2000 | |||
| 37th | 2000–2004 | |||
| Laurier | ||||
| 38th | 2004–2006 | Gilles Duceppe | Bloc Québécois | |
| Laurier—Sainte-Marie | ||||
| 39th | 2006–2008 | Gilles Duceppe | Bloc Québécois | |
| 40th | 2008–2011 | |||
| 41st | 2011–2015 | Hélène Laverdière | New Democratic | |
| 42nd | 2015–Present | |||
Election results
| Canadian federal election, 2015 | ||||||||
|---|---|---|---|---|---|---|---|---|
| Party | Candidate | Votes | % | ±% | Expenditures | |||
| New Democratic | Hélène Laverdière | 20,929 | 38.27 | -8.21 | $89,556.47 | |||
| Bloc Québécois | Gilles Duceppe | 15,699 | 28.71 | -6.23 | $57,168.55 | |||
| Liberal | Christine Poirier | 12,938 | 23.66 | +12.99 | $38,580.06 | |||
| Conservative | Daniel Gaudreau | 2,242 | 4.10 | +0.15 | $4,220.00 | |||
| Green | Cyrille Giraud | 1,904 | 3.48 | +0.84 | $4,793.71 | |||
| Libertarian | Stéphane Beaulieu | 604 | 1.10 | – | – | |||
| Independent | Julien Bernatchez | 160 | 0.29 | – | – | |||
| Marxist–Leninist | Serge Lachapelle | 103 | 0.19 | – | – | |||
| Communist | Pierre Fontaine | 102 | 0.19 | – | – | |||
| Total valid votes/Expense limit | 54,681 | 100.00 | $221,434.26 | |||||
| Total rejected ballots | 594 | 1.07 | – | |||||
| Turnout | 55,275 | 65.69 | – | |||||
| Eligible voters | 84,142 | |||||||
| New Democratic hold | Swing | -0.99 | ||||||
| Source: Elections Canada[4][5] | ||||||||
| 2011 federal election redistributed results[6] | |||
|---|---|---|---|
| Party | Vote | % | |
| New Democratic | 23,749 | 46.48 | |
| Bloc Québécois | 17,853 | 34.94 | |
| Liberal | 5,451 | 10.67 | |
| Conservative | 2,019 | 3.95 | |
| Green | 1,348 | 2.64 | |
| Others | 677 | 1.32 | |
| Canadian federal election, 2011 | ||||||||
|---|---|---|---|---|---|---|---|---|
| Party | Candidate | Votes | % | ±% | Expenditures | |||
| New Democratic | Hélène Laverdière | 23,373 | 46.64 | +29.53 | $22,982 | |||
| Bloc Québécois | Gilles Duceppe | 17,991 | 35.90 | −14.34 | $81,167 | |||
| Liberal | Philippe Allard | 4,976 | 9.93 | −8.40 | $16,728 | |||
| Conservative | Charles K. Langford | 1,764 | 3.52 | −1.31 | $4,611 | |||
| Green | Olivier Adam | 1,324 | 2.64 | −5.28 | $1,532 | |||
| Rhinoceros | François Yo Gourd | 398 | 0.79 | −0.14 | none listed | |||
| Communist | Sylvain Archambault | 137 | 0.27 | +0.10 | $1,606 | |||
| Marxist–Leninist | Serge Lachapelle | 77 | 0.15 | −0.09 | none listed | |||
| Independent | Dimitri Mourkes | 73 | 0.15 | none listed | ||||
| Total valid votes/Expense limit | 50,113 | 100.00 | ||||||
| Total rejected ballots | 471 | 0.93 | ||||||
| Turnout | 50,584 | 63.41 | ||||||
| Electors on the lists | 79,772 | |||||||
| New Democratic gain from Bloc Québécois | Swing | +21.94% | ||||||
| Source: Official Results, Elections Canada and Financial Returns, Elections Canada. | ||||||||
| Canadian federal election, 2008 | ||||||||
|---|---|---|---|---|---|---|---|---|
| Party | Candidate | Votes | % | ±% | Expenditures | |||
| Bloc Québécois | Gilles Duceppe | 24,103 | 50.24 | −4.45 | $71,127 | |||
| Liberal | Sébastien Caron | 8,798 | 18.33 | +5.88 | $30,225 | |||
| New Democratic | François Grégoire | 8,209 | 17.11 | +0.44 | $31,151 | |||
| Green | Dylan Perceval-Maxwell | 3,801 | 7.92 | −0.38 | $7,171 | |||
| Conservative | Charles K. Langford | 2,320 | 4.83 | −1.55 | $5,590 | |||
| Rhinoceros | François Yo Gourd | 447 | 0.93 | $388 | ||||
| Marxist–Leninist | Serge Lachapelle | 118 | 0.24 | −0.03 | ||||
| Independent | Daniel "F4J" Laforest | 93 | 0.19 | – | ||||
| Communist | Samie Pagé-Quirion | 86 | 0.17 | −0.03 | $898 | |||
| Total valid votes/Expense limit | 47,975 | 100.00 | $84,641 | |||||
| Total rejected ballots | 406 | 0.84 | ||||||
| Turnout | 48,381 | 61.10 | ||||||
| Canadian federal election, 2006 | ||||||||
|---|---|---|---|---|---|---|---|---|
| Party | Candidate | Votes | % | ±% | Expenditures | |||
| Bloc Québécois | Gilles Duceppe | 26,773 | 54.69 | −5.4 | $74,181 | |||
| New Democratic | François Grégoire | 8,165 | 16.67 | +4.6 | $20,195 | |||
| Liberal | Soeung Tang | 6,095 | 12.45 | −5.2 | $12,436 | |||
| Green | Dylan Perceval-Maxwell | 4,064 | 8.30 | +2.2 | $2,265 | |||
| Conservative | Carlos De Sousa | 3,124 | 6.38 | +3.8 | $15,665 | |||
| Marijuana | Nicky Tanguay | 338 | 0.69 | −0.5 | ||||
| Independent | Jocelyne Leduc | 157 | 0.32 | * | ||||
| Marxist–Leninist | Ginette Boutet | 137 | 0.27 | −0.0 | ||||
| Communist | Evelyn Elizabeth Ruiz | 100 | 0.20 | * | $926 | |||
| Total valid votes/Expense limit | 48,953 | 100.00 | $79,692 | |||||
| Total rejected ballots | 392 | 0.79 | ||||||
| Turnout | 49,345 | 61.26 | ||||||
| Canadian federal election, 2004 | ||||||||
|---|---|---|---|---|---|---|---|---|
| Party | Candidate | Votes | % | ±% | Expenditures | |||
| Bloc Québécois | Gilles Duceppe | 28,728 | 60.1 | +7.3 | $69,284 | |||
| Liberal | Jean-François Thibault | 8,454 | 17.7 | −8.1 | $52,945 | |||
| New Democratic | François Grégoire | 5,779 | 12.1 | +7.3 | $5,400 | |||
| Green | Dylan Perceval-Maxwell | 2,912 | 6.1 | +1.2 | $2,801 | |||
| Conservative | Pierre Albert | 1,224 | 2.6 | −3.8 | $4,658 | |||
| Marijuana | Nicky Tanguay | 572 | 1.2 | −3.7 | ||||
| Marxist–Leninist | Ginette Boutet | 154 | 0.3 | −0.3 | ||||
| Total valid votes/Expense limit | 47,823 | 100.0 | $79,214 | |||||
| Note: Conservative vote is compared to the total of the Canadian Alliance vote and Progressive Conservative vote in the 2000 election in the riding of Laurier—Sainte-Marie. | ||||||||
| Canadian federal election, 2000 | ||||||||
|---|---|---|---|---|---|---|---|---|
| Party | Candidate | Votes | % | ±% | ||||
| Bloc Québécois | Gilles Duceppe | 23,473 | 52.8 | −1.9 | ||||
| Liberal | Jean Philippe Côté | 11,451 | 25.7 | +2.8 | ||||
| Green | Dylan Perceval-Maxwell | 2,169 | 4.9 | +2.5 | ||||
| Marijuana | Marc-Boris St-Maurice | 2,156 | 4.8 | |||||
| New Democratic | Richard Chartier | 2,121 | 4.8 | +0.3 | ||||
| Progressive Conservative | Jean François Tessier | 1,879 | 4.2 | −7.7 | ||||
| Alliance | Stéphane Prud'homme | 960 | 2.2 | |||||
| Marxist–Leninist | Ginette Boutet | 269 | 0.6 | −0.1 | ||||
| Total valid votes | 44,478 | 100.0 | ||||||
| Canadian federal election, 1997 | ||||||||
|---|---|---|---|---|---|---|---|---|
| Party | Candidate | Votes | % | ±% | ||||
| Bloc Québécois | Gilles Duceppe | 26,546 | 54.7 | −7.0 | ||||
| Liberal | David Ly | 11,154 | 23.0 | −1.6 | ||||
| Progressive Conservative | Yanick Deschênes | 5,808 | 12.0 | +6.6 | ||||
| New Democratic | François Degardin | 2,180 | 4.5 | +1.4 | ||||
| Independent | François Gourd | 1,255 | 2.6 | |||||
| Green | Dylan Perceval-Maxwell | 1,167 | 2.4 | −0.2 | ||||
| Marxist–Leninist | Serge Lachapelle | 338 | 0.7 | +0.2 | ||||
| Independent | Mathieu Ravignat | 123 | 0.3 | |||||
| Total valid votes | 48,571 | 100.0 | ||||||
| Canadian federal election, 1993 | ||||||||
|---|---|---|---|---|---|---|---|---|
| Party | Candidate | Votes | % | ±% | Expenditures | |||
| Bloc Québécois | Gilles Duceppe | 25,060 | 61.79 | $39,969 | ||||
| Liberal | Robert Desbiens | 9,940 | 24.51 | −14.56 | $41,625 | |||
| Progressive Conservative | Yvan Routhier | 2,156 | 5.32 | −24.34 | $19,947 | |||
| New Democratic | Alain Gravel | 1,237 | 3.05 | −18.57 | $5,169 | |||
| Green | John Tromp | 1,050 | 2.59 | −0.93 | $1,304 | |||
| Natural Law | Pierre Bergeron | 652 | 1.61 | $0 | ||||
| Marxist–Leninist | Normand Chouinard | 205 | 0.51 | +0.19 | $80 | |||
| N/A (Communist League) | Michel Dugré | 131 | 0.32 | $507 | ||||
| Commonwealth of Canada | Sophie Brassard | 127 | 0.31 | +0.12 | $0 | |||
| Total valid votes | 40,558 | 100.00 | ||||||
| Total rejected ballots | 1,592 | |||||||
| Turnout | 42,150 | 71.29 | +1.96 | |||||
| Electors on the lists | 59,126 | |||||||
| Source: Thirty-fifth General Election, 1993: Official Voting Results, Published by the Chief Electoral Officer of Canada. Financial figures taken from the official contributions and expenses submitted by the candidates, provided by Elections Canada. Percentage change figures are made in relation to the 1988 general election, not the 1990 by-election. | ||||||||
| Canadian federal by-election, 13 August 1990 Death of Jean-Claude Malépart | ||||||||
|---|---|---|---|---|---|---|---|---|
| Party | Candidate | Votes | % | ±% | ||||
| Independent | Gilles Duceppe | 16,818 | 66.9 | |||||
| Liberal | Denis Coderre | 4,812 | 19.1 | −19.9 | ||||
| New Democratic | Louise O'Neill | 1,821 | 7.2 | −14.4 | ||||
| Progressive Conservative | Christian Fortin | 1,120 | 4.5 | −25.2 | ||||
| Green | Michel Szabo | 395 | 1.6 | −1.9 | ||||
| Independent | Daniel Perreault | 123 | 0.5 | |||||
| Independent | Rejean Robidoux | 42 | 0.2 | |||||
| Total valid votes | 25,131 | 100.0 | ||||||
| Canadian federal election, 1988 | ||||||||
|---|---|---|---|---|---|---|---|---|
| Party | Candidate | Votes | % | Expenditures | ||||
| Liberal | Jean-Claude Malepart | 15,956 | 39.07 | $41,754 | ||||
| Progressive Conservative | Charles Hamelin | 12,113 | 29.66 | $35,391 | ||||
| New Democratic | François Beaulne | 8,828 | 21.62 | $42,678 | ||||
| Rhinoceros | Sonia Chatouille Côté | 2,121 | 5.19 | $425 | ||||
| Green | Philippe Champagne | 1,438 | 3.52 | $0 | ||||
| Communist | Marianne Roy | 175 | 0.43 | $1,263 | ||||
| Independent Marxist-Leninist | Hélène Héroux | 130 | 0.32 | $130 | ||||
| Commonwealth of Canada | Daniel Gonzales | 79 | 0.19 | $0 | ||||
| Total valid votes | 40,840 | 100.00 | ||||||
| Total rejected ballots | 729 | |||||||
| Turnout | 41,569 | 69.33 | ||||||
| Electors on the lists | 59,956 | |||||||
| Source: Report of the Chief Electoral Officer, Thirty-fourth General Election, 1988. | ||||||||
See also
References
- "(Code 24031) Census Profile". 2011 census. Statistics Canada. 2012. Retrieved 2011-03-07.
Notes
- ↑ Statistics Canada: 2017
- ↑ Statistics Canada: 2017
- ↑ https://www12.statcan.gc.ca/census-recensement/2016/dp-pd/dt-td/Rp-eng.cfm?LANG=E&APATH=3&DETAIL=0&DIM=0&FL=A&FREE=0&GC=0&GID=0&GK=0&GRP=1&PID=109979&PRID=10&PTYPE=109445&S=0&SHOWALL=0&SUB=888&Temporal=2016,2017&THEME=118&VID=0&VNAMEE=&VNAMEF=
- ↑ Elections Canada – Confirmed candidates for Laurier—Sainte-Marie, 30 September 2015
- ↑ Elections Canada – Preliminary Election Expenses Limits for Candidates Archived 2015-08-15 at the Wayback Machine.
- ↑ Pundits' Guide to Canadian Elections
External links
Riding history from the Library of Parliament:
- Laurier—Sainte-Marie (1987-2003), accessed 5 November 2006
- Laurier (2003-2004), accessed 5 November 2006
- Laurier—Sainte-Marie (2004-present), accessed 5 November 2006
.png)