Drummond (electoral district)
 | |||
| Coordinates: | 45°54′00″N 72°27′00″W / 45.900°N 72.450°WCoordinates: 45°54′00″N 72°27′00″W / 45.900°N 72.450°W | ||
| Federal electoral district | |||
| Legislature | House of Commons | ||
| MP |
New Democratic | ||
| District created | 1966 | ||
| First contested | 1968 | ||
| Last contested | 2015 | ||
| District webpage | profile, map | ||
| Demographics | |||
| Population (2011)[1] | 98,681 | ||
| Electors (2015) | 80,750 | ||
| Area (km²)[2] | 1,670 | ||
| Pop. density (per km²) | 59.1 | ||
| Census divisions | Drummond RCM | ||
| Census subdivisions | Drummondville, Saint-Cyrille-de-Wendover, Saint-Germain-de-Grantham, Wickham | ||
Drummond is a federal electoral district in Quebec, Canada, that has been represented in the House of Commons of Canada since 1968. It was created in 1966 from Drummond—Arthabaska, Nicolet—Yamaska and Richmond—Wolfe.
Geography
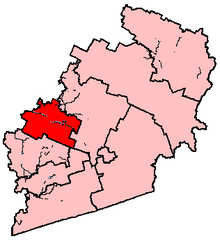
The riding, located along the Saint-François River in the Quebec region of Centre-du-Québec, consists of the RCM of Drummond. The largest city is Drummondville.
The neighbouring ridings are Bas-Richelieu—Nicolet—Bécancour, Richmond—Arthabaska, Shefford, and Saint-Hyacinthe—Bagot.
There were no changes to this riding from the 2012 electoral redistribution.
Members of Parliament
This riding has elected the following Members of Parliament:
| Parliament | Years | Member | Party | |
|---|---|---|---|---|
| Drummond Riding created from Drummond—Arthabaska, Nicolet—Yamaska and Richmond—Wolfe |
||||
| 28th | 1968–1972 | Jean-Luc Pépin | Liberal | |
| 29th | 1972–1974 | Jean-Marie Boisvert | Social Credit | |
| 30th | 1974–1979 | Yvon Pinard | Liberal | |
| 31st | 1979–1980 | |||
| 32nd | 1980–1984 | |||
| 33rd | 1984–1988 | Jean-Guy Guilbault | Progressive Conservative | |
| 34th | 1988–1993 | |||
| 35th | 1993–1997 | Pauline Picard | Bloc Québécois | |
| 36th | 1997–2000 | |||
| 37th | 2000–2004 | |||
| 38th | 2004–2006 | |||
| 39th | 2006–2008 | |||
| 40th | 2008–2011 | Roger Pomerleau | ||
| 41st | 2011–2015 | François Choquette | New Democratic | |
| 42nd | 2015–Present | |||
Election results
| Canadian federal election, 2015 | ||||||||
|---|---|---|---|---|---|---|---|---|
| Party | Candidate | Votes | % | ±% | Expenditures | |||
| New Democratic | François Choquette | 15,833 | 30.5 | -21.1 | $46,839.41 | |||
| Liberal | Pierre Côté | 13,793 | 26.5 | +18.1 | $17,306.35 | |||
| Bloc Québécois | Diane Bourgeois | 11,862 | 22.8 | +0.8 | $34,502.97 | |||
| Conservative | Pascale Déry | 9,221 | 17.7 | +1.8 | $58,680.41 | |||
| Green | Émile Coderre | 1,270 | 2.4 | +0.3 | – | |||
| Total valid votes/Expense limit | 51,979 | 100.0 | $217,456.41 | |||||
| Total rejected ballots | 1,098 | – | – | |||||
| Turnout | 53,077 | – | – | |||||
| Eligible voters | 81,303 | |||||||
| New Democratic hold | Swing | -19.6 | ||||||
| Source: Elections Canada[3][4] | ||||||||
| Canadian federal election, 2011 | ||||||||
|---|---|---|---|---|---|---|---|---|
| Party | Candidate | Votes | % | ±% | Expenditures | |||
| New Democratic | François Choquette | 24,489 | 51.6 | +34.8 | ||||
| Bloc Québécois | Roger Pomerleau | 10,410 | 22.0 | -16.8 | ||||
| Conservative | Normand W. Bernier | 7,555 | 15.9 | -9.4 | ||||
| Liberal | Pierre Côté | 3,979 | 8.4 | -8.4 | ||||
| Green | Robin Fortin | 987 | 2.1 | -0.4 | ||||
| Total valid votes/Expense limit | 47,420 | 100.0 | ||||||
| Total rejected ballots | 878 | 1.82 | -0.38 | |||||
| Turnout | 48,298 | 62.59 | – | |||||
| Eligible voters | 77,162 | – | – | |||||
| Canadian federal election, 2008 | ||||||||
|---|---|---|---|---|---|---|---|---|
| Party | Candidate | Votes | % | ±% | Expenditures | |||
| Bloc Québécois | Roger Pomerleau | 17,613 | 38.8 | -10.9 | $41,200 | |||
| Conservative | André Komlosy | 11,490 | 25.3 | +3.0 | $77,182 | |||
| Liberal | Jean Courchesne | 7,697 | 17.0 | +0.6 | $13,625 | |||
| New Democratic | Annick Corriveau | 7,640 | 16.8 | +10.5 | $6,172 | |||
| Green | Réginald Gagnon | 1,144 | 2.5 | -2.8 | ||||
| Total valid votes/Expense limit | 45,404 | 100.0 | $82,531 | |||||
| Total rejected ballots | 1,022 | 2.20 | ||||||
| Turnout | – | – | ||||||
| Canadian federal election, 2006 | ||||||||
|---|---|---|---|---|---|---|---|---|
| Party | Candidate | Votes | % | ±% | Expenditures | |||
| Bloc Québécois | Pauline Picard | 22,575 | 49.7 | -6.6 | $38,371 | |||
| Conservative | Jean-Marie Pineault | 10,134 | 22.3 | +5.4 | $51,057 | |||
| Liberal | Éric Cardinal | 7,437 | 16.4 | -6.4 | $75,543 | |||
| New Democratic | François Choquette | 2,870 | 6.3 | +4.5 | $1,903 | |||
| Green | Jean-Benjamin Milot | 2,418 | 5.3 | +3.1 | $865 | |||
| Total valid votes/Expense limit | 45,434 | 100.0 | $76,054 | |||||
| Canadian federal election, 2004 | ||||||||
|---|---|---|---|---|---|---|---|---|
| Party | Candidate | Votes | % | ±% | Expenditures | |||
| Bloc Québécois | Pauline Picard | 23,670 | 56.3 | +11.2 | $55,860 | |||
| Liberal | Roger Gougeon | 9,591 | 22.8 | -11.4 | $60,104 | |||
| Conservative | Lyne Boisvert | 7,123 | 16.9 | -2.7 | $72,925 | |||
| Green | Louis Lacroix | 921 | 2.2 | – | ||||
| New Democratic | Blake Evans | 745 | 1.8 | +0.8 | ||||
| Total valid votes/Expense limit | 42,050 | 100.0 | $73,968 | |||||
Note: Conservative vote is compared to the total of the Canadian Alliance vote and Progressive Conservative vote in the 2000 election.
| Canadian federal election, 2000 | ||||||||
|---|---|---|---|---|---|---|---|---|
| Party | Candidate | Votes | % | ±% | ||||
| Bloc Québécois | Pauline Picard | 18,843 | 45.1 | +2.9 | ||||
| Liberal | André Béliveau | 14,285 | 34.2 | +11.1 | ||||
| Progressive Conservative | Lyne Boisvert | 6,593 | 15.8 | -17.8 | ||||
| Alliance | Jacques Laurin | 1,606 | 3.8 | |||||
| New Democratic | Julie Philion | 424 | 1.0 | 0.0 | ||||
| Total valid votes | 41,751 | 100.0 | ||||||
| Canadian federal election, 1997 | ||||||||
|---|---|---|---|---|---|---|---|---|
| Party | Candidate | Votes | % | ±% | ||||
| Bloc Québécois | Pauline Picard | 18,577 | 42.3 | -12.5 | ||||
| Progressive Conservative | Lyne Boisvert | 14,777 | 33.6 | +13.7 | ||||
| Liberal | Christian Méthot | 10,165 | 23.1 | -0.9 | ||||
| New Democratic | Alexandra Philoctéte | 441 | 1.0 | -0.3 | ||||
| Total valid votes | 43,960 | 100.0 | ||||||
| Canadian federal election, 1993 | ||||||||
|---|---|---|---|---|---|---|---|---|
| Party | Candidate | Votes | % | ±% | ||||
| Bloc Québécois | Pauline Picard | 24,930 | 54.8 | |||||
| Liberal | Bernard Boudreau | 10,935 | 24.0 | -10.7 | ||||
| Progressive Conservative | Jean-Guy Guilbault | 9,041 | 19.9 | -33.7 | ||||
| New Democratic | Ferdinand Berner | 600 | 1.3 | -10.4 | ||||
| Total valid votes | 45,506 | 100.0 | ||||||
| Canadian federal election, 1988 | ||||||||
|---|---|---|---|---|---|---|---|---|
| Party | Candidate | Votes | % | ±% | ||||
| Progressive Conservative | Jean-Guy Guilbault | 23,703 | 53.5 | -2.7 | ||||
| Liberal | Jean-Claude Lagacé | 15,380 | 34.7 | +1.2 | ||||
| New Democratic | Ferdinand Berner | 5,204 | 11.8 | 5.6 | ||||
| Total valid votes | 44,287 | 100.0 | ||||||
| Canadian federal election, 1984 | ||||||||
|---|---|---|---|---|---|---|---|---|
| Party | Candidate | Votes | % | ±% | ||||
| Progressive Conservative | Jean-Guy Guilbault | 23,693 | 56.2 | +41.5 | ||||
| Liberal | Michel Yip | 14,137 | 33.6 | -39.2 | ||||
| New Democratic | Louis G. Garreau | 2,610 | 6.2 | -0.2 | ||||
| Parti nationaliste | Camillien Belhumeur | 1,057 | 2.5 | |||||
| Independent | Joseph Richard Miller | 338 | 0.8 | |||||
| Social Credit | René Martineau | 301 | 0.7 | -4.6 | ||||
| Total valid votes | 42,136 | 100.0 | ||||||
| Canadian federal election, 1980 | ||||||||
|---|---|---|---|---|---|---|---|---|
| Party | Candidate | Votes | % | ±% | ||||
| Liberal | Yvon Pinard | 26,082 | 72.8 | +15.6 | ||||
| Progressive Conservative | Gilbert Lapointe | 5,265 | 14.7 | +0.4 | ||||
| New Democratic | André Lefebvre | 2,305 | 6.4 | +4.8 | ||||
| Social Credit | Henri Farley | 1,916 | 5.3 | -19.6 | ||||
| Union populaire | Gaétan Giroux | 180 | 0.5 | +0.2 | ||||
| Marxist–Leninist | J.-P. Ginchereau | 97 | 0.3 | +0.1 | ||||
| Total valid votes | 35,845 | 100.0 | ||||||
| Canadian federal election, 1979 | ||||||||
|---|---|---|---|---|---|---|---|---|
| Party | Candidate | Votes | % | ±% | ||||
| Liberal | Yvon Pinard | 22,989 | 57.2 | +15.0 | ||||
| Social Credit | Robert Biron | 10,010 | 24.9 | -17.2 | ||||
| Progressive Conservative | Paul Lavigne | 5,746 | 14.3 | +0.2 | ||||
| Rhinoceros | Normand Blanchette | 641 | 1.6 | |||||
| New Democratic | Patricia Lamarre | 639 | 1.6 | -0.1 | ||||
| Union populaire | Marc Rochefort | 106 | 0.3 | |||||
| Marxist–Leninist | J.-P. Ginchereau | 67 | 0.2 | |||||
| Total valid votes | 40,198 | 100.0 | ||||||
| Canadian federal election, 1974 | ||||||||
|---|---|---|---|---|---|---|---|---|
| Party | Candidate | Votes | % | ±% | ||||
| Liberal | Yvon Pinard | 15,561 | 42.1 | +0.1 | ||||
| Social Credit | Jean-Marie Boisvert | 15,548 | 42.1 | -0.1 | ||||
| Progressive Conservative | Armand Cyrenne | 5,186 | 14.0 | -0.1 | ||||
| New Democratic | Gisel Marotte | 630 | 1.7 | +0.1 | ||||
| Total valid votes | 36,925 | 100.0 | ||||||
| Canadian federal election, 1972 | ||||||||
|---|---|---|---|---|---|---|---|---|
| Party | Candidate | Votes | % | ±% | ||||
| Social Credit | Jean-Marie Boisvert | 15,923 | 42.2 | +10.7 | ||||
| Liberal | Jean-Luc Pépin | 15,853 | 42.0 | +3.5 | ||||
| Progressive Conservative | Roger Rousseau | 5,351 | 14.2 | -13.4 | ||||
| New Democratic | Ann Dewitt | 590 | 1.6 | -0.8 | ||||
| Total valid votes | 37,717 | 100.0 | ||||||
Note: Social Credit vote is compared to Ralliement créditiste vote in the 1968 election.
| Canadian federal election, 1968 | ||||||||
|---|---|---|---|---|---|---|---|---|
| Party | Candidate | Votes | % | |||||
| Liberal | Jean-Luc Pépin | 11,667 | 38.5 | |||||
| Ralliement créditiste | Claude Proulx | 9,545 | 31.5 | |||||
| Progressive Conservative | André Biron | 8,342 | 27.6 | |||||
| New Democratic | Pierre Gagné | 723 | 2.4 | |||||
| Total valid votes | 30,277 | 100.0 | ||||||
See also
References
- "(Code 24018) Census Profile". 2011 census. Statistics Canada. 2012. Retrieved 2011-03-07.
- 2011 Results from Elections Canada at Archive.is (archived January 15, 2013)
- Riding history from the Library of Parliament
- Campaign expense data from Elections Canada