Rivière-des-Mille-Îles (electoral district)
 | |||
| Federal electoral district | |||
| Legislature | House of Commons | ||
| MP |
Liberal | ||
| District created | 1996 | ||
| First contested | 1997 | ||
| Last contested | 2015 | ||
| District webpage | profile, map | ||
| Demographics | |||
| Population (2011)[1] | 102,816 | ||
| Electors (2015) | 80,957 | ||
| Area (km²)[2] | 117 | ||
| Pop. density (per km²) | 878.8 | ||
| Census divisions | Deux-Montagnes RCM, Thérèse-De Blainville RCM | ||
| Census subdivisions | Saint-Eustache, Boisbriand, Deux-Montagnes, Rosemère | ||
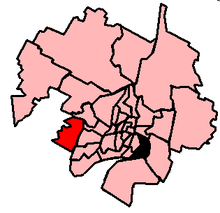
Rivière-des-Mille-Îles (formerly known as Saint-Eustache—Sainte-Thérèse) is a federal electoral district in Quebec, Canada, that has been represented in the House of Commons of Canada since 1997.
Geography
This riding is located in the northern suburbs of Montreal, on the north shore of the Rivière des Mille-Îles. Since 2003, it has consisted of the cities of Deux-Montagnes, Saint-Eustache and Sainte-Marthe-sur-le-Lac in the Regional County Municipality of Deux-Montagnes; and the City of Boisbriand in the Regional County Municipality of Thérèse-De Blainville.
The neighbouring ridings are Argenteuil—Papineau—Mirabel, Marc-Aurèle-Fortin, Laval, Laval—Les Îles, and Pierrefonds—Dollard.
Demographics
- According to the Canada 2011 Census; 2013 representation[3][4]
Ethnic groups: 94.0% White, 1.4% Black, 1.1% Southeast Asian
Languages: 85.5% French, 8.2% English, 1.8% Yiddish
Religions: 83.7% Christian (78.4% Catholic, 5.3% Other), 3.1% Jewish, 1.1% Muslim, 12.2% No religion
Median income (2010): $31,752
Average income (2010): $39,705
History
It was created in 1996 as "Saint-Eustache—Sainte-Thérèse" riding from parts of Blainville—Deux-Montagnes riding.
It was renamed "Rivière-des-Mille-Îles" in 1998.
This riding lost territory to Mirabel and gained territory from Marc-Aurèle-Fortin during the 2012 electoral redistribution.
Members of Parliament
| Parliament | Years | Member | Party | |
|---|---|---|---|---|
| Saint-Eustache—Sainte-Thérèse Riding created from Blainville—Deux-Montagnes |
||||
| 36th | 1997–2000 | Gilles Perron | Bloc Québécois | |
| Rivière-des-Mille-Îles | ||||
| 37th | 2000–2004 | Gilles Perron | Bloc Québécois | |
| 38th | 2004–2006 | |||
| 39th | 2006–2008 | |||
| 40th | 2008–2011 | Luc Desnoyers | ||
| 41st | 2011–2015 | Laurin Liu | New Democratic | |
| 42nd | 2015–Present | Linda Lapointe | Liberal | |
Election results
Rivière-des-Mille-Îles
| Canadian federal election, 2015 | ||||||||
|---|---|---|---|---|---|---|---|---|
| Party | Candidate | Votes | % | ±% | Expenditures | |||
| Liberal | Linda Lapointe | 18,787 | 32.37 | +21.27 | $24,179.08 | |||
| New Democratic | Laurin Liu | 17,111 | 29.48 | -19.64 | $54,641.76 | |||
| Bloc Québécois | Félix Pinel | 14,755 | 25.42 | -1.70 | $40,335.73 | |||
| Conservative | Érick Gauthier | 6,099 | 10.51 | +0.21 | $31,082.28 | |||
| Green | Alec Ware | 1,136 | 1.96 | -0.41 | $665.90 | |||
| Independent | Luis Quinteros | 158 | 0.27 | n/a | – | |||
| Total valid votes/Expense limit | 58,046 | 100.00 | $217,630.75 | |||||
| Total rejected ballots | 927 | 1.57 | – | |||||
| Turnout | 58,973 | 72.42 | – | |||||
| Eligible voters | 81,429 | |||||||
| Liberal gain from New Democratic | Swing | +20.45 | ||||||
| Source: Elections Canada[5][6] | ||||||||
| 2011 federal election redistributed results[7] | |||
|---|---|---|---|
| Party | Vote | % | |
| New Democratic | 25,758 | 49.1 | |
| Bloc Québécois | 14,223 | 27.1 | |
| Liberal | 5,819 | 11.1 | |
| Conservative | 5,399 | 10.3 | |
| Green | 1,242 | 2.4 | |
| Canadian federal election, 2011 | ||||||||
|---|---|---|---|---|---|---|---|---|
| Party | Candidate | Votes | % | ±% | Expenditures | |||
| New Democratic | Laurin Liu | 25,639 | 49.2 | +35.9 | ||||
| Bloc Québécois | Luc Desnoyers | 14,873 | 28.5 | -16.8 | ||||
| Liberal | Denis Joannette | 5,300 | 10.2 | -7.2 | ||||
| Conservative | Lucie Leblanc | 5,057 | 9.7 | -9.8 | ||||
| Green | Gilles Bisson | 1,229 | 2.4 | -1.8 | ||||
| Total valid votes/Expense limit | 52,098 | 100.0 | ||||||
| Total rejected ballots | 973 | 1.8 | – | |||||
| Turnout | 53,071 | 66.8 | – | |||||
| Eligible voters | 79,428 | – | ||||||
| Canadian federal election, 2008 | ||||||||
|---|---|---|---|---|---|---|---|---|
| Party | Candidate | Votes | % | ±% | Expenditures | |||
| Bloc Québécois | Luc Desnoyers | 23,216 | 45.7 | -8.2 | $52,131 | |||
| Conservative | Claude Carignan | 9,911 | 19.5 | -1.4 | $81,773 | |||
| Liberal | Denis Joannette | 8,823 | 17.4 | +4.6 | $15,359 | |||
| New Democratic | Normand Beaudet | 6,741 | 13.3 | +6.3 | $1,453 | |||
| Green | Marie Martine Bédard | 2,134 | 4.2 | -1.2 | $3,053 | |||
| Total valid votes/Expense limit | 50,825 | 100.0 | $83,475 | |||||
| Canadian federal election, 2006 | ||||||||
|---|---|---|---|---|---|---|---|---|
| Party | Candidate | Votes | % | ±% | ||||
| Bloc Québécois | Gilles Perron | 26,272 | 53.9 | -7.5 | $28,133 | |||
| Conservative | Érick Gauthier | 10,173 | 20.9 | +14.2 | $5,917 | |||
| Liberal | Robert Frégeau | 6,239 | 12.8 | -11.4 | $30,097 | |||
| New Democratic | Francis Chartrand | 3,418 | 7.0 | +3.6 | $1,522 | |||
| Green | Marie Martine Bédard | 2,643 | 5.4 | +1.1 | $1,860 | |||
| Total valid votes/Expense limit | 48,745 | 100.0 | $76,468 | |||||
| Canadian federal election, 2004 | ||||||||
|---|---|---|---|---|---|---|---|---|
| Party | Candidate | Votes | % | ±% | Expenditures | |||
| Bloc Québécois | Gilles Perron | 27,993 | 61.4 | +12.0 | $36,071 | |||
| Liberal | Yolaine Savignac | 11,025 | 24.2 | -10.2 | $36,430 | |||
| Conservative | Érick Gauthier | 3,064 | 6.7 | -5.6 | $6,653 | |||
| Green | Marie Martine Bédard | 1,961 | 4.3 | +1.8 | $1,319 | |||
| New Democratic | Nicolas Du Cap | 1,559 | 3.4 | +2.0 | $411 | |||
| Total valid votes/Expense limit | 45,602 | 100.0 | $74,324 | |||||
Note: Conservative vote is compared to the total of the Canadian Alliance vote and Progressive Conservative vote in 2000 election.
| Canadian federal election, 2000 | ||||||||
|---|---|---|---|---|---|---|---|---|
| Party | Candidate | Votes | % | ±% | ||||
| Bloc Québécois | Gilles Perron | 26,508 | 49.4 | +3.0 | ||||
| Liberal | Robert Fragasso | 18,456 | 34.4 | +5.1 | ||||
| Alliance | François Desrochers | 3,677 | 6.9 | |||||
| Progressive Conservative | Jonathan Paquette | 2,935 | 5.5 | -17.1 | ||||
| Green | Eric Squire | 1,329 | 2.5 | |||||
| New Democratic | Stéphane Thinel | 739 | 1.4 | -0.3 | ||||
| Total valid votes | 53,644 | 100.0 | ||||||
Saint-Eustache—Sainte-Thérèse
| Canadian federal election, 1997 | ||||||||
|---|---|---|---|---|---|---|---|---|
| Party | Candidate | Votes | % | |||||
| Bloc Québécois | Gilles Perron | 25,807 | 46.5 | |||||
| Liberal | Yolaine Savignac | 16,280 | 29.3 | |||||
| Progressive Conservative | Jean Blanchard | 12,522 | 22.5 | |||||
| New Democratic | Valérie Kinslow | 947 | 1.7 | |||||
| Total valid votes | 55,556 | 100.0 | ||||||
See also
References
- "(Code 24057) Census Profile". 2011 census. Statistics Canada. 2012. Retrieved 2011-03-07.
- Campaign expense data from Elections Canada
- Riding history for Saint-Eustache—Sainte-Thérèse from the Library of Parliament
- Riding history for Rivière-des-Mille-Îles from the Library of Parliament
- 2011 Results from Elections Canada
Notes
- ↑ Statistics Canada: 2011
- ↑ Statistics Canada: 2011
- ↑ http://www12.statcan.gc.ca/nhs-enm/2011/dp-pd/prof/details/page.cfm?Lang=E&Geo1=FED2013&Code1=24062&Data=Count&SearchText=Riviere&SearchType=Begins&SearchPR=01&A1=All&B1=All&Custom=&TABID=1
- ↑ http://www12.statcan.gc.ca/nhs-enm/2011/dp-pd/prof/details/page.cfm?Lang=E&Geo1=FED2013&Code1=24062&Data=Count&SearchText=Riviere&SearchType=Begins&SearchPR=01&A1=All&B1=All&Custom=&TABID=1#tabs2
- ↑ Elections Canada – Confirmed candidates for Rivière-des-Mille-Îles, 30 September 2015
- ↑ Elections Canada – Preliminary Election Expenses Limits for Candidates
- ↑ Pundits' Guide to Canadian Elections